Chapter 17 Data analysis: putting all these skills into use
So far we have learned the tools, one-by-one. We have covered for loops, file system, data frames, plotting and much more. It is like you have been at a carpentry school where you learned how to use hammer, saw and all the other tools. Now it is time to learn to build a house.
In terms of data science, the house is “data analytics”, using data to tell a story, to get insights about certain real-world problems. In a similar fashion as you need all the carpentry tools to build a house, you’ll need a lot of data processing tools to do data analytics. The importance of analytics is increasing in the age of AI, as you can easily get help about technical details.
17.1 Graphical analysis
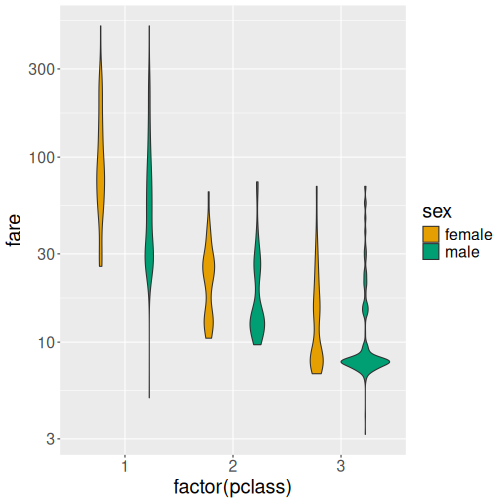
17.1.1 Titanic fare by passenger class
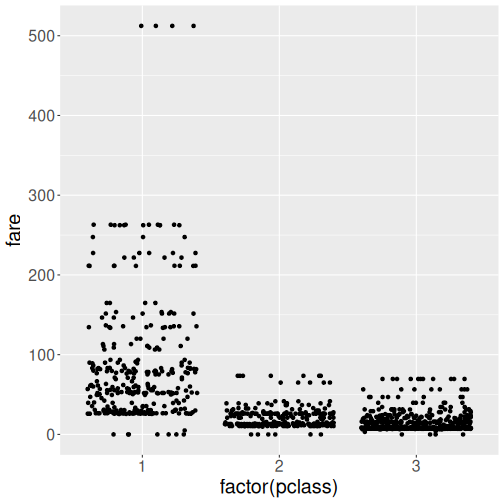
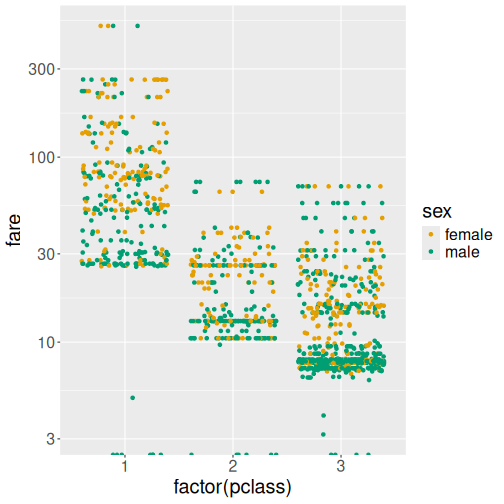
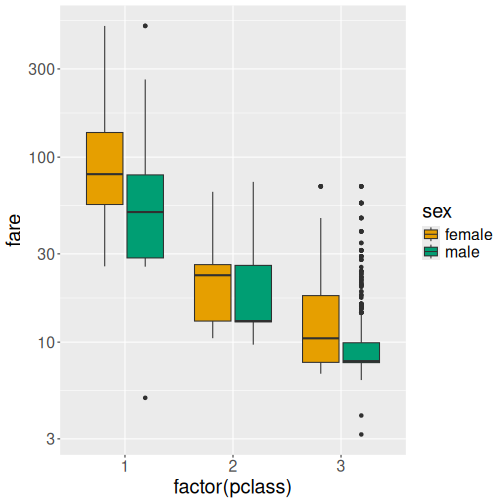
Let’s use Titanic data to answer answer the question: did upper class passengers on Titanc pay more for the fare? How much more? Are there any differences between men and women?
titanic <- read_delim(
   "data/titanic.csv.bz2")
titanic %>%
   ggplot(aes(fare)) +
   geom_histogram(bins = 50) +
   facet_wrap(~pclass)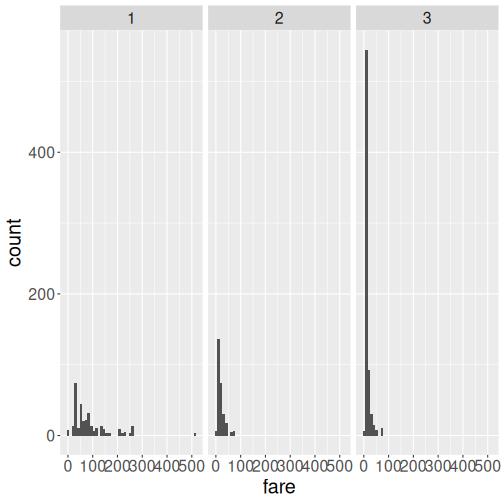
TBD: finish titanic and fare section
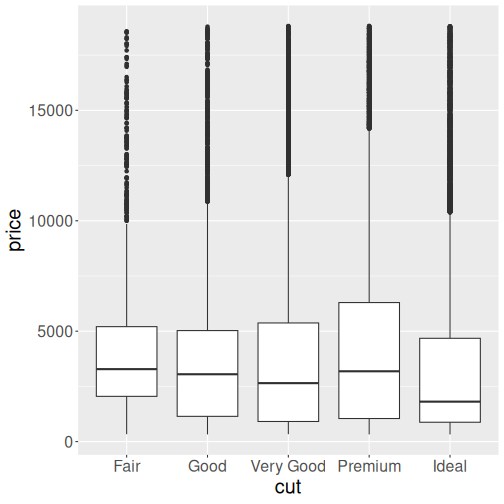
TBD: finish diamonds and price section