E The shiny Framework
Instead of providing users with only static images or tables, it is often useful to set up an interactive environment where users can experiment with the data themselves and receive immediate feedback. Nowadays it is fairly easy thanks to powerful browsers and javascript libraries.
In this chapter, we describe the Shiny framework for building interactive applications in R. Shiny provides a structure for communicating between a user-interface (i.e., a web-browser) and an R session, allowing users to interactively change the “code” that is run and the data that are output. This not only enables developers to create interactive graphics, but provides a way for users to interact directly with an R session.
Shiny is one of the most popular ways to create interactive apps using R, largely thanks to its simplicity. It also has free online repository, shinyapps.io where one can host their apps.
Technically, a running shiny application consists of a web server that creates the webpage you can see in the browser. The web server is started automatically when you run your app. It can also run your code (and normally it does) for, e.g. creating plots and analyzing data. Besides running your code, it listens for user inputs (e.g. clicking on checkboxes or selecting menu items) and tells your code about what the user did.
So shiny is a way to create a web app that has both front end (what you see in your browser), and backend (the R code that does the data analysis). A dedicated back-end allows for much more powerful data analysis and security compared to apps that are only based on front end code (javascript libraries).
E.1 Writing Shiny Applications
Shiny is a web application framework for R. As opposed to a simple (static) web page like you’ve created with R Markdown, a web application is an interactive, dynamic web page—the user can click on buttons, check boxes, or input text in order to change the presentation of the data, or otherwise the feel and look of the webpage. Shiny is a framework in that it automatically create the code for producing and enabling this interaction, while you as the developer simply “fill in the blanks” by providing variables or functions that the shiny library will utilize to create the interactive page.
The shiny framework can be enabled by loading the shiny package, so you will need to install and load it in order to use it:
This will make all of the framework functions and variables you will need to work with available.
Fortunately, shiny does most of the hard work related to setting up a web server and providing communication between your code and the user interactions. You only have to write your data analysis code, and define the server-side and the user-interface (UI) side of the app.
E.1.1 Creating Shiny Apps in RStudio
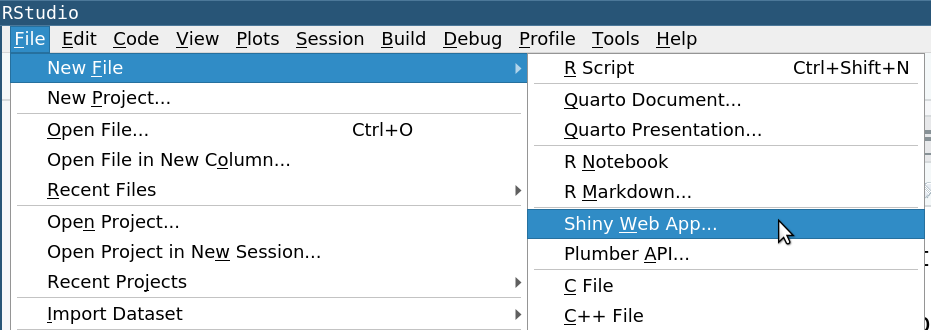
The menu option File → New File → Shiny Web App is the easiest way to create a new shiny app.
Rstudio offers good templates for getting started with shiny apps. The easiest way to start with a new shiny app is to create a new template through the menu File → New File → Shiny Web App. This opens a small dialog window asking for the name of the app, and whether it is a single- or a multi-file app (more about it below). If you choose the single-file option, RStudio creates a folder with the given app name, and calls the code inside app.R. If you choose the multi-file option, it creates two files inside the folder, one called ui.R and the other called server.R.
Very conveniently for beginners, it also fills the files with a functioning app (one that explores Old Faithful geyser eruptions) so you have a fully-functional template that you can start modifying for your own needs.
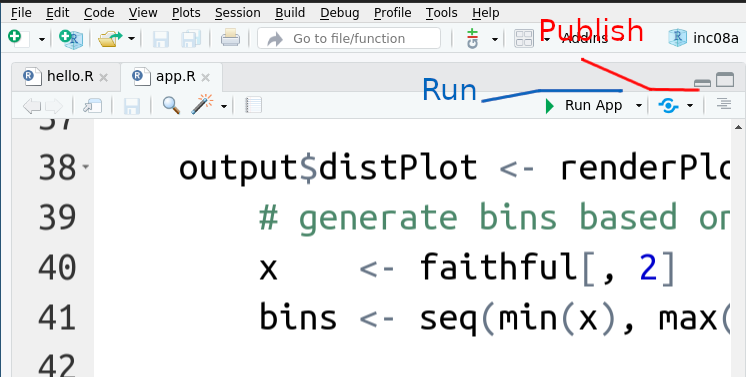
Finally, when editing shiny apps, RStudio code window will include buttons Run App and Publish. The former just runs to app in your computer, the other can be used to publish it at shinyapps.io.
E.1.2 UI and Server
As explained above, shiny creates a UI-server (backend-frontend) based web app. As one can expect, the central parts of the app code are UI and server. If you build a single-file based applications, then the UI will be a user interface element (normally fluidPage, see Section E.2 below), and server is a function. When you run the app, the server function is run in a special way, in a way that build the communication with the UI. UI, however, is used to build a website that the built-in shiny webserver will display.
More specifically
The User Interface (UI) defines how the application will be displayed in the browser. The UI can render R content such as text or graphics just like R Markdown, but it can also include widgets. Widgets are interactive controls, such as buttons, sliders and menus. The UI will specify a layout for these components. For instance, you can put menus above and buttons below your plot, while choose to have no sliders.
The UI for a Shiny application is defined as a value, usually one returned from calling a layout function. For example (see also the image below):
## The ui is the result of calling the `fluidPage()` layout function
ui <- fluidPage(
   ## A widget: a text input box (save input in the `username` key)
   textInput("username", label = "What is your name?"),
   ## An output element: a text output (for the `message` key)
   textOutput("message")
)
This UI defines a fluidPage where the content flows “fluidly” down the page. It contains two content elements: a text input box where the user can type their name, and some outputted text based on the
messagevariable.The Server defines the data that will be displayed through the UI. You can think of this as a set of R functions that the user will be able to “run” by clicking the buttons and moving the sliders. The script will take in inputs from the user (based on their interactions) and generate outputs that the UI will then display. In this example, it takes a text input (username) and combines and dispalys “Hello <username>”.
The server uses reactive expressions, which are like functions that will automatically be re-run whenever the input changes. This allows the output to be dynamic and interactive.The Server for a Shiny application is defined as a function (as opposed to the UI which is a value). This function takes in two lists as argments: an
inputandoutput. It then uses render functions and reactive expressions that assign values to theoutputlist based on theinputlist. For example:## The server is a function that takes `input` and `output` args server <- function(input, output) { ## assign a value to the `message` key in `output` ## argument is a reactive expression for showing text output$message <- renderText({ ## use the `username` key from input and and return new value ## for the `message` key in output paste("Hello", input$username) }) }
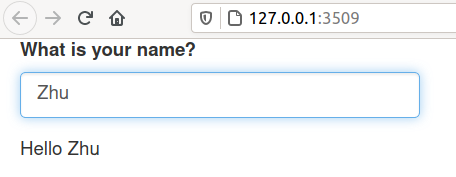
Combined, this UI and server will allow the user to type their name into an input box, and will then say “hello” to whatever name is typed in. Shiny sets up a communication channel between the UI and server, so as soon as you start typing the name, the letters you have already typed appear in the message.
Technically, for each letter you type, shiny calls the server
function with a list argument input. The lists component username
contains the name that the user typed (or just the letters the user
has typed so far). Now server uses the input to update the component
message in the output list by combining “Hello” and the username,
and puts the result into the message component of the output
list.
Thereafter UI takes the field output$message and renders it as
text below the input box. Thereafter it waits for the next user input
and calls server again as soon as the user adds another character to
the name.
E.1.3 Combining UI and Server
In order for the app to run, you need to combine the UI and the server. There are two ways for doing this:
The first (and simpler) way is to define a file called app.R. This
file should define the server and UI as above, and afterwards call the shinyApp() function, which takes a UI value and Server function as arguments. For example:
Executing the shinyApp() function will start the App (you can also
click the “Run App” button at the top of RStudio). In order to
stop the App, you can hit the “Stop Sign” icon on the
RStudio console, or just close the viewer.
If you change the UI or the Server, you do not need to stop and start the app; you can simply refresh the browser or RStudio viewer window and it will reload the updated version.
Using this approach allows you to define your entire application (UI and Server) in a single file. This is good way of creating simple applications that you wish to share with others, since the entire application code can be listed in a single file.
Alternatively, you can also define the UI and server as separate
files. This allows you to keep the presentation (UI) separated from
the logic (server) of your application, making it easier to maintain
and develop it in the future. To do this, you define two separate files: ui.R for the UI and server.R for the Server (the files must be named ui.R and server.R). In these files, you must call the functions shinyUI() and shinyServer() respectively to create the UI and server, and then RStudio will automatically combine these files together into an application:
# In server.R file
server <- function(input, output) {
  # define output reactive expressions
}
shinyServer(server)
Whichever way you choose, RStudio will create you a suitable template as explained above.
Finally, for larger projects you may have more than two code files.
In particular the server tasks tend to grow large as the data
processing may be complex. In such case you may create several files
then use source() to load them into the app.R or server.R file.
This chapter will primarily use the “single file” approach for compactness and readability, but you are encouraged to break up the UI and server into separate files for your own, larger applications.
E.2 The UI
The UI defines how the app will be displayed in the browser, and what will be displayed on different locations on the page. UI is normally made out of elements, you can imagine those a boxes of different size that contain outputs, such as plots and tables; and sliders and other tools you can use to manipulate the output. The main role of UI in shiny is to specify how to place those boxes on the webpage.
You create a UI by calling a layout function. Normally you want
to use
fluidPage() that creates a
“fluid” page, a webpage that adjusts its content location when you
resize it, or zoom in or out.
It returns a UI definition that can be used by
the functions that actually run the app, such as shinyApp() or
shinyUI(). fluidPage()
E.2.1 UI Content Elements
The layout functions, including fluidPage(), take
arguments that specify the content elements
that should be displayed on the page. For instance, we can place
three elements underneath each other with
In the real code, you need to replace the “element” with the functions that create the specific UI elements.
textOutput element, is created
by the server, UI will display it but does not “know” its content.
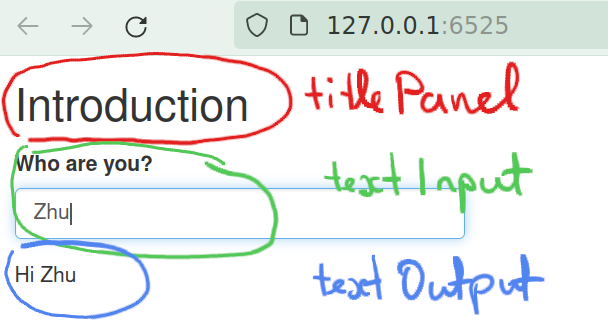
Let’s now make a real example with three layout elements: the page title, a text input box, and a text message (see the figure at right):
## ui is a value what fluidPage returns!
ui <- fluidPage(
   titlePanel("Introduction"),
   textInput("name",
             label = "Who are you?"),
   textOutput("message")
)
Now the fluidPage() function contains three calls. First (and at
the top), titlePanel() will
create the page title, the
word “Introduction” in big and bold font.
textInput() will create an element where the user can enter text,
and textOutput will create an element that can have dynamic
(changing) text content.
Content elements are often defined in a
nested fashion–elements inside other elements. For instance,
we can have one element sidebarLayout (this specifies the complete
page layout) that
contains two further elements sidebarPanel and mainPanel. (More
precisely: sidebarLayout is not a content element but a function
that creates such an element.)
Sidebar
layout is often used in simple apps where you have a narrow panel
with control widgets on the left-hand side and a large panel with the
main content (such as plot) on the right hand side.
Note that many layout functions take arguments that are other layout
elements and arrange those into their layout. E.g. sidebarLayout
takes two layout elements as arguments, and arranges those in a way
that the first one is placed on the left side and given little space, the
other is placed on the right hand side and given more space. In this
way it is possible to include a layout inside another layout.
This allows you to create complex layouts by combining multiple layout elements together. For example:
ui <- fluidPage(
   titlePanel("My Title"),  # include panel with the title (also sets browser title)

   sidebarLayout(   # underneath the title, use sidebar layout
      sidebarPanel(  # specify content for the narrow sidebar
         p("See plot at right")
      ),
      mainPanel(     # specify content for the wide "main" panel
         plotOutput("plot")
      )
   )
)
See the Shiny documentation and gallery for details and examples of doing complex application layouts.
E.2.2 Including text and html elements
Much of Shiny’s styling and layout structure is based on the Bootstrap web framework.
You can include static (unchanging) content in a Shiny UI layout—this is similar to the kinds of content you would write in Markdown (rather than through R code) when using R Markdown. However, you usually don’t specify this content using Markdown syntax (though it is possible to include a markdown file’s content). Instead, you include content functions that produce HTML, the language that Markdown is converted to when you look at it in the browser. These functions include:
p()for creating paragraphs, the same as plain text in Markdownh1(),h2(),h3()etc for creating headings, the same as# Heading 1,## Heading 2,### Heading 3in Markdownem()for creating emphasized (italic) text, the same as_text_in Markdownstrong()for creating strong (bolded) text, the same as**text**in Markdowna(text, href='url')for creating hyperlinks (anchors), the same as[text](url)in Markdownimg(text, src='url')for including images, the same asin Markdown. For images on the web, you can just enter the url, such ashttps://www.example.com/img.jpg. However, if you want to show your own image that is stored in your computer, you need to create a folder named “www” inside your app folder, and place the image there. For instanceimg(src = "dolphin.jpg")is equivalent to the relative pathwww/dolphin.jpginside your app folder.
Shiny shows a static page, constructed using various html elements.
For instance, we can put elements h1(), p() and img() underneath
each other as:
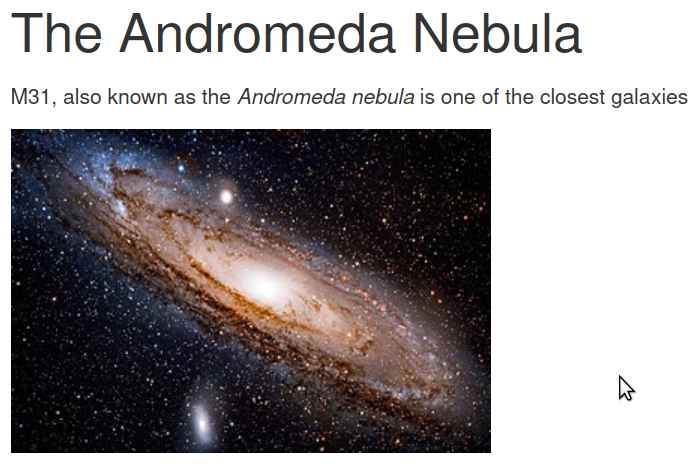
ui <- fluidPage(
   h1("The Andromeda Nebula"),
   p("M31, also known as the ",
     em("Andromeda nebula"),
     "is one of the closest galaxies"),
   img(alt = "Image of M31",
       src =
          "https://upload.wikimedia.org/wikipedia/commons/thumb/8/8c/Andromeda_Galaxy_560mm_FL.jpg/320px-Andromeda_Galaxy_560mm_FL.jpg"
       )
)
This results in a static page as seen at right. h1() creates the
title, p() the paragraph of text, and img() is responsible for the
image.
Note also that the elements can be nested, p() contains a em(),
resulting in a few italic words in the paragraph.
These functions are a subset of shiny
tags, a more
comprehensive way to add html structure to the text in shiny. For
instance, instead of p("A paragraph") you can write tags$p("A paragraph"). For paragraphs, this is usually not needed, but there
are a number of tags that do not have their dedicated function.
There are many other methods as well, see this tutorial lesson for a list. If you are familiar with HTML, then these methods will seem familiar; you can also write content in HTML directly using the tag() content function.
E.2.3 Control Widgets
When you design an interactive app, you most likely want to include control widgets as content elements in your UI layout. Widgets are the control elements that the user can interact with. Each widget stores a value that the user has entered, whether by typing into a box, moving a slider, or checking a button. When the user changes their input, the stored value automatically changes as well.

Like other content elements, widgets are created by calling an appropriate function. For example:
textInput()creates a box in which the user can enter textsliderInput()creates a sliderselectInput()creates a dropdown menu the user can choose fromcheckboxInput()creates a box the user can check (usingcheckboxGroupInput()to group them)radioButtons()creates “radio” buttons (which the user can select only one of at a time)
See the documentation, and this tutorial lesson for a complete list.
All functions that create widgets take at least two arguments:
- A name (a string) for the widget’s value. This is how the
server will be able to access the stored value, such as the text box
content or the slider position–the “name” is the key that
identifies the widgets, so that the server can be sure it is reading
text input and not the slider position.
key that allows the server to access the value the user has input (think: the key in the
inputlist). - A label (a string). This will be shown alongside the widget and
tells
the user what the value represents. Note that this can be an empty
string (
"") if you don’t want to show any label.
min
and max values.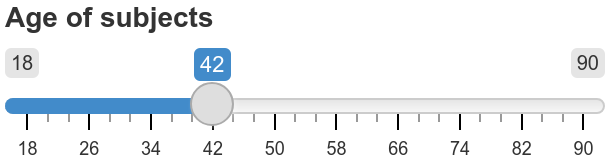
Example of slider input
For instance, if you create a slider for age, you may want to do it as follows (see the figure at right):
sliderInput(
  "age", # name
  "Age of subjects", # label
  min = 18, # minimum slider value
  max = 90, # maximum slider value
  value = 42 # starting value
)
This slider will only allow you to enter values between 18 and 90, and it will be identified by its name “age” by the server.
All widgets are used to provide inputs to the Server; see the section E.3 below for how to use these inputs, as well as examples from the gallery.
E.2.4 Reactive outputs
When you create a traditional static web page, then you can include both text and images to it. However, both of these are static, i.e. once created, the user cannot change those at will. Dynamic apps, like those created by shiny, include dynamic elements to the page, the elements that will change as a result of user input (such as entering text or sliding a slider).
Sync dynamic elements are created by the server on the go (most likely after reading some user inputs), and these can be included to the UI in their own special way. Superficially, they are similar UI elements like inputs–they can be included in the page next to each other, they can be combined with inputs, and so on.
Reactive outputs can be created by calling the appropriate function, in a similar fashion as the inputs. For instance,
textOutput()displays output as plain text. This is good for displaying some calculated numbers or other summaries.tableOutput()displays output as a data table (similar tokable()in R Markdown). See alsodataTableOutput()for an interactive version!plotOutput()displays a graphical plot, such as one created withggplot2orplot().
Each of these functions takes as an argument the name (string) of the value that will be displayed. This is the “key” that makes the UI able to distinguish which element to display where, exactly as in the case of reactive inputs. Note that the functions may take additional arguments as well (e.g., to specify the size of a plot); see the documentation for details.
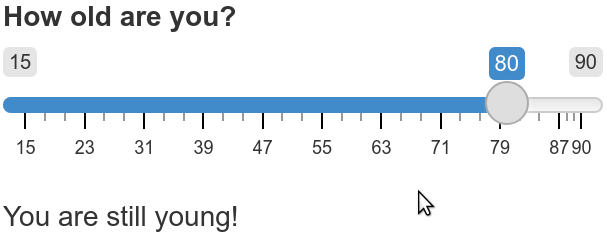
Two UI elements: sliderInput (above), and textOutput (below).
For instance, here is a tiny example of combining a reactive input and reactive output element vertically.
ui <- fluidPage(
  sliderInput(
    "age",
    "How old are you?",
    min = 15,
    max = 90,
    value = 20
  ),
  textOutput("response")
)
The first element, sliderInput
is on top (and has label “How old are you?”), the textOutput element
is just underneath it and shows a message “You are still young!”. Note
that the message is not written anywhere in the UI, instead, it is
generated by the server.
E.3 The Server
The main task of the server is to read user inputs, and provide the
appropriate outputs to be viewed by the user. For instance, it may
provide age-dependent greeting messages, or perhaps more importantly,
re-draw the map as the user is dragging an zooming on the image.
Server is the part of your code that connects the inputs and outputs,
for instance in the age example above, the server reads the slider
named "age", and renders the appropriate message in textOutput
names "response".
For any substantial app, this usually also involves a fair amount of data processing, and hence the server code tends to grow much faster than the ui code.
E.3.1 How to create the server
Server can be created by defining a new function called server as
Note that this is just a normal function that happens two take two lists as arguments. That means you can include the same kinds of code as you normally would—though that code will only be run once (when the application is first started) unless defined as part of a reactive expression (see below).
The arguments must be named input and output. If you call the argument something else, you may see an uninformative error
Warning: Error in server: unused argument (output = list(<environment>, function (x)
x))
  1: runApp
Error in server(...) :
  unused argument (output = list(<environment>, function (x)
x))
The first argument, input is a list of any values defined by the
control widgets: each name in a control widget will be a named
component of this list. For example, using the sliderInput()
examples above we use "age" as its inputId. This causes the list to
have a component called age that you can access as input$age (or
input[["age"]]). If you drag the slider to show number “80”, the
value of input$age will be 80.
This allows the Server to access any data that the user has entered,
using the inputId-s defined in the UI. But most importantly,
values in this list will change as the user interacts with the
UI’s control widgets.
This was about reading inputs. But the main purpose of the server
function is to create appropriate outputs, based on the inputs.
Server does it by assigning values to the output argument, using
the appropriate component names (that correspond to the outputId in
the respective UI elements).
These values will then be displayed by the reactive outputs defined
in the UI. To make it so that the values can actually be displayed by
by the UI, the values assigned to this list need to be the results of
Render Functions. Similar to creating widgets or reactive outputs,
different functions are associated with different types of output the
server should produce.45
For example:
renderText()will produce text (character strings) that can be displayed (i.e., bytextOutput()in the UI)renderTable()will produce a table that can be displayed (i.e., bytableOutput()in the UI)renderPlot()will produce a graphical plot that can be displayed (i.e., byplotOutput()in the UI)
Render functions take as an a block of code (in braces {})
that returns the value which should be rendered. For example:
output$greeting <- renderText({
   ## You can write ordinary code here
   greeting <- "Hello"
   ## Include user's name through input:
   paste(greeting, input$username)
})
This code combines the strings “Hello” and a name that the user
entered (e.g. “Zhu”) into “Hello Zhu”. Thereafter it renders it
into a form, suitable for displaying on the webpage. The rendered
text will have name “greeting” in the output list.
It is UI’s task
to place the rendered message on an appropriate location on the page,
using textOutput("greeting").
Two UI elements: sliderInput (above), and textOutput (below).
Here is a different example, the server code for the input slider example from Section E.2.4:
server <- function(input, output) {
  output$response <- renderText({
    if(input$age < 90) {
      "You are still young!"
    } else {
      "You are grown up by now!"
    }
  })
}
This code does not include the age in years directly in the response,
instead, if checks the age value and responds with an appropriate
message. Note that the message is rendered as output component named
response, hence it must be displayed by thu UI as
textOutput("response").
The reactive expression are written in a fairly similar fashion as
ordinary code. In fact, they are blocks of ordinary code, just not
written as separate functions but as arguments of renderText() and
other render functions. That is why you need to encapsulate those in
braces like
This technically defines a closure, which is a programming concept used to encapsulate functions and the context for those functions.
These reactive expressions will be re-run every time one of the
input values that it references changes. So if the user drags the
“age” slider (and thereby changes the value of the input$age),
the expression in the above renderText() will be executed again,
returning a new value that will be assigned to output$response. And
since output$response
has now changed, any reactive output in the UI (e.g., a
textOutput()) will update to show the latest value.
This is what makes the app interactive!
E.3.2 Dependencies and reactive variables
It is quite common in a Shiny app to produce lots of output variables, and thus to have multiple reactive expressions. And quite often, you may want to specify which widget changes what feature.
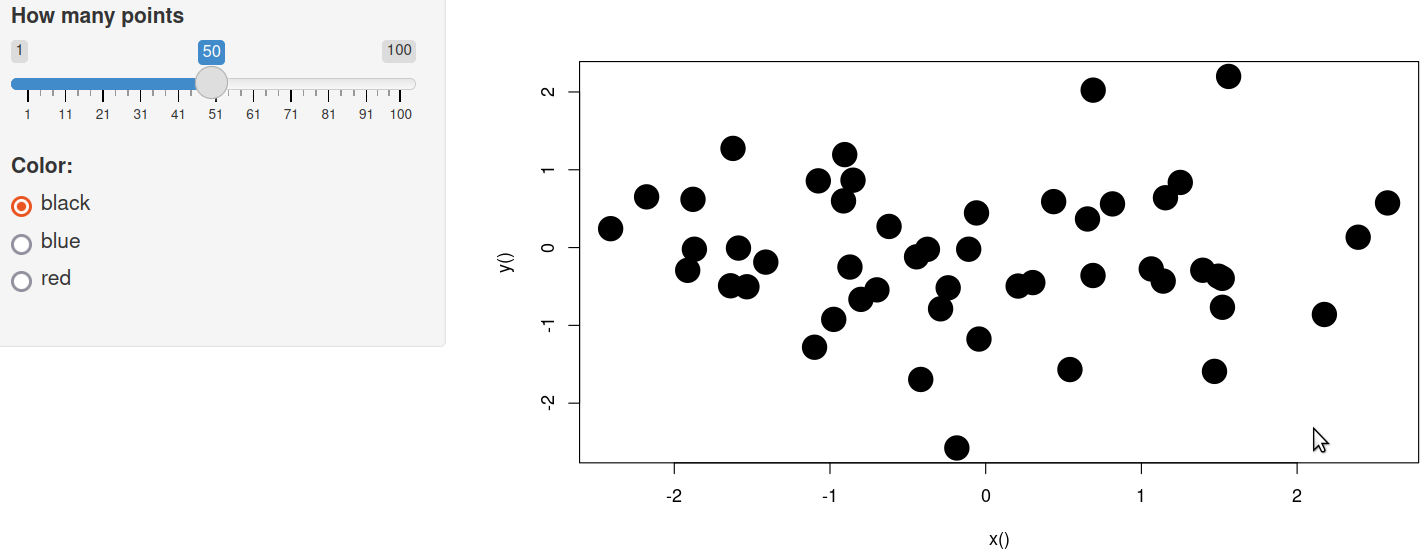
E.3.2.1 Different widgets change different aspects of plot
Consider the following task: you want to plot random dots, and you want to change the number, and the color of the dots. Hence your UI should contain (at least) three elements: input for the number of dots (we use n below), input for the dot color (we use color below), and an area where you can output the results.
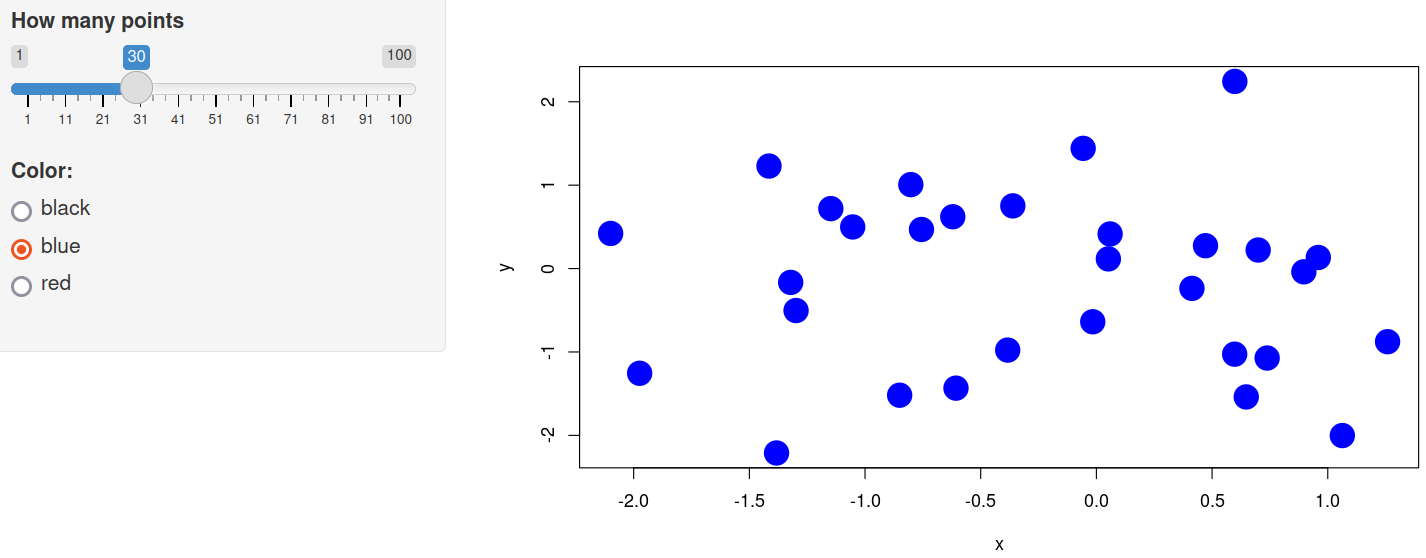
Example of how the app might look like with 30 points, rendered in blue.
You can write the server code as
## inputs:
## n: how many points
## color: the desired color
server <- function(input, output) {
  output$points <- renderPlot({
    x <- rnorm(input$n)
    y <- rnorm(input$n)
    plot(x, y, pch=19, col=input$color)
  })
}
So the user can change both n (e.g., by using a slider), and color (e.g. by using radio buttons). The server makes a plot with the corresponding number of dots in the desired color.
This code works well (given you have designed a suitable UI).
However, it has an undesirable property: when you change the color,
then the dots also change. It is easy to see why–as soon as you
change color, the server will re-run the renderPlot() function.
This will change the color, but it will also create new random points
(and they will be different, because they are, well, random).
The problem here boils down to shared variables–here x and
y–that should react to the user input when the user changes n,
but should not react to it, when the user just changes the color.
However, in the way we implemented it, x and y will also change if
the user changes color only. This is a problem we cannot easily
solve without additional tools: if we create x and y outside of the
renderPlot(), then they do not change when n changes.
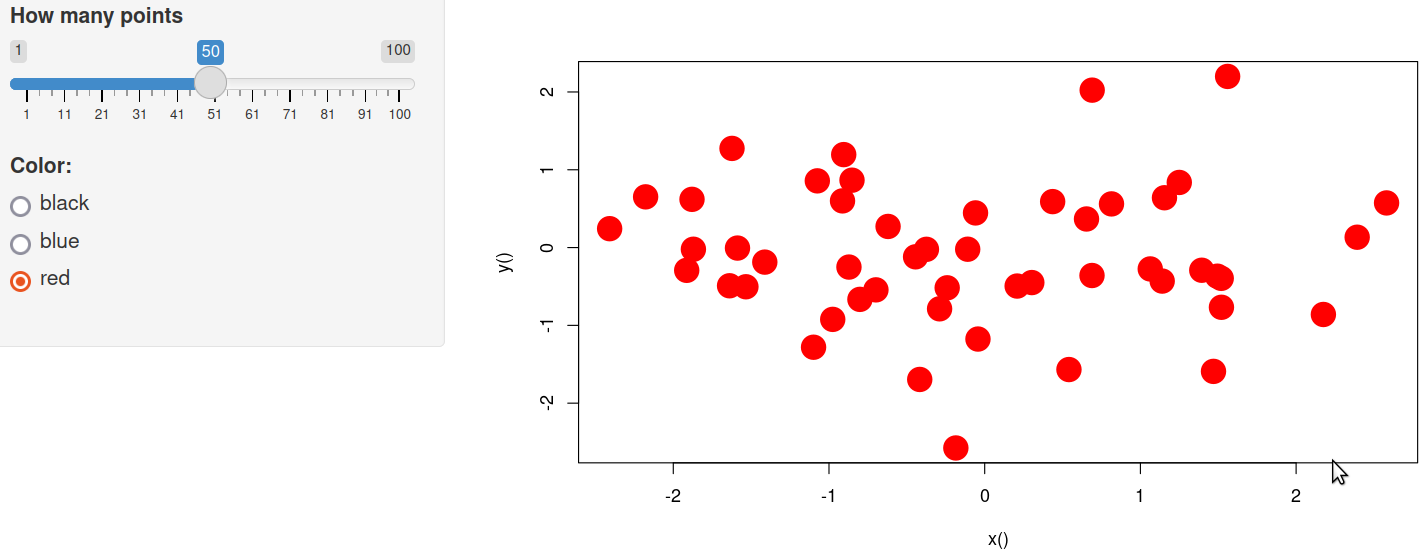
When defining x and y as reactive functions, one can change color without changing the dots themselves.
The solution is to define x and y as reactive functions using
reactive():
server <- function(input, output) {
   x <- reactive({
      rnorm(input$n)
   })
   y <- reactive({
      rnorm(input$n)
   })
   output$points <- renderPlot({
      plot(x(), y(), pch=19, col=input$color,
           cex=3)
   })
}
There are three main differences:
- We
begin by defining not variables x and y, but reactive
functions x and y. These are created as code blocks inside
function
reactive(). - We define these functions outside of the
renderPlot()function. - We refer to those (inside
plot()) as functions x() and y(), not as x and y.
Now shiny will update x and y only if n changes: it will scan
the corresponding code, and see that both of these variables depend
only on n and not on color. It will also see that output$points
depends on x and y, and hence the plot must be redone as soon as
n changes.
E.3.2.2 Different views of data
Another common task is to “view” the same data in different ways.
This may include multiple plots, tables, summary values and more of
the same dataset. All these “views” should be computed and rendered
as separate ui elements using a separate renderPlot(),
renderTable() and similar functions.
Obviously, if we change data, all these values
should change. As long as adjusting data is simple, such as a single
filter, we can do this in all these functions separately. But as the
data processing grows more complex, it gets more and more complicated
to include a dedicated data processing code in each of these. It is
much more useful to define data as a reactive function that reacts to
the data processing widgets.
Let us demonstrate this with orange tree data where the user can choose which trees to display. The UI code might look like
ui <- fluidPage(
   sidebarLayout(
      sidebarPanel(
         checkboxGroupInput(
            "trees", "Select trees",
            choices = 1:5,  # tree id-s
            selected = 1:5  # initially, display all trees
         )
      ),
      mainPanel(
         plotOutput("plot"),  # plot above
         textOutput("max")  # max size underneath
      )
   )
)
So we create a sidebar with checkboxGroupInput(), allowing the user
to select individual trees–which ones to include in data. We include
two “views”–a plot and a textual summary, here the max size in data;
these must be created by renderPlot() and renderText().
Obviously, if different trees are selected, then both the plot and the
max size may change.
The naive way of achieving this is simply by adding the filter to both plot and text:
server <- function(input, output) {
   output$plot <- renderPlot({
      orange %>%
         filter(tree %in% input$trees) %>%  # filter only desired trees
         ggplot(aes(age, circumference, col=tree)) +
         geom_line()
   })
   output$max <- renderText({
      orange %>%
         filter(tree %in% input$trees) %>%  # filter only desired trees
         pull(circumference) %>%
         max() %>%
         paste("The max size is", .)
   })
}
This code works as intended. However, we replicate the same piece of
code, filter(tree %in% input$trees) in two places. While for this
simple task it may be the easiest way, it will be a big source of
problems as our app and data processing gets more complicated. Any
change in processing code must be replicated in a number of places,
and if you forget or do it differently, then the app may not work, or
results will not be
reliable any more.
A solution is, again, to make data reactive–define data as a function
that depends on input$trees. And thereafter we can use the reactive
function in both renderPlot() and renderText():
server <- function(input, output) {
   orange <- reactive({
      orangeData %>%
         filter(tree %in% input$trees)
   })
   output$plot <- renderPlot({
      orange() %>%
         ggplot(aes(age, circumference, col=tree)) +
         geom_line()
   })
   output$max <- renderText({
      orange() %>%
         pull(circumference) %>%
         max() %>%
         paste("The max size is", .)
   })
}orangeData, the
reactive function orange() is responsible for all filtering and
potentially all sort of other data processing. The final app may look
like:
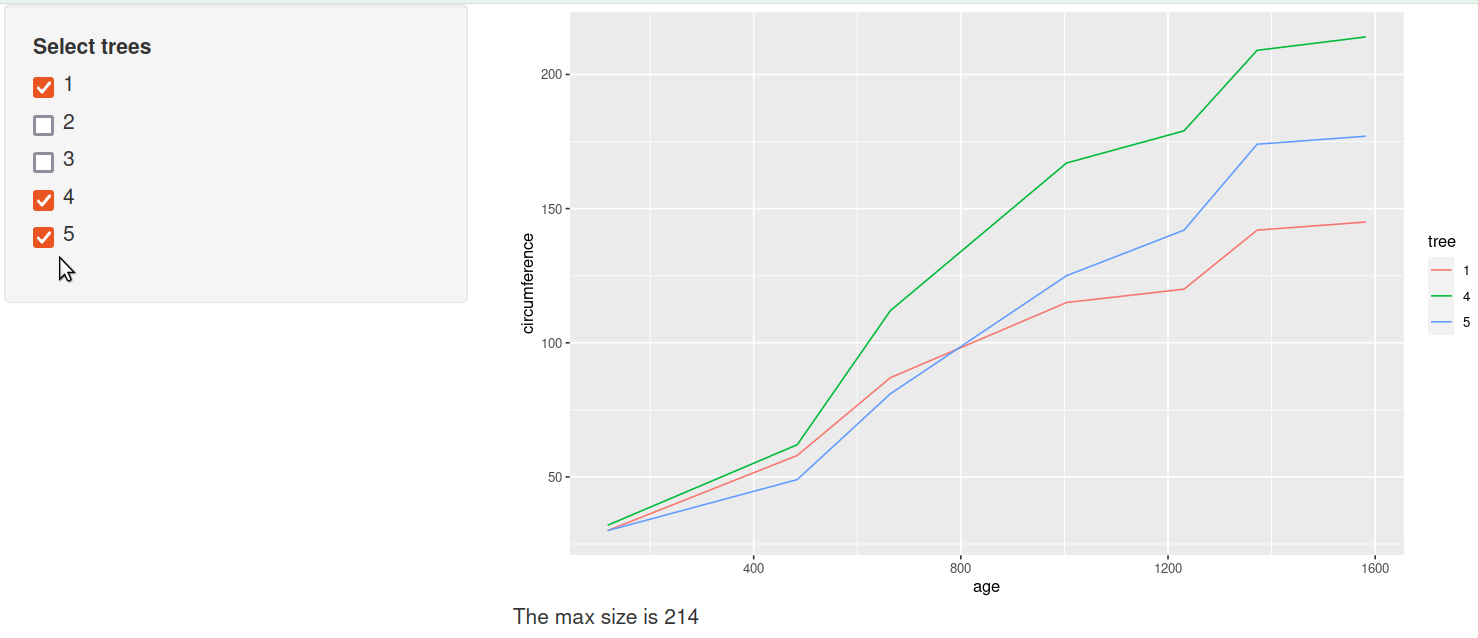
The app displays two “views” of the same data: a plot, and the max value. Both these values need similar data processing, here filtering the desired trees. This is best to be achieved using reactive functions.
Such usage of reactive functions allows you to clean and organize your code better, and most importantly–change and maintain it while making fewer bugs.
E.4 Publishing Shiny Apps
Sharing a Shiny App with the world is a bit more involved than simply pushing the code to GitHub. You can’t just use GitHub pages to host the code because you need the backend–an R interpreter session to do all the plotting and data processing, and to run the Server that the UI can connect to. Simple web hosting options, including Github pages, do not allow you to run such backend processes.
E.4.1 Setting up your account
While you can run shiny apps on every website that allows you to run backend services, in this course you’ll use the simplest one: hosting through shinyapps.io. That website has all the tools for the apps already set up. While large applications cost money, anyone can deploy a simple app (like the ones you’ll create in this course) for free.
In order to host your app on shinyapps.io, you’ll need to create a free account. Note that you can sign up with GitHub or your Google/UW account, if you choose to go this way then you do not have to create any other accounts. Follow the site’s instructions to
Select an account name, or connect with Github/google
Install the required
rsconnectpackage (may be included with RStudio)Set your authorization token (“password”). You need to tell your local R session what this token is. If you select “View” the token, it will open a small window with a few lines of R code. Just click the green “Copy to Clipboard” button, and then paste the code into the Console in RStudio. The code should look something like
It will store the token, so you should only need to do this once.
After you’ve set up an account you can publish it with the Publish button in the upper-right corner:46

If all goes well, then you see a number of uploading messages, ending with
Application successfully deployed to https://…
This may take a few minutes. So your app will now be online, and will be available at
https://USERNAME.shinyapps.io/APPNAME/E.4.2 Make sure your app is good to be published
Publishing to shinyapps.io is one of the major pain points for beginners when working with Shiny. The main reason for this is that when published, the app will be running on a different computer (on a cloud server), and it has no access to your computer any more. So only these files and data that are uploaded to the server will be available. Also, the cloud server will not have the same file and folder structure that your computer has!
Here are a few guidelines to help you with publishing:
Always test and debug your app locally (e.g., on your own computer, by running the App through RStudio). Make sure it works on your machine before you try to put it online. While it is possible to debug the app online, it is much more time consuming.
When publishing your app, only the content of the app folder will be uploaded. If you refer to data or code that is outside of the app folder, it will be not uploaded and hence the server has no access to that. It will crash.
The shinyapps.io cloud server does not use the same file system as you use. Hence you should use relative paths, and only relative paths. Make sure any
.csvor.Rfiles referenced are inside the app folder (usually named after the project), and that you refer to any data and code file by relative paths.If you use absolute path, e.g.
"C:/users/otoomet/info201/app"the app will not work–the server has no folder like"C:/users/..."and hence your app will crash.Do not include any statements in your code that do not work outside of your computer. This includes
setwd()(because the server will have it’s own directories),install.packages()(because the server will install the packages automatically), andView()(because that only works in RStudio).If your app crashes (the website turns gray), then it is possible to consult the logs for your deployed app, which may include errors explaining any problems that arise when you deploy your app. These are the same messages that are printed on RStudio console when you run your app locally, so you may want to add
print()orcat()statements in your code to see what is going on.
For more options and details, see the shinyapps.io documentation.
E.5 Data-dependent input widgest
E.5.1 Creating data-dependent widgets
A common task is to let the users to choose the type of objects or the date range to be displayed. You can imagine adding checkboxes or slider that allow you to select the types and ranges. For instance, in Section E.3.2.2 above, we allowed the users to select certain trees only with
This allows the user to pick any combination of trees based on their id-s (“1” to “5”).
But this approach has a problem–how do we know what are the possible
tree id, the available date range, or any other feature we want the
user to be able to select? Obviously, we should calculate this from
data by, e.g. finding all unique tree id-s.
But now we run into another problem: UI cannot compute on data. UI
functions, such as checkboxGroupInput() just create certain UI
elements on the webpage, and these will not change with data.
Hence we need a slightly different approach.
This is where uiOutput() and renderUI() come to play. In a
similar fashion as data-dependent plot and data-dependent text, server
can render an UI element with renderUI() and UI can display it with
uiOutput(). So renderUI() will create a data-dependent component
in the output list with a given id, and renderUI() will render it
in the UI.
Here is how we can modify our tree-plotting function accordingly. The UI will be
ui <- fluidPage(
   sidebarLayout(
      sidebarPanel(
         uiOutput("checkboxes")  # output the checkboxes
                           # now dependent on data
      ),
      mainPanel(
         ...
      )))
And server will contain:
server <- function(input, output) {
   orangeData <-
      read_delim("~/tyyq/teaching/data/nature/orange-trees.csv") %>%
      mutate(tree = factor(Tree))
   ids <- unique(orangeData$tree)
                           # what are the possible ids?
   ## Create the checkboxes with 'renderUI' here:
   output$checkboxes <- renderUI({
      checkboxGroupInput(
         "trees", "Select trees",
         choices = ids,
         selected = ids  # initially, display all trees
      )
   })
Now the output$checkboxes will be an input widget, a similar
checkbox list like above. But this time the id-s are computed from
data, so if data changes, it will adjust the id-s of the trees in the
checklist. But server just creates a small webpage snippet, it still
must be rendered on the app page, this is done by
uiOutput("checkboxes") in the ui function.
E.5.2 How to fix uninitialized data
When you render your UI elements based on data, you may run into a chicken-and-egg problem where the UI cannot be initialized without certain other data elements being initialized, but those are, in turn, dependent on the uninitialized UI element. You may see some quick error message before the output appears, or sometimes the issues persist until you start playing with the inputs. In those cases, you should include some kind of explicit code that tests if the values are initialized, and does something of meaningful if they are not. Such tests are usually easy, as the server contains just plain ordinary R code.
First, let’s do a simpler example with the orange tree data from above. What happens to our orange tree app when the user unselects all trees?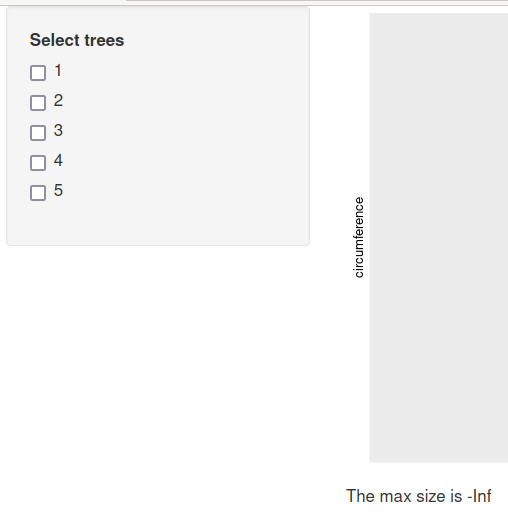
If the user unselects all trees, the max size will be -Inf. This
may not be desireable.
Without any trees selected, the plot will just be an empty gray
rectange. This looks reasonab–after all, what else should the app
show if it does not to show anything? But the max size does not look
good. Instead of the message of The max size is -Inf one might
expect something else, e.g. Max size is undefined, or maybe no
message at all.
The solution though is easy–instead of just printing the max value,
we need an if/else block that computes the max if it is available, and
outputs something else useful if it cannot compute max. For instance,
we can re-do the renderText() as:
Note that inside of the renderText() function, we just use ordinary
code. Code checks if the max is finite and outputs a suitable
sentence if this is the case. Otherwise, it does something else
meaningful, here it just outputs and empty string, i.e. if nothing is
selected, we do not see anything there.
You can use analogous approach in other cases too. If uncertain how do the uninitialized value look like, you can just print them in the server code (see Section E.6.2 below). Here is an example using diamonds data:
library(shiny)
library(plotly)
library(tidyverse)

ui <- fluidPage(
   sidebarLayout(
      sidebarPanel(
         uiOutput("checkboxes"),
         sliderInput("n", "How many diamonds",
                     1, 2000, 100)
      ),
      mainPanel(
         plotlyOutput("plot")
      )
   )
)

server <- function(input, output) {
   diamonds <-
      read_delim("~/tyyq/teaching/data/economics/diamonds.csv.bz2")
   cuts <- unique(diamonds$cut)
                           # what are the possible ids?
   output$checkboxes <- renderUI({
      checkboxGroupInput(
         "cuts", "Which cut types",
         choices = cuts,
         selected = cuts
      )
   })
   sample <- reactive({
      diamonds %>%
         filter(cut %in% input$cuts) %>%
         sample_n(input$n)
   })
   output$plot <- renderPlotly({
      plot_ly(data = sample(),
              x = ~carat, y = ~price, color = ~cut,
              marker = list(size = 10),
              type = "scatter")
   })
}

shinyApp(ui = ui, server = server)
E.6 Troubleshooting
We started this course writing code on RStudio console, thereafter in the code window, and later in the rmarkdown code chunks. Now we write code that runs in a shiny app. At each step, debugging your code is getting more and more complex as the running environment is more and more removed from the user. But this is not the worst case yet, you can imagine that it will run on a restricted access server in a docker container somewhere in the cloud. Fortunately, there are still many good debugging strategies.
E.6.1 Reload the page
One of the great things when debugging shiny apps is that you do not have to stop and restart the apps. You can normally just
- fix the issue (or add printing commands into your code)
- save your file
- refresh the browser window that displays the app. This forces the shiny web server (not your server, but the built-in webserver) to restart you app.
This is normally enough to restart the app, and (with certain luck) to get it working.
This tends to work better if you open the app in browser, not just in RStudio browser. Also, you need to keep the app running, not stop it with the stop button.
E.6.2 Print the values
One of the most generic debugging strategy is to print the values. This gives you an idea what are the values and if they are reasonable. This also tells you when the code reaches in the given point, to the point where your code has the print statement.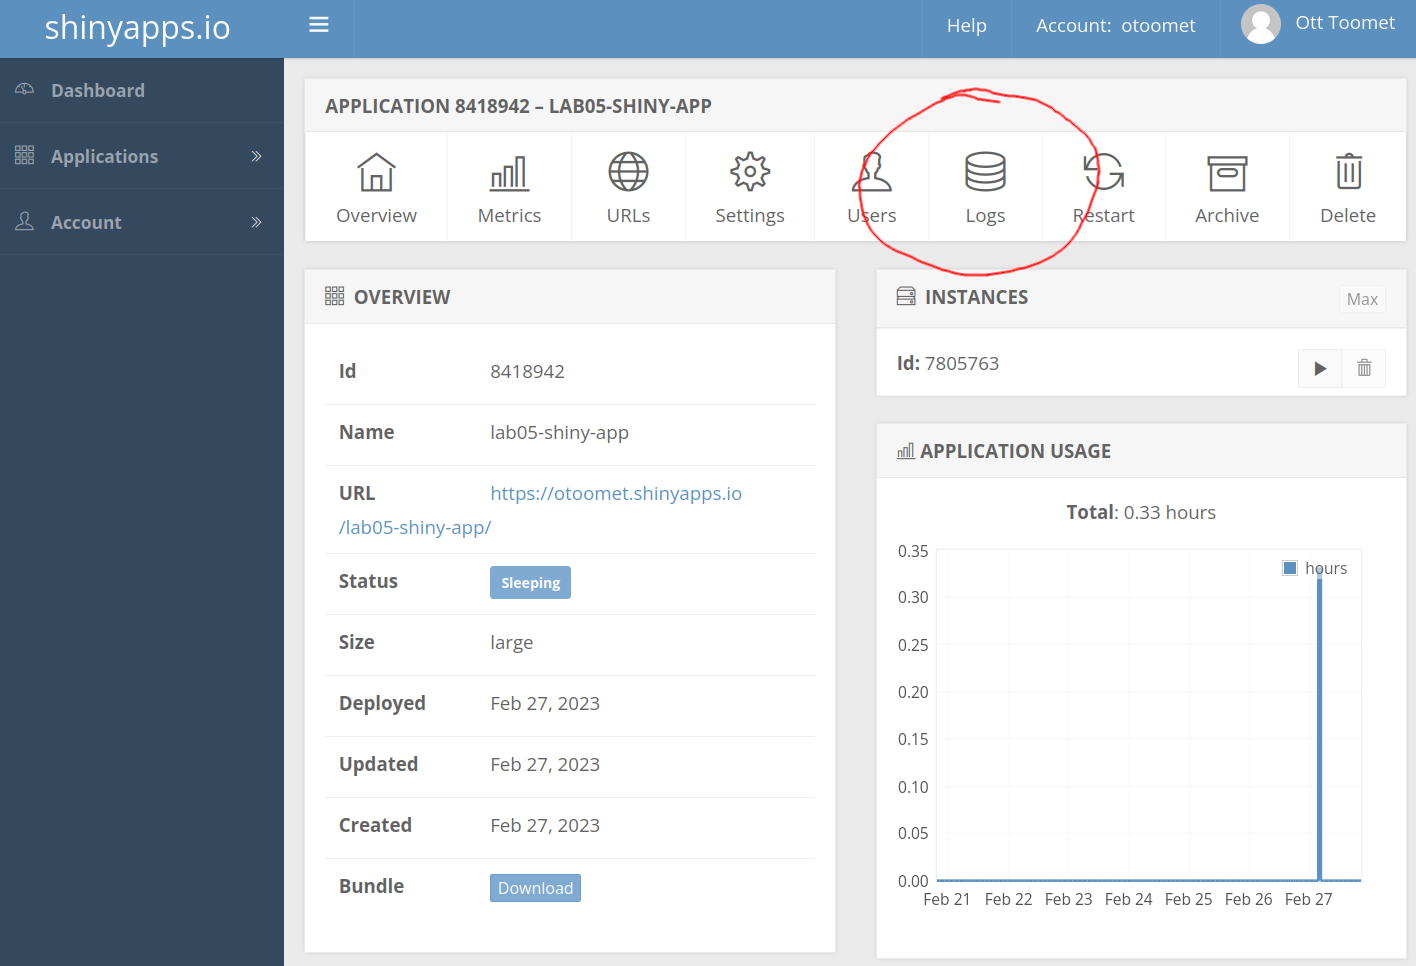
How to view shinyapps.io logs.
If you run the app locally, you will see these messages in the RStudio console, if you publish it on shinyapps.io, then they will be visible in the log files. You can see the logs by just clicking on the app in your dashboard on shinyapps.io, and selecting the “Logs” icon (see the image).
It is important to realize that you can insert print statements pretty much anywhere in the server–after all, the server function mostly contains just plain code. You cannot, however, insert print statements into UI because that is not plain code, just function arguments. And adding print statements into function arguments is tricky.
It is actually pretty straightforward to insert print
statements inside function arguments, including in the UI elements.
This is because all R expressions just evaluate to the value of the
last statement, and you can combine multiple statements into one using
curly braces {..}. So you can write, for instance
Here mainPanel() contains, as the argument, an expression that
evaluates to textOutput("response"), but before it gets there, it
also prints the message.
server <- function(input, output) {
   cat("starting server\n")
   output$response <- renderText({
      cat("age is", input$age, "\n")
      if(input$age < 90) {
         msg <- "You are still young!"
      } else {
         msg <- "You are grown up by now!"
      }
      cat("Greeting is:", msg, "\n")
      msg
   })
}
The example same server code as in Section E.3.1, but this time it contains informative print statements.
Here is an example, using the server code for the age-dependent
greeting we did in Section E.3.1 above. We can
insert a few cat() commands in it as:
Now each time the server starts (this happens when your app starts),
it prints "starting server". Each time the user moves the age input
slider, it prints "age is ..." and also the greeting. Note that
these messages appear on RStudio console (or in shinyapps.io logs),
not on the app window!
In this example, one might see messages
> runApp(info201/app)

Listening on http://127.0.0.1:5728
starting server
age is 20
Greeting is: You are still young!
age is 41
Greeting is: You are still young!
It is important to realize that app runs a different R instance. So when you start the app, shiny starts a separate R program that runs in the background. It is still connected to RStudio console in the sense that you can see its output there. But it is not the same R program that you can access on the console! The R you used in your console started the new app, and now it is just sitting and waiting, and displaying output from the app.
Most importantly, these two R instances will have different working directories–the app has working directory that is the app folder. Moreover, app cannot see the workspace variables you defined in RStudio console (possibly by running the code). In a similar manner, RStudio console cannot see the variables that the app defines. This may be somewhat confusing, as both are apparently running inside RStudio, and show the output in the same window.
E.6.3 Common errors
Shiny error messages may be confusing. Sometimes they appear in
RStudio console, sometime in the app window, and sometimes not at
all. Also, the message text itself may be less than helpful: what
exactly is Error: [object Object] supposed to mean? As a
generic strategy, it is always useful to print values (see Section
E.6.2) to understand the errors on the
server side. But sometimes the error message itself gives good hints
about what went wrong. Also, if the error appears on shinyapps.io
then know how to view the logs! (See section
E.6.2.)
Here we walk through a few common mistakes.
E.6.3.1 UI-side or server-side error?
Server-side errors usually mean that the UI runs: the elements are there (although sometimes not rendered), but there may be error messages in some of the elemets. Red error messages, either on your shiny window or console are easy to spot, it may be hard to realize that the UI elements–white boxes on white background–are there.
UI-side errors may be worse, your app may not run at all, and the UI elements may be missing. For instance, this simple UI
will just report
An error has occured!
Error sourcing app.R
The UI-elements are clearly missing, and replaced by the error message. But read the message at RStudio console:
Possible missing comma at:
6:   sidebarLayout(
     ^
This tells you fairly directly that there must be a comma between
textOutput("welcome") and sidebarLayout().
E.6.3.2 Argument 1 cannot be handled by ‘cat’
Consider the simple renderText() function to compute the
number of lines in diamonds data, and render it as text:
Error: argument 1 (type ‘list’) cannot be handled by ‘cat’
What is wrong here? The problem is following: the renderText()
turns the values into text by using the cat() function. But
remember–summarize does not produce a single number but a data frame!
(see Section 13.3.5). And that is what cat
cannot handle–if you try this outside shiny, you’ll get the same error:
## Error in cat(.): argument 1 (type 'list') cannot be handled by 'cat'There are a few solutions, the most useful here is to pull() out the
variable of interest and convert that one:
## [1] 53940See more in Section 13.6.2.3.
E.6.3.3 Visual element missing or empty
Consider a simple code to output text:
When you render it in this way, the corresponding textOutput("msg")
will be empty but you do not see any error. Why?
The problem is the cat() after msg. While the message is created,
it is not returned. What is returned instead is the return value of
cat(), and cat() returns NULL. Hence the renderText does not
render the message but and empty value.
You should change it to
in case you need the cat(), or just to
if cat() is not needed.
E.6.4 Input/output
Shiny apps have access to all your computer files in a similar fashion as other R programs. Just be aware that the app has working directory that is the app directory, and it may differ from the working directory in the RStudio console (see Section E.6.2). However, this is only true as long as the app runs in your computer! As soon as you upload your app on shinyapps.io, it has no access to your computer any more!
So it is important to upload all files you need to shinyapps.io. For this to work you need:
- include all your code and data files in the app folder. You can also make subfolders inside the app folder, e.g. “data” for the datasets.
- ensure that you use correct relative path to access the files (see Section E.4.2).
- the exception is images that you want to use in UI as static webpage elements (see Section E.2.2. The working directory of UI images is folder “www” inside the app folder, so you need to put the images in “www” and use the path that does not contain the “www/” prefix.
Shiny apps are not really designed for output anything besides what is visible on the screen.
E.7 More interactivity with plotly
Plotly is an interactive plotting framework (see Section
A). Plotly graphs can be injected into shiny using
renderPlotly() and plotlyOutput() for the server and UI side of
the app respectively.
Resources
- Shiny Documentation
- Shiny Basics Article
- Shiny Tutorial (video; links to text at bottom)
- Shiny Example Gallery
- shinyapps.io User Guide
- Interactive Plots with Shiny (see also here)
- Interactive Docs with Shiny
From the technical perspective, the
render...()functions take the text or image, and transform those into a suitable format to be displayed on a HTML page. For text it is text, for images, it is a png image, and for interactive images, it will be a javascript code. The corresponding...Output()UI functions, in turn, fit the rendered HTML on the page.↩︎Alternatively, you can publish the app with
rsconnect::deployApp("path/to/app/"), wherepath/to/appis the relative path to the app folder.↩︎