Chapter 9 How to write code: Some general programming skills
So far we were discussing the particular coding skills, such as variables, functions and vectors. But there is a set of extremely important skills that are not tied to any particular tool or any programming language. This includes splitting complex tasks into smaller manageable subtasks, learning new tools, solving the problems in code (debugging), and writing code in a way to avoid errors.
Everyone who writes code runs into problems. Quite often you just don’t know how certain functions or libraries work. Other times you may not know if what you came up with is a good way to solve the problem–or may you cannot figure out how to even solve the problem. Another time you have finished and everything works, but the results you get are just wrong. Problems happen to all of us and as a rule of thumb, expect each line of your code to contain one error. How should you fix them? And how to work in a way so that you avoid the problems in the first place?
Here we discuss these topics separately but often you need a combination of all of these:
- How to even think and apporach a complex task? You should follow the divide and conquer approach: split the task into smaller sub-tasks, all of which are easier to do.
- Read documentation and search the web. Many R packages are well documented (but many are not). This approach is often known as “RTFM” or “STFW”.
- Debugging. This is a generic term to find and correct errors in your code and there are many approaches to debugging. See more in Debugging.
- Ask for help. An experienced person may be able to solve your question in seconds so do not hesitate to ask for help. However, you should follow some rules when doing that. This will be discussed in How To Ask Questions.
- Write code in a way that causes fewer errors. There is no fool-proof ways to program, but there are ways that are less prone to errors. See more in Coding style.
9.1 Divide and conquer: how to think about a complex task
How to solve a complex problem? For instance, you need to convert individual cellular communication logs into time series of geographic activity by certain groups of cellphones. The logs contain information in the form
phone-id1  date     time    phone-id2  antenna-id
206123456  Oct 14   19:50   206654321  4093
706122475  Oct 14   19:50   206435126  2117
...phone-id-s are just the phone number, the caller and recipient, and antenna-id is the id of the cellular provider antenna. Here And what do you want to get is
date      location   group   activity
Oct 14th  Seattle    1       1000
Oct 14th  Seattle    2       2000
Oct 14th  Bellevue   1       600
Oct 14th  Bellevue   2       300
...
Oct 15th  Seattle    1       1500
Oct 15th  Seattle    2       1300
Oct 15th  Bellevue   1       333
Oct 15th  Bellevue   2       233
...
Here groups mean certain phone groups of interest, e.g. groups of friends or businesses, and activity is the number of calls made and texts sent by these groups. How would you address this problem? How would you begin and what else do you need to be able to complete the task?

How can you make paella like this? What kind of ingredients do you need, and how can you even begin? A recipe helps.
Perhaps the best way is to start by converting the complex and somewhat vague task into a list of smaller individual steps you need to take. This is similar to cooking recipes. For instance, how can you make the paella on the picture here? Do you even know how to begin? This may look overwhelming (unless you are an experienced paella-chef)–but a recipe helps. The recipe here consists of two parts, the list of ingredients and cooking instructions. The latter sounds like
- Heat olive oil on skillet
- Add onion, bell pepper and garlic
- Cook until onion is translucent
- Add chicken pieces
- …
What does the recipe achieve? The complex, unclear and hard-to-achieve task, make paella like this, is converted into a list of simple subtasks. These subtasks are achievable even for someone with only little cooking experience, and hence almost everyone can get the paella done!
For coding you need exactly the same approach–you need to convert the complex (and often unclear) task into simple actionable items. All these simple items should be doable using the tools you have. Again, this is similar to cooking–depending your skills and tools in the kitchen, you may want to adjust the recipe to a certain extent.
So coding and cooking in many ways similar. But there is a major difference though–when cooking, you are following someone else’s recipe. When coding, you have to come up with the recipe. How do you do it? You need two sets of skills: the first, and perhaps harder one, is how to split your final task into smaller subtasks. And another one–how to translate those subtasks into computer code. Obviously, this can almost always be done in many ways, and certain ways are easier to do, or more efficient to compute. An experienced programmer has a large set of tools that they know, and can take the tools into account when designing the task list. Just like an experienced chef can easily design and write recipes for many dishes with little need of experimentation. This is a skill that requires both knowing your low-level tools (the coding language and the libraries) and a lot of experience.
If the tasks are quite complex, then instead of sitting at the computer, it may be useful to first design the “recipe” on paper first. Writing on paper forces you to think more in general terms and not the exact lines of code you need. The exact lines will follow later, when the overall design is broadly in place.
For instance, how might we approach the phone data problem? Apparently, we need to count all calls by location (city), date, and phone group. A broad-term recipe might look like:
- Convert antenna-id-s to cities
- Convert phone-id-s to phone groups
- For each call you see in the log file, increase the count of calls in the corresponding date-city-group cell.
Obviously, when writing in such broad terms, we may want to convert each of the subtasks above into a similar recipe. Let’s do it:
- Convert antenna-id-s to cities
- for each call in the log file, look up the antenna-id in the antenna-city lookup table
- find the corresponding city
- replace the antenna-id by the city name in the log file
- Convert phone-id-s to phone groups
- for each phone-id1 in the log file, look it up in the phone-group lookup table
- find the corresponding group
- replace the phone-id1 by the group name in the log file.
- For each call you see in the log file, increase the count of calls
in the corresponding date-city-group cell.
- set all date-city-group counts to 0
- walk over all calls in the log file
- increase the count for the date-city-group for the call
But you may wonder why did we come up with exactly such task list? Can it be done differently? Can it be done better? The answer tends to be that it can (almost) always be done differently, and it can sometimes be done better. It is hard to say about this example, unless we know more about the task, such as in which format are the logs (files, databases, how large are these), what kind of computational resources we have access to, what other considerations are there…
This example above works, but it has multiple questionable choices. For instance, replacing antenna-id with city name may be quite misleading (see Section 9.5.1.5). Why should a column antenna-id suddenly be city? It may make more sense to add a new column to the table and label it city. On a different note, many coding framework will do the whole third task, counting, in 2-3 fairly standard lines of code (see Section 13.5), so there is little need to write it out in an elaborate way.
You need both knowledge of the tools and experience to come up with a good tasklist.
Exercise 9.1 Imagine you are a doctor, and the hospital you are working at has collected the following bits of data about five patients:
name <- c("Bao-chai", "Xiang-yun", "Bao-yu", "Xi-chun", "Dai-yu")
weight <- c(55, 56, 65, 62, 58)  # kg
Write the following recipes. Use normal language, not computer code!
- Display names of all patients who weigh at least 60 kg
- Display weights of all patients who weight at least 60kg
When done, write computer code for both of these tasks! (Hint: use indexing) How similar is your code to the recipes?
See the solution
9.2 Learning more
To be an expert programmer invariably means you frequently have to learn more. It is impossible to know “all relevant” coding skills. There are simply too many languages, libraries and frameworks, and the tools are evolving all the time. You have to be open for learning more, there is just no other way.
The sources where you learn more fall into four broad categories:
- Books and video courses are the best source for more in-depth concepts and understanding. Note that neither google nor online documentation are good substitutes here. Google can give you examples of for loops or functions, and documentation explains what is the exact syntax. But if you do not know what is function, then you do not even know what to look for.
- ChatGPT and similar tools may be of certain help, by writing what essentially amounts to custom textbook pages. These are helpful in many contexts, but they are not a substitute for understanding of the tools and main concepts.
- Documentation, whether built-in or online, is a good source to look up the exact syntax of various functions or other language constructs. This, however, assumes you know which functions or keywords to search, and you also have to understand what is written there. The latter is usually not a problem for experts, but programming documentation is typically not written with beginners in mind. In this course we expect you to read the docs and at least attempt to understand those.
- Finally, google is typically great to find examples close to what
you are looking for. But there are a few caveats:
- These examples may assume something about your computer or task that you do not understand. (This is extremely important regarding security configuration.)
- The examples may refer to a different version of software
- You need to know what to search, and which example, out of many, to adapt.
- Broadly the same applies to AI-tools as well: chatGPT can write you code, but without understanding what is written there, you risk of messing things up.
Without good enough background, there is little choice but to start with books and courses. These are also the best sources for other in-depth knowledge, for instance if you want to learn about object-oriented programming. Afterward, your focus will move to tutorials, documentation, and google.
Exercise 9.2 Consider the task: you need to enter a number of dates to computer. The dates in question are Oct 16th, 2023; Nov 12th, 2023; and July 3, 2014. You need to compute the time difference between these three dates. How would you approach the problem? Are there good functions or libraries to use? Do you have enough general basic skills to be able to understand it?
Try to figure it out and compute the time differences!
See the solution
9.2.1 Read the docs
R has a reasonably good built-in documentation.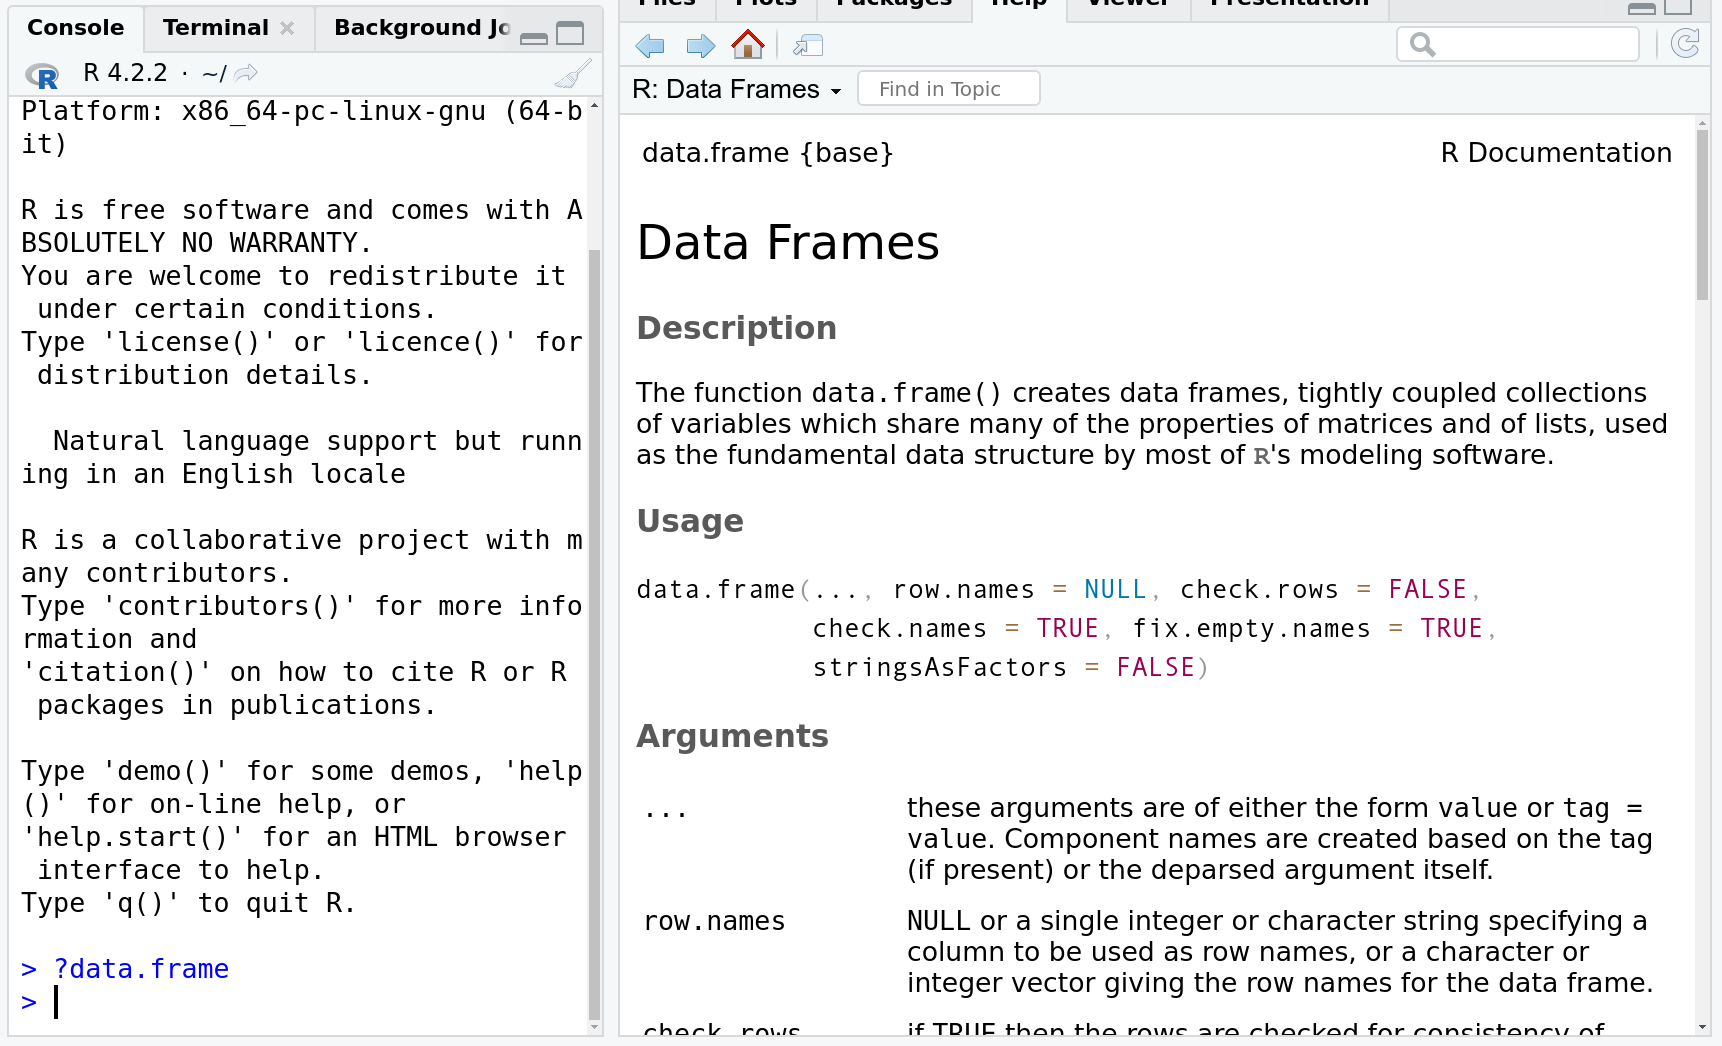
?<function> at the prompt opens a help
window in the bottom-right pane, that displays the basics of the
function, here data.frame.
It can be accessed
from the R command prompt by ?<command>, for instance
will result in a basic description about how to use the data.frame
function. This includes explanation of its arguments, a few usage
examples, and a list of “see also” suggestions. This is good if you
know the functions and want a quick reminder of its exact syntax.
A closely related command, ??<keyword> will search for the keyword
in all installed packages, and return a list of whatever relevant help
pages it finds. For instance,
will produce a long list of matches, including the dplyr::select.
This is useful if you do not know the exact function but you have an
idea how to describe the task you want to perform.
The third built-in help functionality is vignettes. Vignettes are more in-depth help documents. While the basic documentation may be sparse and is targeting users who know the basic functionality of both the functions and packages, then vignettes often cover the topics that are needed to get started with the particular packages. One can get a list of vignettes for all installed packages with
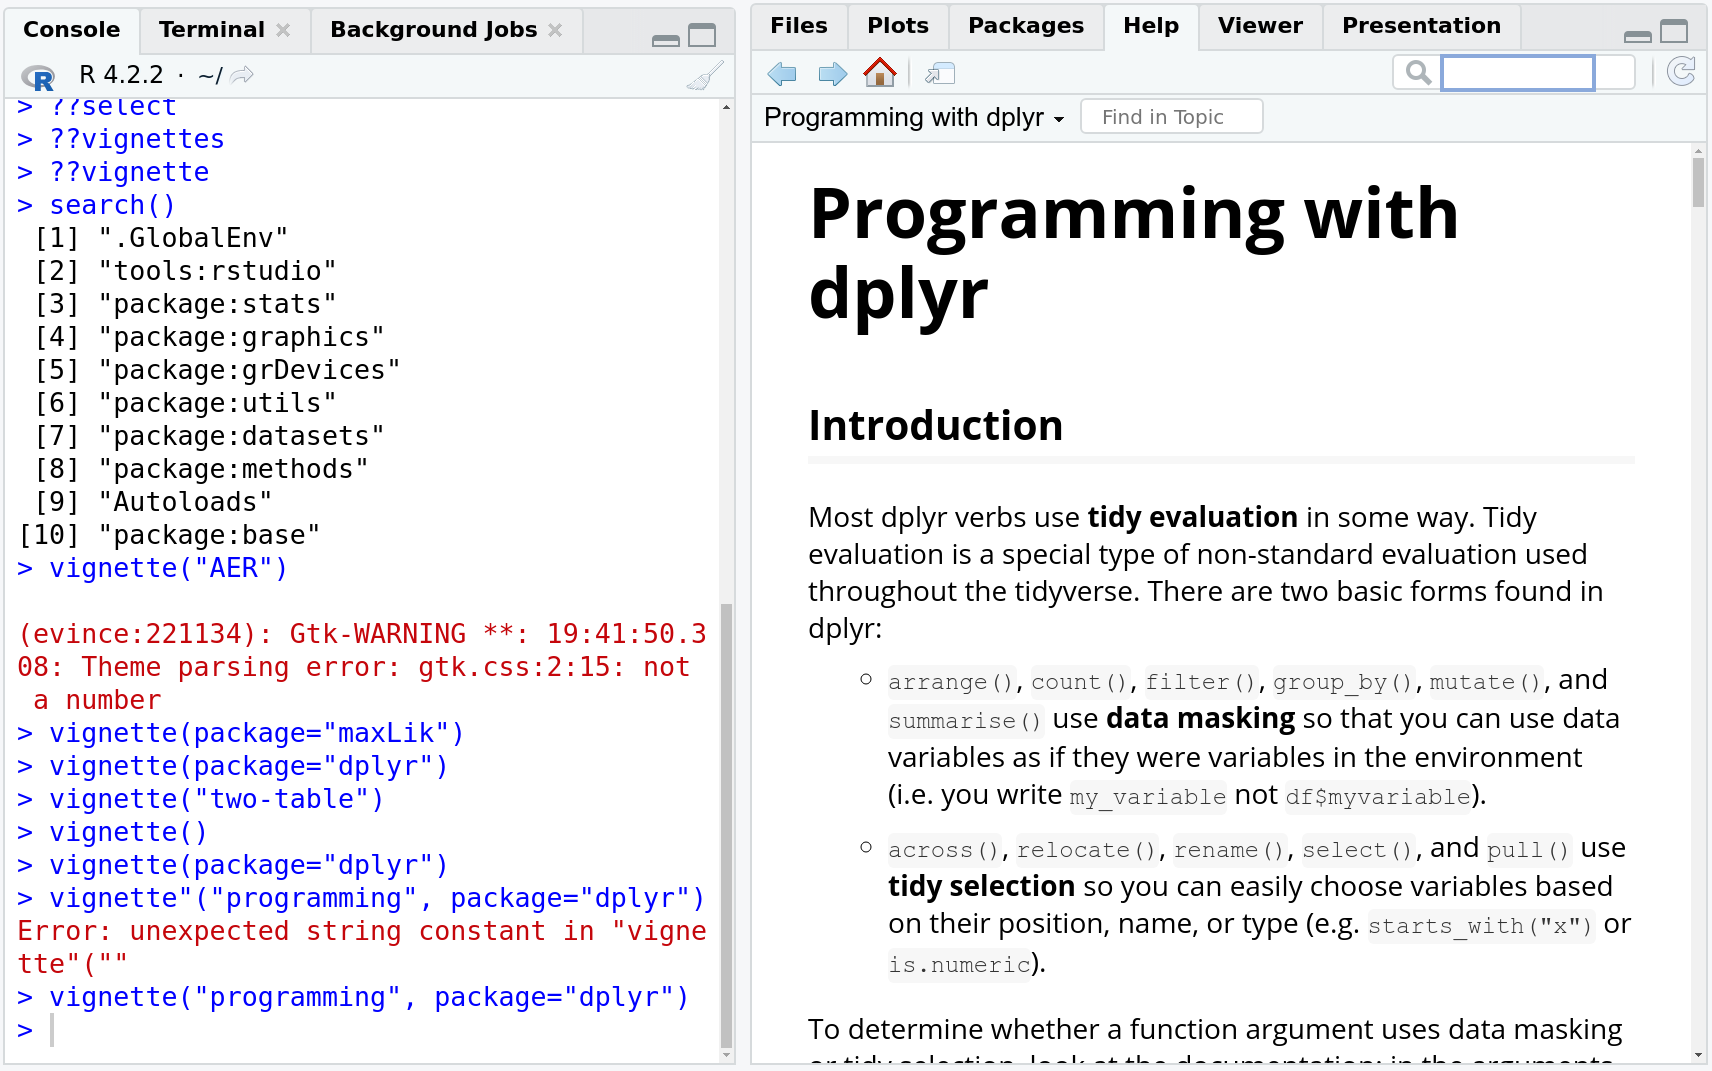
vignette("programming", package="dplyr")
displays the dplyr programming vignette, here in the help window as it
is an html file. It provides more in-depth documentation to dplyr
programming than help files for individual functions do.
or, if you know which package you are looking for as
You can display the vignette as
The result will be displayed either in RStudio help window (if it is an html file), or in a pdf viewer if it is a pdf file.
The help sources discussed here are typically also available online, so you can easily find these in google. However, be aware that what you find online may correspond to a different version of the software than what is installed in your computer. While the differences are usually not large, it may occasionally cause annoying issues.
Finally, a word of warning. While it is almost always advisable to start your journey for help with documentation, some of the documentation is of incredibly low quality. This applies both for open-source software like R, and also for commercial software. Writing good documentation is quite a bit of work and requires specific skills. Developers may have neither the time nor skills to write good docs.
9.3 Debugging
Debugging is a generic term that describes finding and correcting errors in code. The term originates from early days of computers where errors were often caused by insects (bugs) crawling into the machinery and interfering with its operations. The insects are not a problem any more but errors in code are as common as ever. Programmers do mistakes. Newbies do mistakes. Experienced programmers do mistakes. Everyone does and you will do too. We have to live with coding errors and we have to learn to fix those.
There are various kinds of coding errors. One of the first types of mistakes you encounter are syntax errors. Syntax error means that computer does not know what to do with the code, and just stops and outputs an error message. For instance, when you try to add a number and string, you get
## Error in 1 + "2": non-numeric argument to binary operatorSyntax errors are typically easy to fix, but for beginners the
messages may look too cryptic and incomprehensible. The message is
not very helpful if you don’t know that “2” (quoted two) is a string
and hence not a number, and you have no idea what is “binary
operator”. To put it in a simpler language, + is a binary operator
because it expects two numbers to be
added. And here it complaints that one of these was not a number but
a character string.
The good news with syntax errors is that you will learn to understand these rather quickly. These are also easy for experienced programmers to clarify if you show the line of your code and the message.
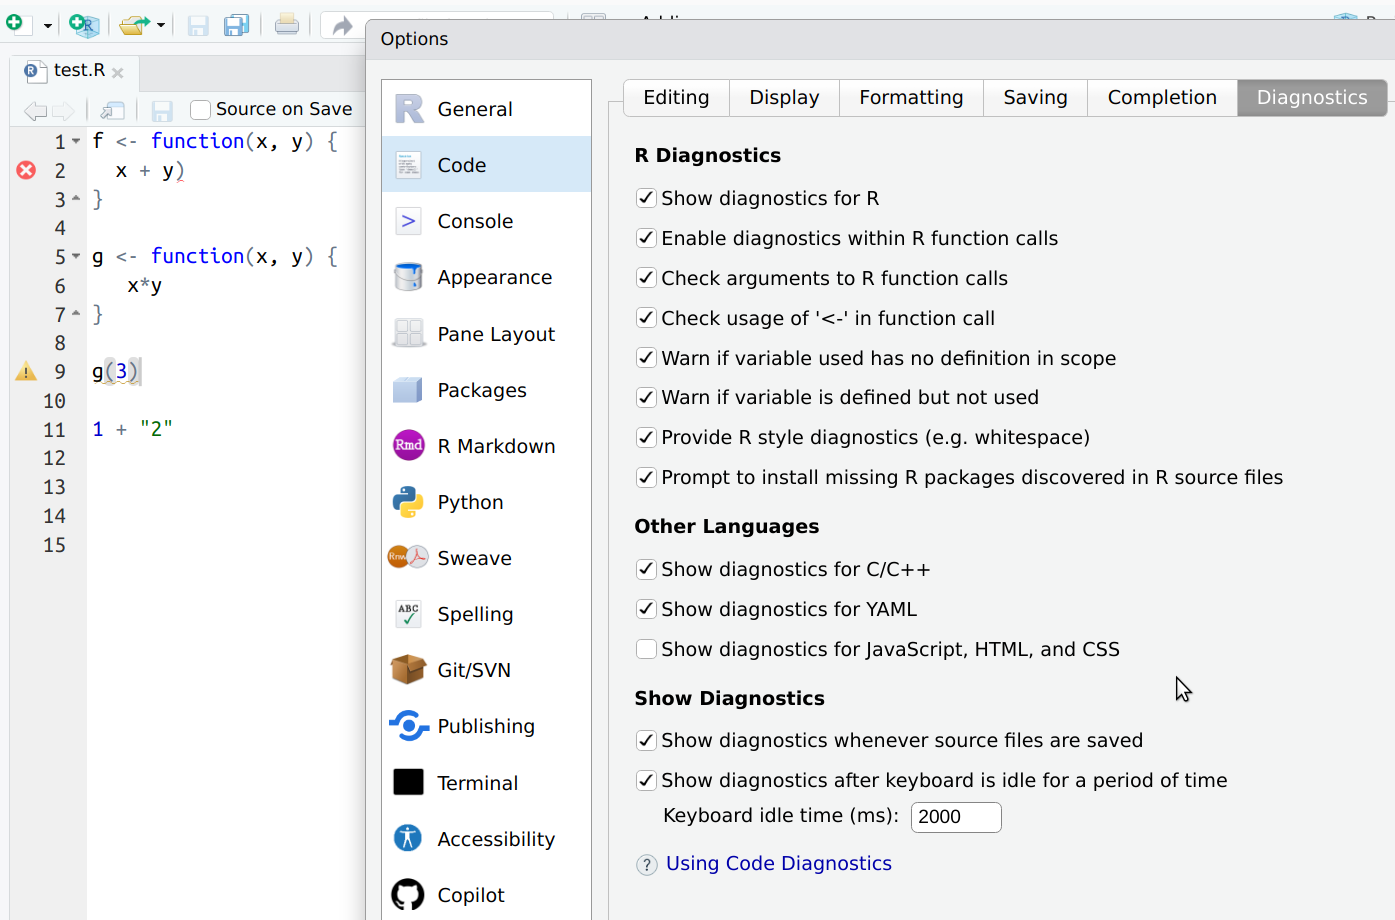
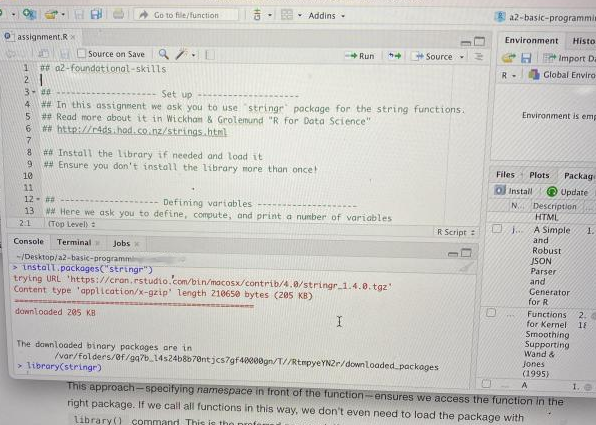
Rstudio displaying lines with syntax errors (red cross) and wrong arguments (yellow triangles). However over these with mouse to get more information.
Helpfully,
RStudio will also analyze code and mark various errors. You need to check
the respective options in Tools -> Global Options menu. But the
analyzers cannot find even all the syntax errors, here the erroneous
1 + "2" is
not spotted by RStudio.
It is often harder to spot errors in program logic–after all, your code works! Yes, it works, but the output is not what you want. Or in a more tricky case you don’t even know what the output should look like. Say, you want to compute the rural-urban migration rate based on population registry data. You find it is 1000 persons per year. Is this number correct? We don’t know unless we thoroughly test the methods and data.
Below we describe a few common debugging techniques, some of those are universal and some R-specific. We focus on spotting and isolating errors in logic but some of the methods are also suitable for syntax errors.
9.3.1 Generic advice
Some of the most basic techniques you use when debugging are not really debugging strategies but general strategies to ensure that your work is good. Here we discuss a few.
9.3.1.1 Understand your code
Before you even begin to debug, you should understand the code. You
should understand every variable, every function, every logical
operation in the relevant code block. You cannot isolate errors if
you don’t know what exactly is the if statement doing over there,
or what the variable’s value is supposed to be.
This is less of a problem when you are debugging your own code but may be quite laborious if it has been written by someone else. But even in the latter case, the problem can often be isolated to a small part of code (for instance, to a function), and in that case you do not have to learn the rest of the code.
9.3.1.2 Move with baby steps
Another generic recommendation is that do not change your code much before you run and test it again. It may be tempting to do several steps in one go in order to write less code and do less testing. But it is easier to fix issues one-by-one as they come up, in particular if you have little coding and debugging experience. So here is the recommendation: Change only a single task at time, and run/check your code again. Obviously, when you gain experience, you will decide when to apply this rule and when not.
9.3.2 Print the values
This is one of the most powerful and universal method of debugging. You just insert printing commands into your code, commands that output the variables and data as the program runs. As you examine the output, you should be able to see where they deviate from what they ought to be. Needless to say, in order to see where the values get wrong you need to know what the correct values should look like!
Although nowadays there exist powerful debuggers that can stop your code at pre-determined points or at pre-determined variable values, the printing-values method is still alive and well. It is simple (you don’t have to learn debuggers), it is universal as every programming language can print, and it can be extended into environments where you cannot easily use more powerful debuggers. For instance, if are developing a web backend and your code has to run in a docker container on a restricted-access server, then it may be very laborious to replicate the (restricted) working environment on your own pc. It may be much easier just to print the variable values in the suspicious part of code (you may have to send output to a log file though).
Let’s demonstrate this with an example. Suppose you want to write your own factorial function (remember: factorial of a number \(n\) is \(n! = 1\times 2\times 3 \times \dots \times n\)). We write the following function:
factorial <- function(n) {
   f <- 1  # accumulator
   for(i in 1:n) {
      f <- f*n
   }
   f
}
factorial(7)  # should be 5040
## [1] 823543The result is 823543, nowhere near 5040 as it should be. What went wrong?
In this simple example, you may be able to spot the mistake easily. But let’s pretend we do not.
We can start debugging from beginning–the values are probably correct
initially, and find the place where they go wrong. Or alternatively, we begin
debugging from the
end (where we know the results are wrong) toward beginning to spot
where they are still correct. Let’s take the first approach here.
If we want to be really foolproof (or if the task is complex), then we
also want to ensure that f is actually “1” to begin with, and just
print it out right after assignment:
factorial <- function(n) {
   f <- 1  # accumulator
   cat("f = ", f, "\n")
   for(i in 1:n) {
      f <- f*n
   }
   f
}
factorial(7)  # should be 5040
## f = 1## [1] 823543We still get the wrong result, but now we also have the message that
f is indeed “1”. Note that it is critical you understand what
should the value of f be. If you set f <- 0 here instead, because
you do not understand the logic, then the message will confirm it is
“0”. Your code will not work, but you still cannot tell why.
Next question we may ask is whether we got the loop right. Let’s
print i inside the loop as it goes. I remove the previous
printing to have less clutter on screen:
factorial <- function(n) {
   f <- 1  # accumulator
   for(i in 1:n) {
      cat("i = ", i, "\n")
      f <- f*n
   }
   f
}
factorial(7)  # should be 5040
## i = 1
## i = 2
## i = 3
## i = 4
## i = 5
## i = 6
## i = 7## [1] 823543The printed i-s look right–they are numbers 1..7.
Next, is the accumulator f updating working correcly?
Here we preserve the
previously printed values, to see how f is updated for each i:
factorial <- function(n) {
   f <- 1  # accumulator
   for(i in 1:n) {
      f <- f*n
      cat("i=", i, ", f =", f, "\n")
   }
   f
}
factorial(7)  # should be 5040
## i= 1 , f = 7
## i= 2 , f = 49
## i= 3 , f = 343
## i= 4 , f = 2401
## i= 5 , f = 16807
## i= 6 , f = 117649
## i= 7 , f = 823543## [1] 823543This shows the problem: even as i=1, we still have f=7. Something
must be wrong with the way we multiply the accumulator as it should be
“1” in that case. A quick look tells that we need f <- f*i, not f <- f*n.
Obviously, here again you must understand what is going
on in the code, and what is the value of f supposed to be.
TBD: example without data frames
Example 9.1 TBD: move this to data frames
Suppose you are writing a function that uses iris data, and returns the average sepal length for a species submitted in the argument. The iris data, collected in 1930-s contains four flower measures of 150 iris flowers of three different species. It is built-in into R so no need to load anything from disk. An sample of the data looks like
##   Sepal.Length Sepal.Width Petal.Length Petal.Width    Species
## 1          6.0         2.7          5.1         1.6 versicolor
## 2          6.1         2.8          4.7         1.2 versicolor
## 3          5.4         3.4          1.7         0.2     setosa
## 4          5.9         3.0          5.1         1.8  virginica
## 5          6.2         2.2          4.5         1.5 versicolor
The function might look like
sepalLength <- function(species) {
   subset <- iris[iris$species == species,]
   mean(subset$Sepal.Length)
}
And we may run the code as
## [1] NaNObviously, the function does not work as expected. But what went wrong? Let’s take the second approach and print sepal length of the subset inside of the function. So the amended function will look like:
sepalLength <- function(species) {
   subset <- iris[iris$species == species,]
   cat("Sepal length:", subset$Sepal.Length, "\n")
   mean(subset$Sepal.Length)
}
and we call the function again:
## Sepal length:## [1] NaNThe line that was supposed to print sepal length printed nothing.
Hence our sepal length is empty for some reason (technically, it is
the special empty value NULL, you can see this if you use print
instead of cat). But why is sepal length empty? Let’s print the
subset instead:
sepalLength <- function(species) {
   subset <- iris[iris$species == species,]
   cat(" -- subset:\n")
   print(subset)
   mean(subset$Sepal.Length)
}
sepalLength("versicolor")
## -- subset:
## [1] Sepal.Length Sepal.Width Petal.Length Petal.Width Species
## <0 rows> (or 0-length row.names)## [1] NaNWe add both cat(" --.. statement to indicate where the output should
be, and use print to print the actual data frame (cat() cannot
print data frames, see Section 4.5).
And the problem
is there–we have a “data frame with 0 columns …”. So the data frame
itself is empty. But why is it empty? Does the selection filter
iris$species == species work? Let’s try this:
sepalLength <- function(species) {
   subset <- iris[iris$species == species,]
   cat(" -- filter:\n")
   print(iris$species == species)
   mean(subset$Sepal.Length)
}
sepalLength("versicolor")
## -- filter:
## logical(0)## [1] NaNBut why is the filter logical(0), i.e. there are no values there?
Let’s check the iris$species:
sepalLength <- function(species) {
   subset <- iris[iris$species == species,]
   cat(" -- species:\n")
   print(iris$species)
   mean(subset$Sepal.Length)
}
sepalLength("versicolor")
## -- species:
## NULL## [1] NaNWoww! iris$species comes back NULL. Does iris data contain
species in the first place?
## [1] "Sepal.Length" "Sepal.Width" "Petal.Length" "Petal.Width" "Species"And here we got it–the variable name is capitalized Species, not
lower-case species! Replacing this, the code works:
sepalLength <- function(species) {
   subset <- iris[iris$Species == species,]
   mean(subset$Sepal.Length)
}
sepalLength("versicolor")
## [1] 5.936This example code was very simple and even little experienced programmers might easily spot the problem without much effort. But the same approach applies to much more complex coding problems.
9.3.3 Delete parts of your code
A different but also a very general approach to debugging is just to delete parts of your code, block-by-block, until what is left is working.
In simpler cases you do not even need to delete the code, you can just comment it out–add a comment sign in front of every line, so the computer will ignore it.23 In more complex cases, it is better to make a copy of your code and literally delete everything that is not central to the problem. But you should delete it line-by-line or block-by-block, and see if the problem goes away after removing the next piece.
Example 9.2 Here a small personal story: I was helping a TA to debug a student’s shiny app that gave an error
Warning: Error in server: unused argument (output = > list(
, function (x) x))
1: runApp
Error in server(…) :
unused argument (output = list(, function (x) x))
None of us could understand what it means.
I deleted the code, block-by-block, but the error persisted. At the end, all what was left was
library(shiny)
ui <- fluidPage()
server <- function(input, ouput) { }
shinyApp(ui = ui, server = server)
Can you spot the error?
As this was all that was left, it must have been somewhere in these lines. But I neither of us could see any problems. After 45minutes of work, I re-wrote exactly the same code from scratch… and it worked! Why on earth did the new code, the same code, suddenly work, while the student’s version did not???
After comparing the two code files, the old and the new, line-by-line, I finally noticed what was wrong: it was miss-spelled output! The third line must have been
instead of
I was only able to spot this problem because I had located the error down to just a few short lines of code.
It also serves as a cautionary tale: all-in-all we spent maybe 4 human hours trying to fix the problem. Sometimes, even experienced coders have trouble locating simple problems. And error messages matter: the problem had been much easier to solve had the error message been more informative.
9.3.4 R built-in debugger
R has a built-in debugger that lets you to execute code a single line at a time and inspect variable values while you go. There are two ways to invoke the debugger:
- The command
debug(sepalLength)(issued on R console) switches the functionsepalLengthinto debugging mode. Now instead of running through the whole function, R executes it line-by-line. - One can switch into debugger by adding command
browser()into your code at the desired location.
When running in debugger, R waits your input (at console) between executing the lines. The most important inputs are
nfor run next lineQto quit debugger- printing commands to print variable names. One can also run other
kind of R requests, e.g.
names(iris)to inspect the variable names.
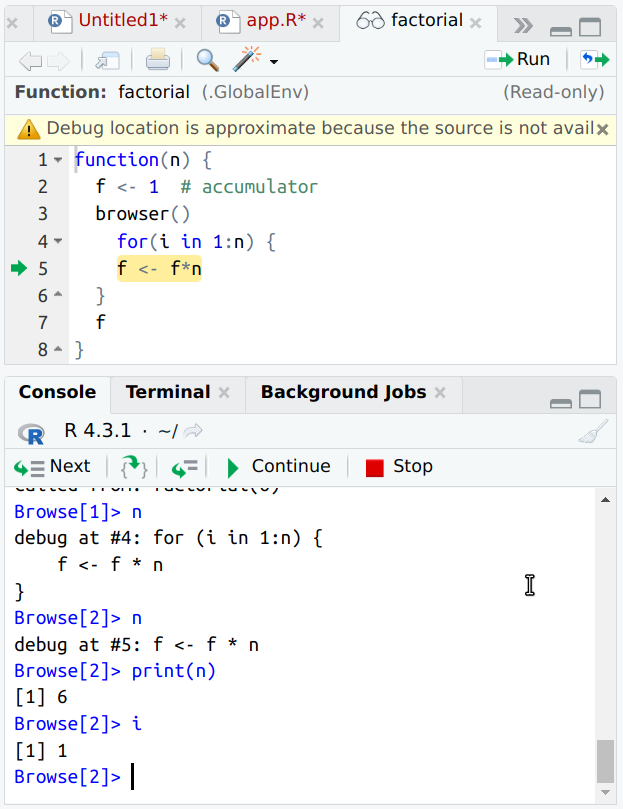
R built-in debugger in action. The console shows certain variable
values, note that while you can just type i to see its value, you
need to print(n) because “n” means to step to the next line.
Let us demonstrate how to find the same error using the built-in
debugger. We want to activate the debugger as soon as we enter the
function, so we add browser() at the top of the function:
sepalLength <- function(species) {
  browser()
  subset <- iris[iris$species == species,]
  mean(subset$Sepal.Length)
}
This causes R to enter in the debugging mode as soon as the function
is called. We source the function, and now, when we call sepalLength("virginica"),
R stops immediately
with debugger prompt instead of running through the function:
This means that R now expects your commands like in the ordinary R console, just this is now debugger console and you can enter the debugger commands. Note that while we can run R code line-by-line using the RStudio run methods, debugger stops the running program in a pre-determined place with all the environments set up correctly. For instance, we can see what is the value of argument species:
This tells us that the species we ask–virginica–is passed to the function in a correct manner.
As the function has not performed any operations, there is little we
can test here. So we enter n, step to next line:
The first n forced R to do some setup tasks and we were stuck in the
same line, so we enter n again:
This forces the active line to move from subset <- ... to the next
line mean(.... This means that everything on the previous line was
executed, and we can go and check how does the variable subset look
like:
We discover that subset contains 0 rows.
We can also quickly check if the logical expression is right:
It apparently is not–it should not give 0-length logical value. As
we tested above that species argument looks fine, we now check
iris$species:
Apparently iris data does not contain species. But what does it contain?
And we see that it contains Species, not species.
As you can see, the built-in debugger is much faster to use, you can
just issue the commands as soon as you see what is wrong with the
previous variable. The difference is even larger if your code needs
to do some slow data churning tasks before getting this far.
This makes the debugger often the preferred way to
debug the code. It is fast, simple, and effective.
The downside of the debugger is that it does not work in many environments. For instance, you cannot insert debugger in an rmarkdown document to see why does knitting fail. You have to resort to printing. In a similar fashion, in the interactive shiny apps the usage of debugger is very limited. Printing is much more universal.
9.3.5 Other ways to debug your code
Maybe you have experienced the following situation: your code fails. You cannot figure out what is going on. So you go to an expert (or to someone you think is more experienced than you) and ask for help. Obviously, the expert has little idea what you are doing, so you have to explain what the code does. But surprisingly, when explaining your code you suddenly understand what is wrong there.
This is called rubber duck debugging. As the example above shows, the experts’ knowledge did not play any role. What helped you to solve the problem was the opposite–the fact that the expert did not know how your code was supposed to work. So instead of bugging an expert, could you have explained it to a random person? Or maybe you don’t need even a human being, perhaps your cat or even just a rubber duck is enough?
So thinking through the problem helps. Even more, not just thinking but articulating what do you think. I often find it useful to write the central logic of the code down on a piece of paper using some sort of pseudocode, or just plain human language.
A different strategy is to use mock-ups. This comes handy when your complex code runs slow on a large dataset and returns results that do not make sense. What goes wrong? The analysis is complicated and you cannot tell what should be the exact results on hundreds of thousands of lines of data. Even more, you cannot wait for hours-and-hours before the problem pops up.
This is a situation where mock-ups may help. Mock-ups are replacing the complex code with something fast and simple that produces broadly similar results. In case of data processing, you may replace your complex data with something small and simple too. If you simplify it enough, then you may be able to figure out what is the correct solution.
TBD: mockup example
TBD: * do research: * search for error message * some advice may be dangerous * simple test
9.4 How To Ask Good Questions
Sooner or later, you’ll run out of your own ideas and you need to ask someone for help. Here we’ll focus on codeing, but these general rules also apply to many other types of problems, such as how to write an essay hor how to pacify a baby.
You can always ask anything, but the same question asked in one way may give you more and better replies than when asked differently. This is often a stumbling block for beginners who do not possess the vocabulary and the fine touch with communication style that make the professionals willing to reply to the questions. And these are often experienced coders who answer your question in their free time!
There are many sources about how to ask good questions (see, e.g. Stackoverflow How to ask good questions). These usually boil down to
- Explain what do you do
- Explain what goes wrong
- Be polite
However, as each medium and context is somewhat specific, many of the requirements that are true on one website may not be relevant for another. For instance, Stackoverflow insists that one should not ask the same question again. But when doing coursework, it may be hard to search the not-that-easily-searchable media for similar questions. So here is a set of the corresponding rules, adapted for an intro coding course.
9.4.1 Explain what do you do
The first rule for someone to help you is that the person must understand your goal. You should be specific enough so that experts are not confused. For instance “I want to print numbers with a few decimal digits only” is a good explanation. But “how to print correctly” is a too vague goal.
Unfortunately, it is not always easy for beginners to describe the problem in a language experts understand. This includes concepts that beginners are not quite sure about and use in a misleading way. For instance, if my function returns a wrong value, I may ask about “wrong output”. But output normally means the text that is printed on screen, and this is not the same thing as what function returns (although return value is sometimes printed). This may throw off some experts and cause some less-than-polite remarks about your question and about you. If you are asking help in a professional forum such as Stackoverflow, it may be a good idea to introduce yourself as beginner (e.g. “This is the first time I use functions …”), but it is obviously not necessary when asking help from your course instructor. You are taking the course because you are beginner!
The third, and extremely important point is to show what you have done. If your function’s return value is wrong then usually the only way to help is to look at your code. So please show your code! Either copy-paste the code to chat, or show a screenshot, or maybe you want to upload it to a website or share a github link. But be aware that some ways of sharing your code expect more from the expert, and they tend to be busy and not interested in spending extra time downloading and setting up your code. So the best way is to show your code right in the chat or forum. Next, simplify your code as much as you can. It is OK to post a 3-line function that misbehaves, but it is not OK to post 300 lines that do a lot of tasks, most of which are not related to your problem. In that case make a copy of your code and delete everything that is not central to the problem. This is called minimal reproducible example.
Minimal example may contain something that is outside of the code. Maybe you forgot to add a file to your git repo? Maybe the file you intend to use is in a different location? Maybe you are running your code in a wrong way? In that case a screenshot accompanied with description what do you do may be the best explanation. For instance, if R cannot find a file that you think is there, consider posting an image that shows both R code (the part that attempts to load the file), and of the content of the directory. If you run selected lines in RStudio, you may show a screenshot with the selection highlighted, and tell “I select these lines and click Run…”.
So the rules here are
- Explain what do you do
- Be specific
- Use precise language
- Show your code (and other relevant context)
- Show only the relevant part of the code
As this is a university course, you should also do not want to share complete solutions on the chat. A few lines are usually OK, and if in doubt, then please delete the screenshot afterward.
9.4.2 Explain what goes wrong
Before one can understand what is wrong with your code, you should tell them what actually happens when you run it. Others may sometimes be able to take your code (but this is not always the case), run it, and see the same output, but even if it is the case, it requires much more effort from their side. And remember–experts (and instructors) are usually busy! So it is your task to show what actually happens. Does your code produce an error message? Show it in its entirety! Do not just say “I get an error”. Show the actual error message! This is a very important clue that may help to find the problem much faster.
But often the problem is not the error message. Your code runs but
produces wrong output.
It may be obvious for you, but someone else looking at your code may
not understand what you are not happy with. What is wrong if your
code computes sqrt(2) and outputs 1.4142135623730951455? It is
correct after all. You have to tell what do you want to achieve, e.g. you may
want to see just 1.414 instead of the long list of digits.
Finally, tell us what did you try. It is OK to ask for help but do your own part first. Did you google for the error message but nothing useful showed up? Did you read the docs but those were incomprehensible (which is unfortunately too often the case)? Did you check if the files you need are where they are supposed to be? Did you try another way to achieve the task but you could not think of any? Try-first-yourself rule is here for three reasons. First, you should not ask the others to solve problems that you can do easily yourself. Second, you should show the experts that your task is important enough that at least you have spend some effort trying to solve it. It is not fair to expect that only the others put effort in solving your problem. And finally, it helps the instructor to adjust their explanation to use tools and concepts that you know.
So the rules here are:
- Show what happens
- Explain what do you want to happen
- Tell what did you try
9.5 Coding Style
Coding style refers to how your computer code looks from the human perspective. Note that we are talking here from human perspective, not from computer perspective. Computers only care if the code is correct–computers just execute it, and do not understand what it does. Humans, however, hardly ever execute the code. But in order to tell what a piece of code does and whether it is correct, we have to understand it. And how you write your code matters quite a lot for understanding.
I stress here that you want your code to be easy to understand, as easy as possible. Do not misunderstand–understanding code, even your own code written a week ago is usually hard. But do not make it even harder by writing it in a messy way! There are a number of ways how to improve the legibility of code, and while all these rules can be broken, you should be able to explain why did you chose not to follow any of these.
9.5.1 Variable Names
The syntax of variable names is easy: variable names start with a non-number, but otherwise contain numbers, dots and underscores.24 But in order to make your code easy to understand, you should be aware of a plethora of other rules and considerations. There is always a myriad of ways to choose variable names and naming schemes. This is often of little importance but sometimes it may lead to errors that are frustratingly hard to debug. Below we discuss a few general strategies. As always, feel free to break any of these rules, but be able to explain why do you do that!
9.5.1.1 Choose appropriate variable names
But what is “appropriate” depends on the task. In general, the names
should be descriptive and tell the reader what is the value they
contain. For instance, variables like age, income and mass are
self-explanatory enough, so that it is easy to understand what is the
meaning of the corresponding variables, and hence what the code does.
But wait a minute. They may actually not be that obvious. Imagine
you are working in a bank with labor force survey data. Now what is
exactly is income again? Is it yearly income in current dollars of
the survey respondents? Is it inflation-adjusted income? Is it
hourly wage? Is it total personal income in the economy? Is it the
yearly revenue of the bank… ? As you see, here we may have to be
more specific and use variable names like yearlyIncome,
constant_income or similar, depending on what kind of different
incomes the project deals with.
Typically, it is fine, even desirable, to use short variable names in
small projects. For instance, when writing a
tiny loop that prints a message three times, the loop counter can well
be called i:
The plain i makes the code easier to grasp than a more complex name,
e.g. greeting_counter. Just compare:
However, this does not mean that you should always choose the simplest
variable names.
greeting_counter may be a good choice in case you
are developing a more complex project with nested loops and many counters,
and you need to know what exactly the loop is counting.
Larger projects often contain multi-word variable names. The most
popular options here are snake_case, separating different words by
underscore, and camelCase, marking the word boundaries by an upper
case letter. R also allows to use dots, so dotted.name is a
perfectly valid name in R.
snake_case_is_readable_for_long_names_too but
longNamesInCamelCaseAreMuchHarderToUnderstand.
Dots, in
turn, may mislead R to think it is an object-oriented method.
But underscore is a
special symbol in many contexts25, so I am usually trying to avoid it.
9.5.1.2 Do not use misleading variable names
The best variable names explain what the corresponding values mean.
Often it is also acceptable to use generic names, such as x or i,
if the meaning can be deduced from elsewhere. If you encounter a name
like x, you understand that you need to look elsewhere to find its
meaning. But the worst variable names are the ones that mislead you
to think that its value i something else.
This often happens with concepts that are fairly similar, and in
situation where new variables are just added to the project without
considering a more general naming scheme. For instance, if you call
log income income, it may mislead reader to think that it is income,
not logarithm of income. logIncome might be a better choice.
Variable education makes me to think it
contains either years of education, or maybe a label like high
school or college. It is not a good choice if it is just a label
for someone to have high school degree or not. HSdegree might be a
better choice.
Example 9.3
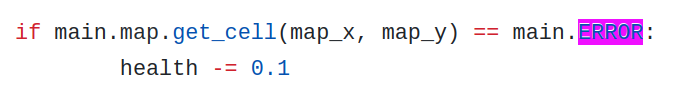
Sometimes it is hard to avoid misleading names. This is a few lines
of code from a computer game (written in Godot script). What is the
piece of
code at right doing? As it contains ERROR, one might think that it
is error handling, maybe main map throws and error, and then … what?
Yes, this is error handling, but these are not that kind of errors.
Namely, Error in this game
is a monster that hurts you when it catches you by
taking away your health, bit-by-bit.
For clarity, one might add a comment like “monster ERROR catches you” to this piece of code.
Are there any good alternatives to using the word “error” as variable
name? Not really. You can consider using a something like
monsterError, but it is not necessarily more clear, and it is also
less directly associated to the actual monster, called “ERROR”. Good
comments may be the best solution.
9.5.1.3 Do not overwrite data with derived results
Data science tasks typically start with loading, cleaning and filtering data along the lines
## load
data <- read_delim("data.csv")
## check if loading was successful
...
## clean and select variables
data <- data %>%
   select(var1, var2, var3) %>%
   filter(!(is.na(var1) | is.na(var2))) %>%
   ...
                           # do more cleaning...
...
## subset
data <- data %>%
   filter(var3 %in% relevant_cases) %>%
   ...
                           # do more subsetting...
## start real work here
This is a good way to work if you are compiling your rmarkdown report,
or if you are running the code from command
line in batch mode. However, when you just execute segments of your
code in RStudio, or you use notebooks, the typical workflow
jumps back and forth. This means you may have done your subsetting
and now you move back and do cleaning again. However, you data is
now different, not the one that you used when you did the original
cleaning.
This may lead to confusing issues where a piece of
code that just a second ago worked perfectly does not work any more,
or produces wrong results.
Consider creating temporary variables (and
deleting those with rm afterwards if you run low on memory).
Exercise 9.3
You are analyzing Indian election data. You are interested in the following parties:- Bharatiya Janata Party
- Indian National Congress
- Yuvajana Sramika Rythu Congress Party
- The original data you load from disk and that contains all the information
- The original data, but now you have corrected/removed erroneous information there.
- Data that only contains the most recent (2019) elections (and is corrected as above)
- Three sub-datasets, each containing results for just one of the parties mentioned above (for 2019 elections)
- Three sub-datasets, each containing results for only those districts where the party won.
So all in all, you need 9 different datasets. How would you name each of them?
See a solution
9.5.1.4 Create a naming scheme for collections and elements
Another common task is to run a loop over all elements of a collection. The collections usually have a particular meaning and hence you tend to call it accordingly. But the individual elements you extract in the loop have a rather similar meaning, and you are tempted to call it something very similar.
Consider a confusing example:
friend <- c("Li Seming", "Gao Guoqin", "Wang Chengbi")
for(person in friend):
    ...
    ## what is person, what is friend?
    ## which one is collection, which one is element?
    ## are they related in the first place?
There are two problems with the chosen variable
names: a) they are both in
singular, so it is unclear which one is an element and which one is
the collection; and b) they are quite different, so it is not clear if
person and friend are somehow related. An alternative would be to
consistently use the -s plural ending, or maybe _list suffix:
friends <- c("Li Seming", "Gao Guoqin", "Wang Chengbi")
## or maybe
## friend_list = c("Li Seming", "Gao Guoqin", "Wang Chengbi")
for(friend in friends):
    ...
    ## friends: plural, hence collection
    ## friend: singular, hence element of 'friends'
Select a coherent naming schema that distinguishes collections from their elements!
9.5.1.5 If you change the variable meaning, change its name too
Consider a task: you have test score data that contains numerical scores between 0 and 100. You want to replace this with a simple variable, just a binary indicator that tells if someone received score over 80. Sometimes we see it coded as
Why is it confusing? Because the original “testscore” means numeric score between 0 and 100. But now further down in the code it suddenly means a logical value for high test score.
In such case, create a new variable, such as “highscore”:
If you are worried about memory footprint then you may remove the original variable.
9.5.1.6 Select appropriate names for complex concepts
Normally you pick variable names that closely resemble the corresponding concept names. Now consider you are doing Bayesian statistics, and you need to compute probabilities \(\Pr(S = 1)\), \(\Pr(S = 0)\), \(\Pr(W = 1|S = 1)\), \(\Pr(W = 0|S = 1)\), \(\Pr(W = 1|S=0)\) and \(\Pr(W = 0|S = 0)\). These are probabilities and conditional probabilities, written down in standard mathematical notation. How would you name these six related but still very distinct variables? As you can see, the notation is confusingly similar but the small differences are still very important. You must be able to tell from your variable names which concept does it describe. I’d suggest to use names that reflect the mathematical notation as much as possible, that are close enough that both you and whoever else may read your code understands which concepts they are referring to. For instance, you can choose
Pr_S1, Pr_S0, Pr_W1S1, Pr_W0S1, Pr_W1S0, Pr_W0S0Complex formulas may be confusing to begin with, and introducing
incoherent variable names only adds to this confusion. It is also
extremely hard to debug code where one has to guess and remember
that pw_second means \(\Pr(W=0|S=1)\) and probability_new2 is \(\Pr(W=0|S=0)\).
9.5.1.7 Use grammatically correct words
Computers do not care about your English grammar. But there is only
one way to write the words correctly while you can write them wrong in
a myriad of different ways. It is just hard to remember if middle
point should be written as middlePoint, mdlePoint, midPoint or
midlPoint… If someone else is reading your code, they
may not understand if this is a typo or intentionally misspelled
variable name.
Typos in variable names is a frustrating source of errors that may take hours or even days to find. In particular, long variable names in languages that do not require explicit declaration (like R) can contain typos that are surprisingly easy to overlook. Do not make this work harder by intentional misspelling!
Use Ctrl - Shift - C in RStudio to comment/uncomment all selected lines, see Section J.1.↩︎
To be more precise, R allows any symbol within variable names, and variable names can begin with a number or space. Such variable names must be enclosed in backticks, for instance we can create a variable, named ” 1 + 1” (space-one-space-plus-space-one) as
` 1 + 1` <- 2. Such names are best to be avoided, but they are common in datasets.↩︎For instance, in markdown it denotes italic text, see Section 3↩︎