# The parameters, as list
ross_sxde_par = list(
  r = 1/200, # The clearance rate for infections
  g = 1/12,  # The mosquito daily death rate
  a = 1/4,   # The mosquito human blood feeding rate
  M = 50,   # The number of mosquitoes
  H = 100    # The number of humans
) 4. Asynchronous Stochastic Process
A Primer, Part 4
Stochastic, Continuous Time
In continuous time, the state of the system is updated one event at a time.
The total rate of change of the system is \(T = may(H-X) + rX + aX(M-Y) + gY\)
\(Y \rightarrow Y+1\)
\(Y \rightarrow Y-1\)
\(X \rightarrow X+1\)
\(X \rightarrow X-1\)
ross_sxde = function(XY, pars){
  with(as.list(XY), with(pars,{
    p1 = a*Y*(H-X)/H
    p2 = r*X
    p3 = a*X*(M-Y)/H
    p4 = g*Y

    t = t + rexp(1, p1+p2+p3+p4)

    event = sample(1:4, 1, prob=c(p1, p2, p3, p4))
    if (event==1) X <- X+1
    if (event==2) X <- X-1
    if (event==3) Y <- Y+1
    if (event==4) Y <- Y-1

    return(c(t=t,  X=X, Y=Y, x=X/H, y=Y/M))
}))}
xy = c(t=0, X=10, Y=10)
for (i in 1:5){
xy <- ross_sxde(xy, ross_sxde_par)
print(xy)
} t X Y x y
0.2019906 10.0000000 9.0000000 0.1000000 0.1800000
t X Y x y
0.2204362 10.0000000 8.0000000 0.1000000 0.1600000
t X Y x y
0.6627967 10.0000000 9.0000000 0.1000000 0.1800000
t X Y x y
0.8897093 10.0000000 8.0000000 0.1000000 0.1600000
t X Y x y
0.8941195 10.0000000 9.0000000 0.1000000 0.1800000 sim_ross_sxde = function(pars, X0=2, Y0=1, tmax=300){
XY = c(t=0, X=X0, Y=Y0)
tm = XY[1]
XY_t = c()
while(tm < tmax){
XY = ross_sxde(XY, pars)
tm = XY[1]
XY_t = rbind(XY_t, XY)
}
return(list(time=XY_t[,1], X=XY_t[,2], Y=XY_t[,3], x = XY_t[,4], y = XY_t[,5]))
}out <- sim_ross_sxde(ross_sxde_par)par(mfrow = c(2,1))
plot_XY(out)
plot_xy(out)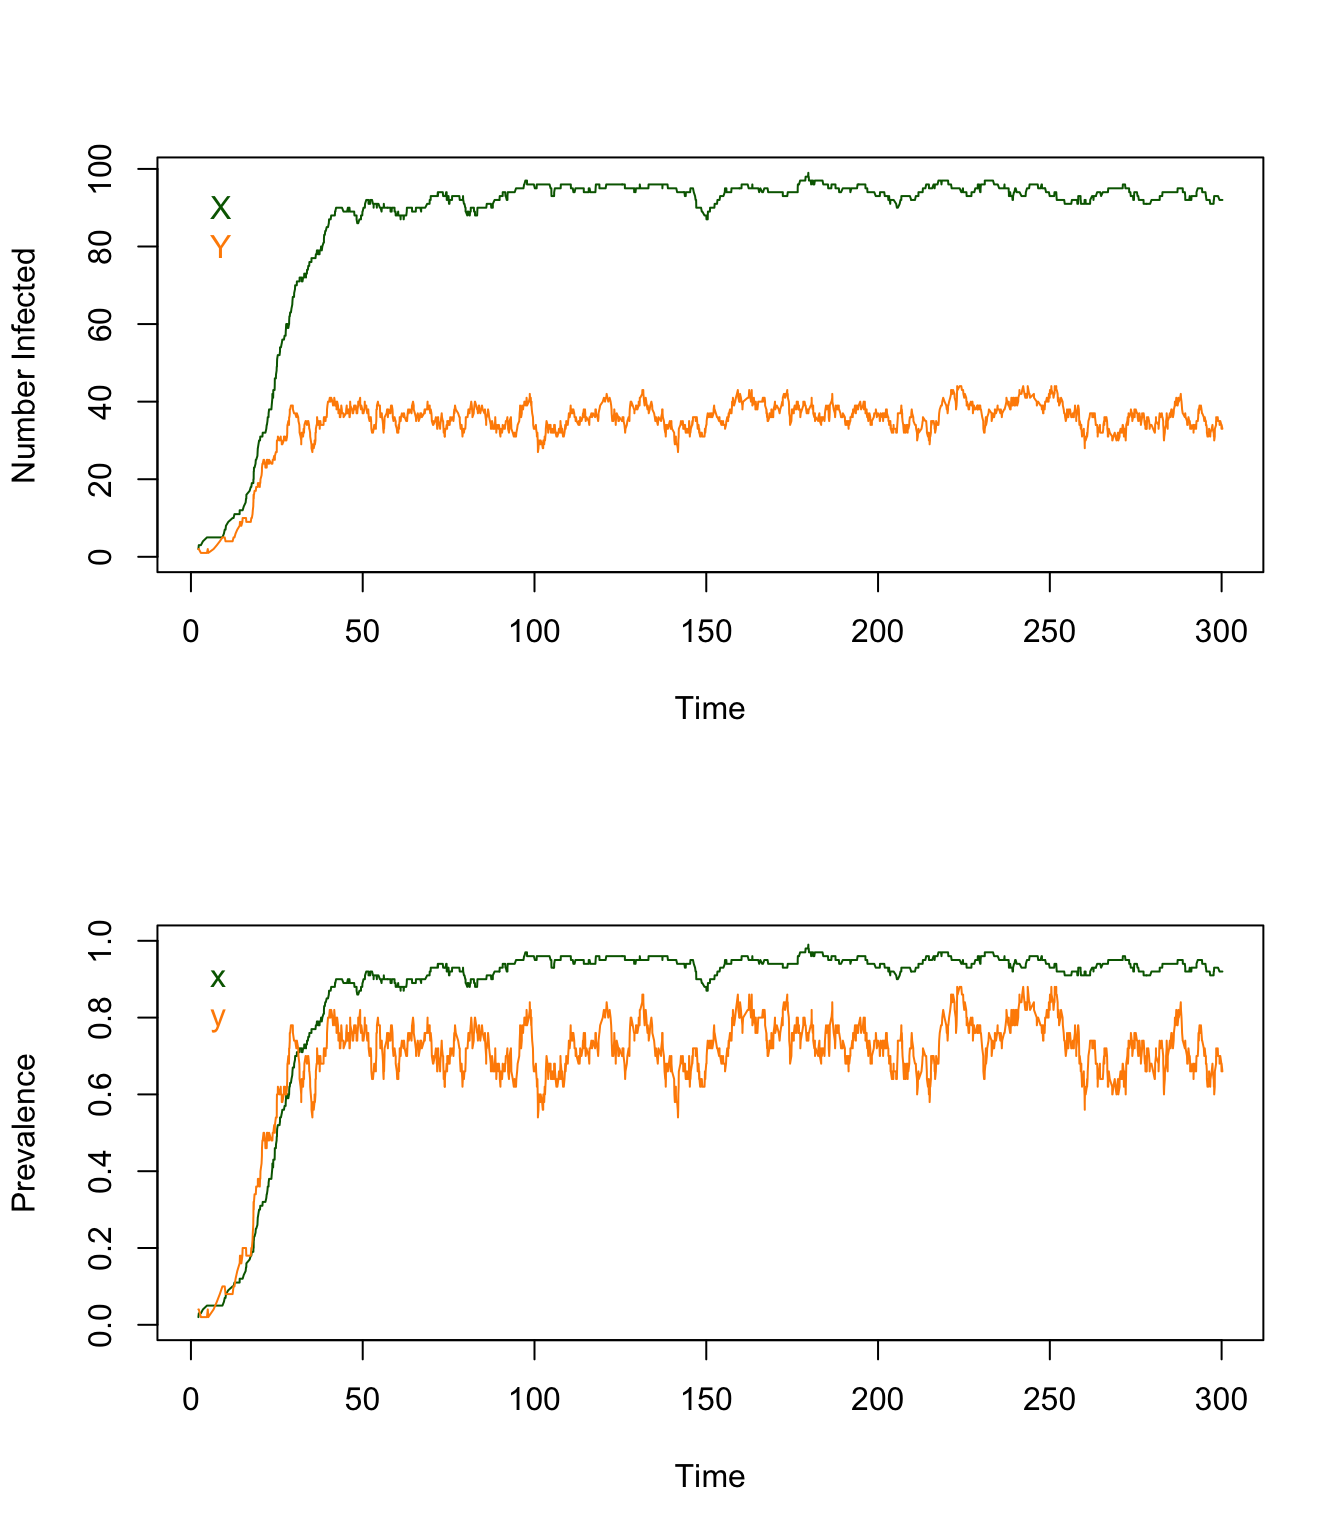
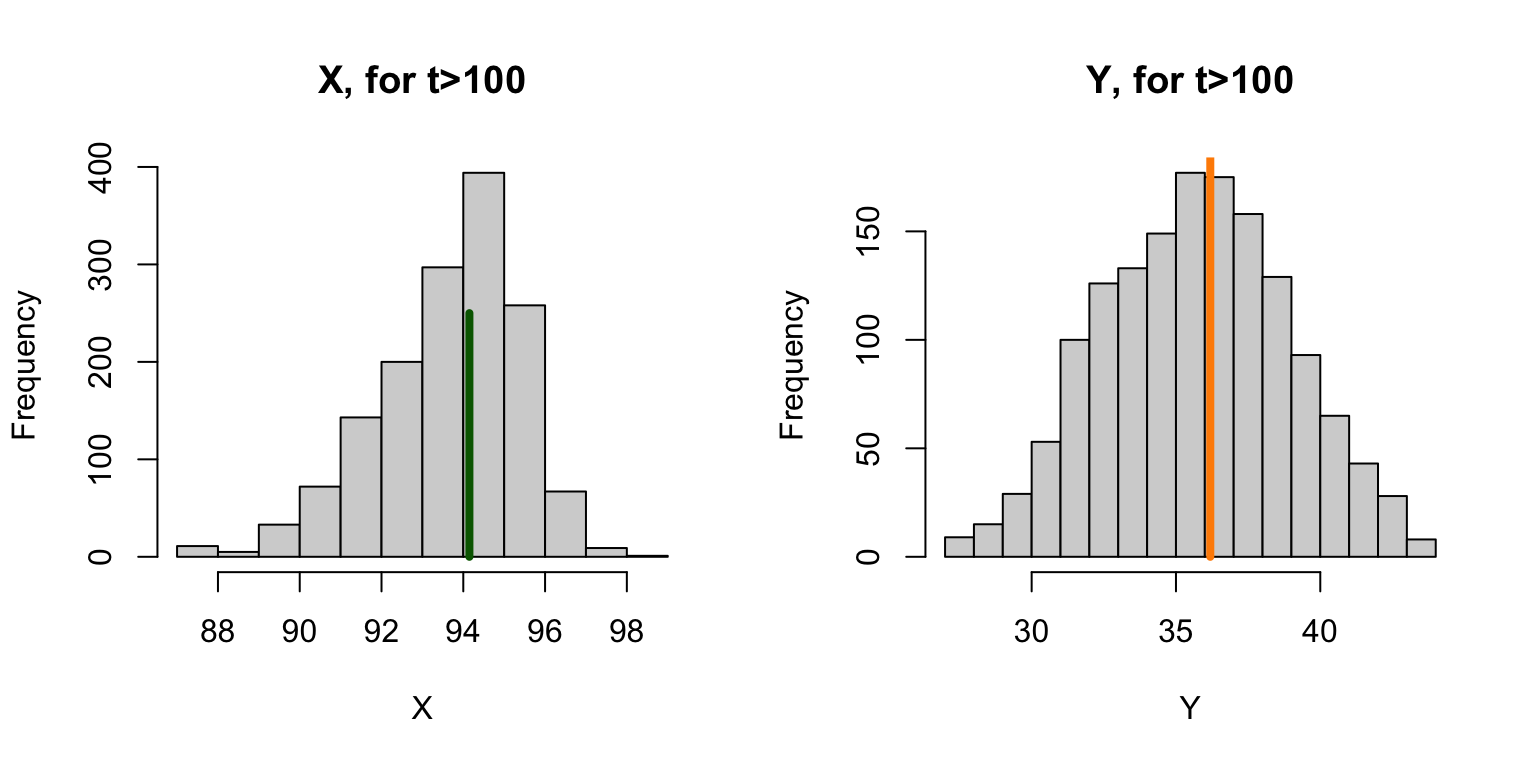
par(mfrow=c(1,2))
with(out,{
  ix = which(time>100)
  xdist= X[ix]; mx = mean(xdist)
  ydist= Y[ix]; my = mean(ydist)
  hist(xdist, 10, xlab = "X", main = "X, for t>100")
  segments(mx, 0, mx, 250, lwd=4, col = "darkgreen")
  hist(ydist, 15, xlab = "Y", main = "Y, for t>100")
  segments(my, 0, my, 200, lwd=4, col = "darkorange")
})
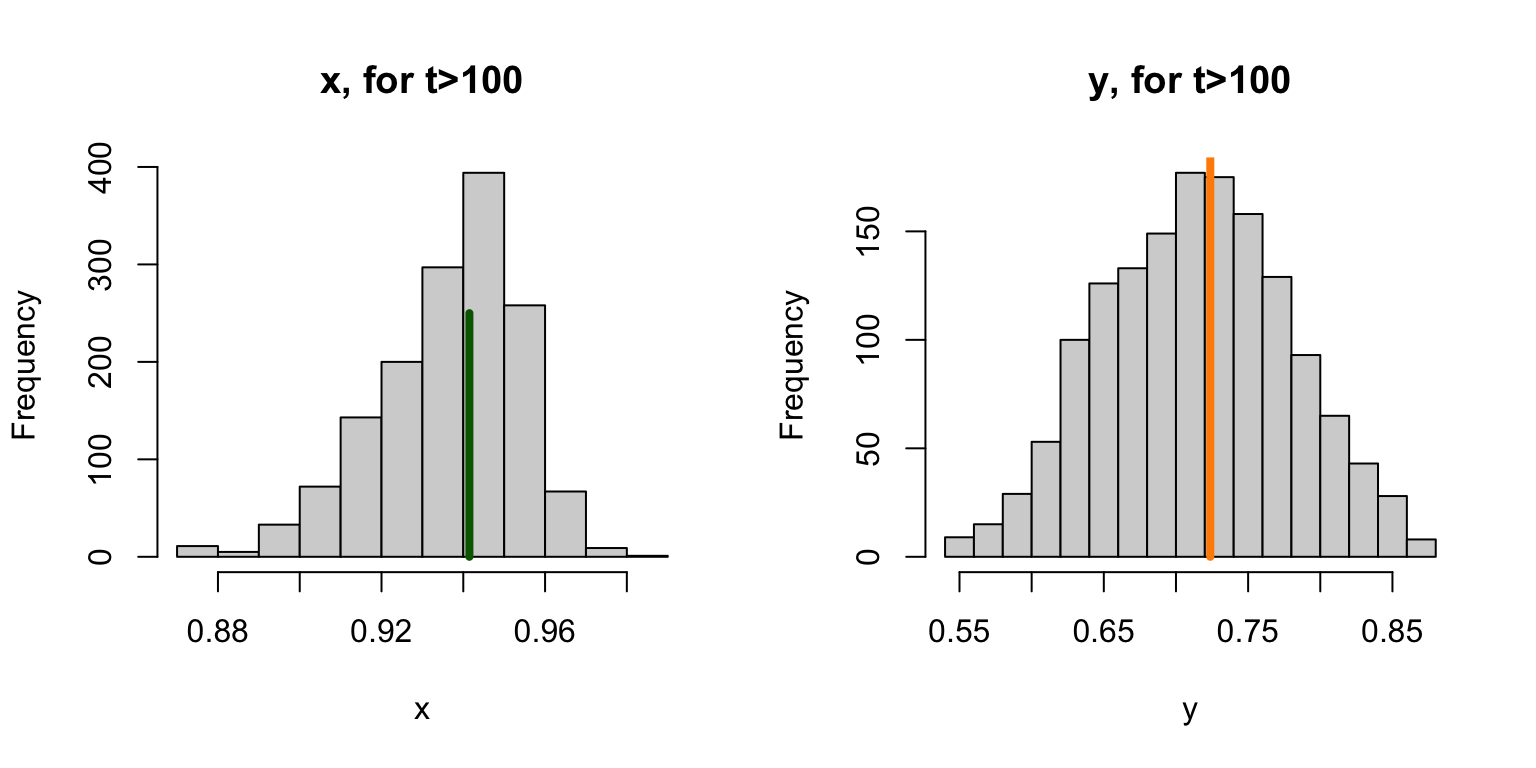
If we want to compare it to the other model, we can compute prevalence:
par(mfrow=c(1,2))
with(out,{
  ix = which(time>100)
  xdist= x[ix]; mx = mean(xdist)
  ydist= y[ix]; my = mean(ydist)
  hist(xdist, 10, xlab = "x", main = "x, for t>100")
  segments(mx, 0, mx, 250, lwd=4, col = "darkgreen")
  hist(ydist, 15, xlab = "y", main = "y, for t>100")
  segments(my, 0, my, 200, lwd=4, col = "darkorange")
})