Notation

Conventions:
Diagonal Matrix — Let \(\left[\left< x \right>\right] = \mbox{diag}(x)\)
Lagged Value — We use subscripts on state variable to denote the lagged value: \(X_\tau = X(t-\tau)\)
Structural Parameters
\(N_p\) — the number of patches in a model
\(N_q\) — the number of habitats in a model
\(N_h\) — the number of population strata in a model
\(J\) — the residence matrix is an \(N_p \times N_h\) matrix used to aggregate information from strata by patch: for example, if \(H\) is the population density vector for all the strata, then the size of the population living in each patch is: \[H_p = J \cdot H\]
\(N\) — the habitat membership matrix matrix is an \(N_p \times N_q\) matrix used to aggregate information from aquatic habitats by patch: for example, if \(\alpha\) is the number of adults emerging from aquatic habitats, per day, then the total emergence rate is: \[\Lambda = N \cdot \alpha\]
Bionomic Parameters
\(f\) — the overall blood feeding rate, per mosquito, per day
\(q\) — the human fraction
\(\tau\) — the EIP (see the EIP vignette)
\(g\) — mosquito mortality rate
\(\sigma\) — the patch emigration rate
\(\mu\) — emigration-related loss, including mortality and emigration
\(K\) — a mosquito dispersal matrix \[K = \left[ \begin{array}{ccccc} -1 & k_{1,2} & k_{1,3} & \cdots & k_{1, n} \\ k_{2,1} & -1 & k_{2,3} & \cdots & k_{2, n} \\ k_{3,1} & k_{3,2} & -1 & \cdots & k_{3, n} \\ \vdots & \vdots & \vdots & \ddots & \vdots \\ k_{n,1} & k_{n,2} & k_{n,3} & \cdots & -1 \\ \end{array} \right]\] with the constraint that \(\sum_j k_{i,j} = 1.\)
\(\Omega\) — the mosquito demographic matrix:
\[\Omega = \left[\left< g + \sigma \mu \right> \right] - K \cdot \left[\left<\sigma(1-\mu)\right>\right]\]
- \(B\) — the total human blood feeding rate, per patch
\[B = fqM\]
Transmission
\(w\) — The Blood Feeding Search Weights a vector of length \(N_h\) that is used to compute relative biting.
\(\Psi\) — The Time at Risk matrix is an \(N_p \times N_h\) matrix that describes the fraction of time in each habitat spent by each population stratum.
\(W\) — Availability, a vector of length \(N_p,\) is a weighted measure of ambient human population density in each patch:
\[W = \Psi \cdot \left(w H\right) \]
\(\beta\) — the Biting Distribution Matrix is an \(N_h \times N_p\) matrix that describes the expected number of bites on a human in each stratum from a single bite in each patch. \[\beta = \left[ \left< w \right>\right]\cdot \Psi^T \cdot \mbox{diag}\left[\left< \frac{1}{W}\right>\right]\]
\(E\) — the daily entomological inoculation rate (dEIR) and the dEIR Matrix. The expected number of infective bites, per person, per day is: \[E = \beta \cdot fqZ\]
\([E]\) — the dEIR Matrix. A matrix describing the number of infective bites, per person in each stratum, per day, from exposure to infective biting in every patch: \[[E] = \beta \cdot \left[ \left< fqZ \right> \right]\]
\(\beta^T\) — the Blood Meal Distribution Matrix is an \(N_p \times N_h\) matrix that describes the probability a human blood meal taken by a mosquito came from a human in each stratum: \[\beta^T = \left[\left< \frac{1}{W}\right>\right] \cdot \Psi \cdot \left[ \left< w \right>\right] \]
\(\Xi\) — the The Availability Matrix \[\Xi = \left[\left<W\right>\right] \cdot \beta^T \cdot \left[\left<H \right>\right] = \Psi \cdot \left[ \left< w H\right>\right] \]
\(\kappa\) — Net Infectiousness (NI), a vector of length \(\kappa,\) is the probability a mosquito becomes infected after blood feeding on a human in each patch. If \(X\) is the infective density of hosts, then: \[\kappa = \beta^T \cdot X\]
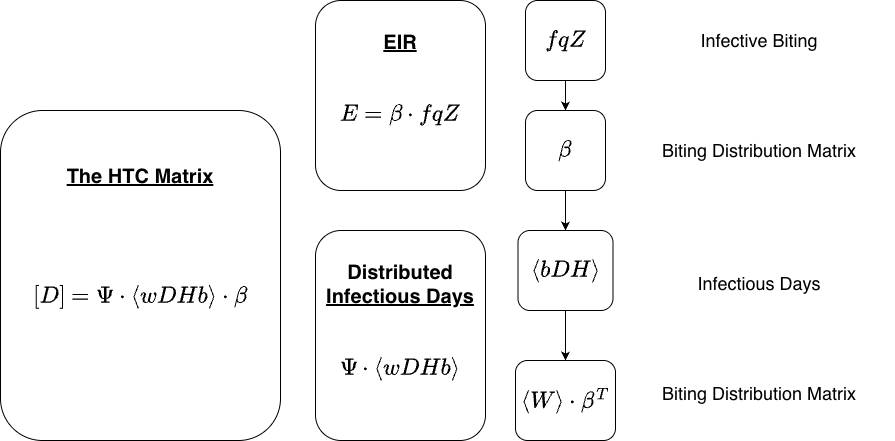
\([D]\) — the Human Transmitting Capacity Matrix is the expected number of fully infectious days in each patch caused by an infectious bite in each patch:
\[[D] = \Psi \cdot \left[\left<wH \right>\right] \cdot \left[\left<bD \right>\right] \cdot \beta = \Xi \cdot \left[\left<bD \right>\right] \cdot \beta \]