library(ramp.xds)
library(ramp.work)
Loading required package: ramp.controlLoading required package: MASSlibrary(viridisLite)Causes and Consequences of Malaria Seasonality
Why is malaria seasonal?
Dynamics with Seasonal Exposure – How does seasonal malaria exposure, a seasonally forced EIR, affect EIR-PR scaling relationships and malaria prevalence?
This vignette uses SimBA software.
library(ramp.xds)
library(ramp.work)Loading required package: ramp.controlLoading required package: MASSlibrary(viridisLite)To develop theory, we want to explore the effects of seasonality on the dynamics of malaria. To do so, we need functions with different seasonal patterns, \(S(t),\) where \[\frac{1}{365}\int_0^{365} S(t) dt = 1\]
This allows us to compare models with the same average annual EIR, denoted \(\bar E.\) Let \(E(t)\) denote the daily EIR at time \(t\): \[E(t) = \bar E \; S(t).\] In effect, \(S(t)\) is giving a weight to days of the year in a way that doesn’t change the mean.
We use the index of dispersion – the variance-to-mean ratio – as a simple way of describing the average dispersion of the seasonal pattern. The index of dispersion of the seasonal pattern is defined as \[ \left(\frac{1}{\bar E}\right)^2 \int_0^{365} \frac{(\bar E - E(t))^2}{365} dt = \int_0^{365} \frac{(1 - S(t))^2}{365} dt \]
compute_iod_S = function(S){
  S2 = function(t, mean){(1-S(t))^2}
  return(integrate(S2, 0, 365, mean=mean)$val/365)
}compute_iod_S(F_s5)[1] 0.6443799compute_iod_F = function(F){
mean = integrate(F, 0, 365)$val/365
F2 = function(t, mean){(mean-F(t))^2}
var = integrate(F2, 0, 365, mean=mean)$val/365
var/mean^2
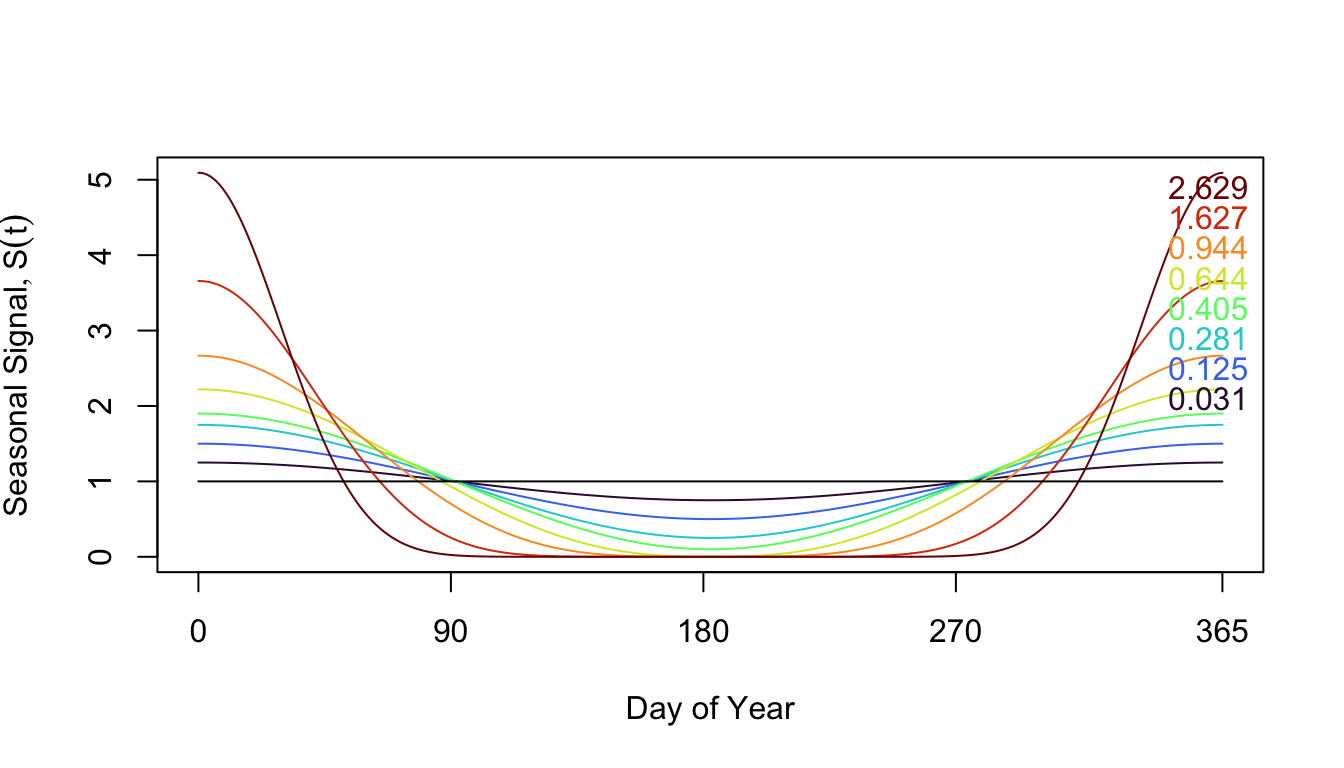
}compute_iod_F(F_s5)[1] 0.6443799Here, we plot the seasonal signal over a year:
Here we plot 8 different seasonal patterns using sinusoidal functions, and one completely non-seasonal pattern.