Quantitative Logic
Ross’s A Priori Pathometry & the Prevention of Malaria

Mathematical models are tools to help us to think carefully and quantitatively about the processes affecting malaria in populations.
In 1897, Ronald Ross found malaria parasites in mosquitoes using a light microscope [1]. The discovery earned Ross a Nobel Prize and a place in history. This essay is not about that discovery.
In the decade that followed, Ross’s career entered a new phase devoted to the prevention of malaria [2]. By 1911, Ross had developed several mathematical models of malaria [2–5].
…all epidemiology, concerned as it is with the variation of disease from time to time or from place to place, must be considered mathematically, however many variables are implicated, if it is to be considered scientifically at all. To say that a disease depends upon certain factors is not to say much, until we can also form an estimate as to how largely each factor influences the whole result. And the mathematical method of treatment is really nothing but the application of careful reasoning to the problems at issue.
Then Ross attempted to launch a new field that he called a prior pathometry.
In 1957, George Macdonald wrote:
The mathematical studies of Ross appeared an attractive approach to new explanation, but experiment showed they did not complete the picture or provide explanation…
What went wrong?
We believe that Ross had the right idea, but it would take decades of research, new mathematical models, development of inferential methods, and high-speed computing to implement that vision.
This essay is about Ross’s vision. The rest of this essay advocates for applying it to malaria, borrowing ideas and methods developed to for other ecological systems [6].
Ross and the Prevention of Malaria
Starting in 1899, Ross’s turned his attention to malaria research and prevention. In 1899, he founded a research station to study malaria [7]. In 1902, Ross published Mosquito Brigades and how to Organize Them [8]. In 1903, he developed the thick film with the goal of improving the accuracy of malaria microscopy [9].
By 1904, a large scale vector control program implemented by the British Military in Myanmar had failed, and the British Medical Journal organized a debate [10]. Ross was a respondent [11]. Despite his sharp critique of the program, it appears that debate was a turning point for Ross. Why had the program failed? The next year, he published a mathematical model analyzing some spatial aspects of mosquito control [3]. In 1907, he published a review of the successes and failures of vector control [12].
In 1908, Ross wrote a book length report on malaria control in Mauritius that included the first model of malaria transmission, a discrete-time system [4]. Ross’s model was analyzed by Waite, who used slightly different numbers and found some discrepancies [13]. Ross turned to differential equations. Ross’s work since 1899 culminated in publication of the \(2^{nd}\) edition of Prevention of Malaria, including a new mathematical model of malaria transmission [2]. Ross also published the model in Nature [14].
A few years later (during World War I), Ross started writing about the mathematical foundations for the study of infectious diseases [15,16]. He teamed up with Hilda Hudson, a mathematician from Cambridge University, and they wrote two more essays [17,18]. What Ross called a priori pathometry, we now call mathematical epidemiology.
In 1916, Ross wrote:
It is somewhat surprising that so little mathematical work should have been done on the subject of epidemics, and, indeed, on the distribution of diseases in general. Not only is the theme of immediate importance to humanity, but it is one which is fundamentally connected with numbers, while vast masses of statistics have long been awaiting proper examination.
Ross envisioned an approach to studying malaria that would use both mathematics and statistics:
The whole subject is capable of study by two distinct methods which are used in other branches of science, which are complementary of each other, and which should converge towards the same results – the a posteriori and the a priori methods. In the former we commence with observed statistics, endeavour to fit analytical laws to them, and so work backwards to the underlying cause (as done in much statistical work of the day); and in the latter we assume a knowledge of the causes, construct our differential equations on that supposition, follow up the logical consequences, and finally test the calculated results by comparing them with the observed statistics.
Ross, Macdonald, and a theory for the dynamics and control of mosquito-transmitted pathogens, led by DL Smith, is an introduction to the Ross-Macdonald model and development of basic theory for malaria written for academic audiences [5]. It is available from PLoS Pathogens
Ross’s a priori pathometry - a perspective by PEM Fine is a great essay [19], archived here. (It is behind a paywall. LMK if you can’t get access.)
Quantitative Logic
Ross advocated for using a kind of quantitative logic in an a priori approach to studying malaria using mathematics. After playing a role in developing diagnotics for malaria, Ross was interested in understanding why malaria prevalence differed from place to place. It could, perhaps, explain why larval source management had such varied outcomes [12]. Ross thought about malaria infection as a process, and he used math to describe that process.
The a priori quantitative logic involved translating some basic ideas about malaria prevalence into a mathematical models, formulated as dynamical systems. Over time, malaria prevalence would change in two ways: uninfected people would get exposed and infected; and infected people would clear infection. At any point in time, the prevalence would be a balance between exposure and recovery. Differences in prevalence among populations could be explained by differences the rates of exposure to mosquitoes.
The SIS Model
Today, we would call it an SIS compartmental model: the population is classified by infection status into one of two compartments – either infected \((I)\) or not infected and susceptible to infection \((S)\), and the total human population is in one of these two states \((H=S+I).\) In this model, people are exposed and infected at a constant rate \(h\), and infections clear at a constant rate \(r.\) The prevalence of infection, \(x = I/H\) can be described by a very simple differential equation:
\[\frac{dx}{dt}= h(1-x) - r x.\] If we wanted to estimate exposure, \(h,\) we would use this equation [20]. It could also describe the prevalence of a disease with environmental exposure, an independent happening.
If we wanted to study infectious disease dynamics, then we would typically assume that the force of infection, \(h,\) is proportional to the fraction infected, \(h = \beta x,\) so:
\[\frac{dx}{dt}= \beta x(1-x) - r x.\] Ross called an infectious process a dependent happening.
These simple dynamics are at the core of simple malaria models and a lot of basic epidemiology, so we wrote a vignette about it (The SIS Model) .
The model was described in a set of papers on a priori pathometry by Ronald Ross and Hilda Hudson [16–18].
The model was the subject of a book called Catalytic Models in Epidemiology [21].
In 1974, Pull & Grab fit a slightly modified version of this model to estimate the infant conversion rate [22].
Malaria Transmission
Ross’s simple malaria model of malaria involved infection dynamics in two host populations – humans and mosquitoes – connected by parasite transmission through blood feeding. In malaria transmission models, the susceptible members of one population are infected by infectious members of the other.
Ross’s model for malaria dynamics involved two SIS modules. Since humans recover faster than they die, the recovery parameter for the human equations is as described above. Since mosquitoes die much faster than they recover, the parameter for mosquitoes describes mosquito mortality. The process looks something like the following diagram.
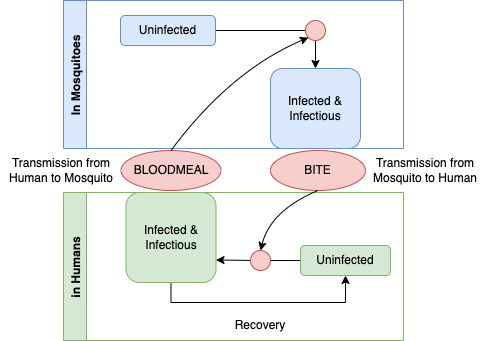
This graph is the basis for causal theory capable of describing how malaria parasites persist in populations. A student of causation might object causal graphs must be directed and acyclic, and since this graph is a cycle, it can not be causal. If we applied the logic more generally, no graph describing any organisms life cycle would be causal, and yet life is undoubtedly the cause of life. The missing element is time: a life-cycle graph would be directed and acyclic if it had an arrow that traced life in one generation giving rise to life in the next.
To understand this as a causal diagram, we must thus imagine that it describes a dynamical process in populations: mosquitoes that get infected today are biting and infecting humans at some point in future; later, those humans become infectious; humans who are infectious today are passing parasites to mosquitoes in a blood meal that infect a mosquito. Seen in this way, we can begin to develop a quantitative theory that describes all the factors that determines malaria prevalence in populations. How does malaria persist in a population? It persists through the transmission of parasites among hosts during blood feeding. What factors determine prevalence? It is a balance between the gain and loss of infection.
To write down his model, Ross made some assumptions about the process. We begin with an abstract concept of place – here. We imagine that populations here are comprised of individual mosquitoes and individual humans, and we are interested in computing the fractions of humans and mosquitoes that are infected. Since infections don’t last forever, the prevalence of infection in mosquitoes and humans reflects a balance between infections acquired through parasite transmission and the natural loss of infection through parasite clearance or host mortality. In many places, forces affecting the the balance can be changing; mosquito population density fluctuates over time, for example. Ross’s equations assumed that transmission by mosquitoes was constant over time, and they focused on local transmission, ignoring exposure elsewhere (e.g. through travel). This model thus ignores many factors that would be important for planning for control. Ross discussed all these factors, but since he was pioneering a new approach, the models were very simple.
Mosquitoes
Mosquitoes lived short lives, so the loss of parasites in mosquitoes would mainly occur through mosquito mortality:
\[\begin{equation} \mbox{MOSQUITOES} \\ \; \\ \left[ \begin{array}{rcl} \mbox{Infected Tomorrow} &=& \mbox{Infected Today} \\ &-&\mbox{Infected: Died}\\ &+&\mbox{Uninfected: Got Infected}\\ \end{array} \right] \end{equation}\]
This description of a process ignores the loss of infection in mosquitoes, and changing mosquito population density. It ignores the extrinsic incubation period (EIP), the lag between the point in time when a mosquito gets infected and when it becomes infectious. This basic description of the process does not explicitly address the process that gives rise to uninfected mosquitoes. The mathematical formulation implies, without stating it explicitly, that each dying infected mosquito gets replaced by an uninfected mosquito emerging from an aquatic habitat. Otherwise, the mosquito population would declining over time. Ross was interested in malaria transmission dynamics, so the mosquito ecology was almost invisible. Macdonald would address some of these concerns, but Aron’s & May’s equations in 1982 [23] settled many of these issues.
Humans
Humans live long lives, so parasite loss would mainly occur through natural clearance.
\[\begin{equation} \mbox{HUMANS} \\ \; \\ \left[ \begin{array}{rcl} \mbox{Infected Tomorrow} &=& \mbox{Infected Today} \;\; \\ &-& \mbox{Infected: Cleared Infection}\\ &+& \mbox{Uninfected: Got Infected}\\ \end{array} \right] \end{equation}\]
This description of the process thus ignores many aspects of human demography, including births, deaths, and migration. The model also ignores a large number of other factors, including super-infection, the complex time course of an infection, immunity, and treatment with anti-malarial drugs. (In Ross’s day, quinine was expensive and difficult to obtain, but it was sometimes used.) These issues have led to many efforts to write down equations describing malaria infection and immunity (see Malaria Epidemiology)
To describe malaria transmission and factors that determine the prevalence of malaria in human populations over time, we formulate mathematical models as dynamical systems. Ross wrote down a system of equations in 1911 [14]. The equations, using his notation, would take this form: \[ \begin{array}{rl} \frac{dz}{dt} &= k' z' (p-z) + q z\\ \frac{dz'}{dt} &= k z (p'-z') + q' z'\\ \end{array} \] where one set of equations would apply to mosquitoes, and the other to humans. Four decades later, Macdonald would recast these equations as part of an enduring synthesis.
Malariology
In 1949, a major milestone was publication of Malariology. A Comprehensive Survey of all Aspects of this Group of Diseases from a Global Standpoint, edited by Mark Boyd. It was a collection of 70 essays from 65 authors in two volumes, with 1643 pages [24].
At that point, progress in mathemtical models lagged behind. Ross’s mathematical models had been thoroughly analyzed, but there had been very little innovation. Macdonald noted that all the math done by Ross, McKendrick, Lotka, and others was based on the same simple model [25]. Macdonald has been an innovator. In 1950, Macdonald had introduced a new model to describe malaria superinfection [26]. In 1952, he published a model describing the sporozoite rate [27]: it was a synthesis of quantitative medical entomology, a field Ross had helped to launch.
The mathematical innovation continued after Macdonald. A mathematical model, developed by Klaus Dietz and Louis Molineaux for the Garki Project, had incorporated immunity into malaria models [28]. Models had been published to describe malaria dynamics with treatment, seasonality, heterogeneous biting, and spatial dynamics.
Norman TJ Bailey’s Biomathematics of Malaria (1982) was a comprehensive review of some mathematical models up to that point [29].
In 1988, malariology reached its next major milestone with publication of Malaria: Principles and Practice of Malariology, edited by Walter Wernsdorfer and Ian McGregor. It was a collection of 57 essays from 68 authors in two-volumes, with 1818 pages. It included a chapter on mathematical modeling [30].
A systematic review, published in 2013, found 388 models in 325 publications published between 1970 and 2010 [31]. The rate of publication of new models was doubling every 10 years or so.
With all this innovation and desktop computing, Ross’s simple idea has come of age. Mathematical models are now capable of describing the complexity of malaria, there is a solid evidence base, and there has been a substantial amount of work done on using dynamical systems to study real systems.
This vignettes website is about the mathematical theory. In another website, we describe a practical approach to implementing it (see RAMP & Adaptive Malaria Control).