library(ramp.xds)
library(ramp.control)An ITN Model
Modeling
We start with a basic model of malaria transmission, and we add an ITN component using the algorithm published by Le Menach A [1].
Background
Macdonald’s analysis of the sporozoite rate and his formula for \(R_0\), both published in 1952, reframed the basic understanding of mosquitoes and malaria transmission [2,3]. In 1964, Garrett-Jones isolated the mosquito-specific terms in the formula for \(R_0\) and called it vectorial capacity, intending to use it as a basis for developing theory for vector control, including the effects of insecticide resistance [4–6]. Most of this research was developed in the context of the Global Malaria Eradication Programme.
In 1987, chloroquine resistance was found in Africa, and during the 1990s, chloroquine resistance created a massive public health crisis. In 1999, African leaders called for help. The respose included a switch to artemisinin-combination therapies (ACTs) and the scale-up of insecticide-treated bed nets. Questions arose about bed net effects and effect sizes in relation to coverage, leading to a new generation of models [1,7]. Among those was a model by Arnaud Le Menach and collaborators, published in 2007 [1]. Here, we have implemented that
Setting Up the Le Menach Bed Net Model
Basic Setup
We load ramp.xds and the satellite library that implements control, ramp.control.
Next, we set up the default model:
model <- xds_setup(MYname = "SI")
model <- xds_solve(model, 3650, 3650)
model <- last_to_inits(model)
Advanced Setup
Vector control is done through advanced setup options – in a nutshell, we modify a base model.
To add a bed net model, we need to use setup_bednets. That function is simple to use, if you know what you’re doing. On encountering it for the first time, the number of options might seem confusing. The complexity was there to streamline robust analytics – what are all the reasonable ways to implement a bed net model? In a nutshell, all these bednet models have two parts:
Bed Net Coverage – bed nets get distributed; ownership and use change over time; and we need a model that describes the fraction of potential blood feeding encounters between mosquitoes and humans that are modified by the presence of a bed net. We note that this definition of coverage is slightly different from operational definitions of malaria coverage that would be used by malaria programs – there are some important human and mosquito behaviors affecting mosquito-human contact.
Bed Net Effects & Effect Sizes – we need a model that translates coverage into a model for effects or effect sizes. An effect size, herein, is defined as a factor change in potential malaria transmission.
In this case, we configure a trace function describing coverage. We pick a sharkfin function. To do this, we configure the options
cover_par <- list(trend_par = makepar_F_sharkfin(D=90))itn_mod <- setup_bednets(model,
coverage_name = "func",
coverage_opts = cover_par,
effect_sizes_name = "lemenach")tm = seq(0, 5*365, by = 5)
show_bednet_coverage(tm, itn_mod)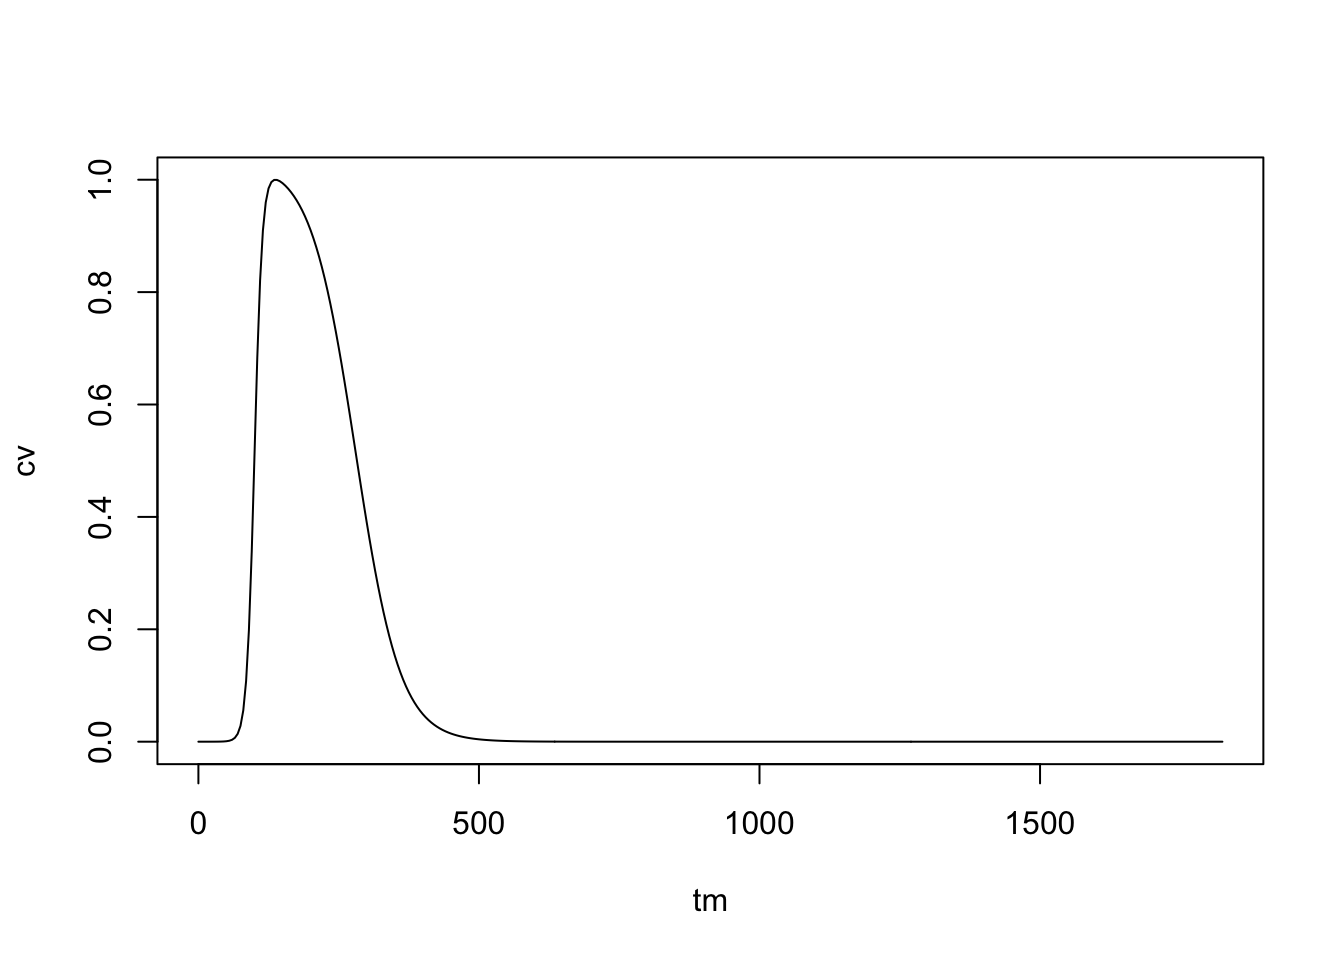
model <- xds_solve(model, 5*365, 10)
itn_mod <- xds_solve(itn_mod, 5*365, 10)xds_plot_EIR(model)
xds_plot_EIR(itn_mod, clrs = "red", add=TRUE)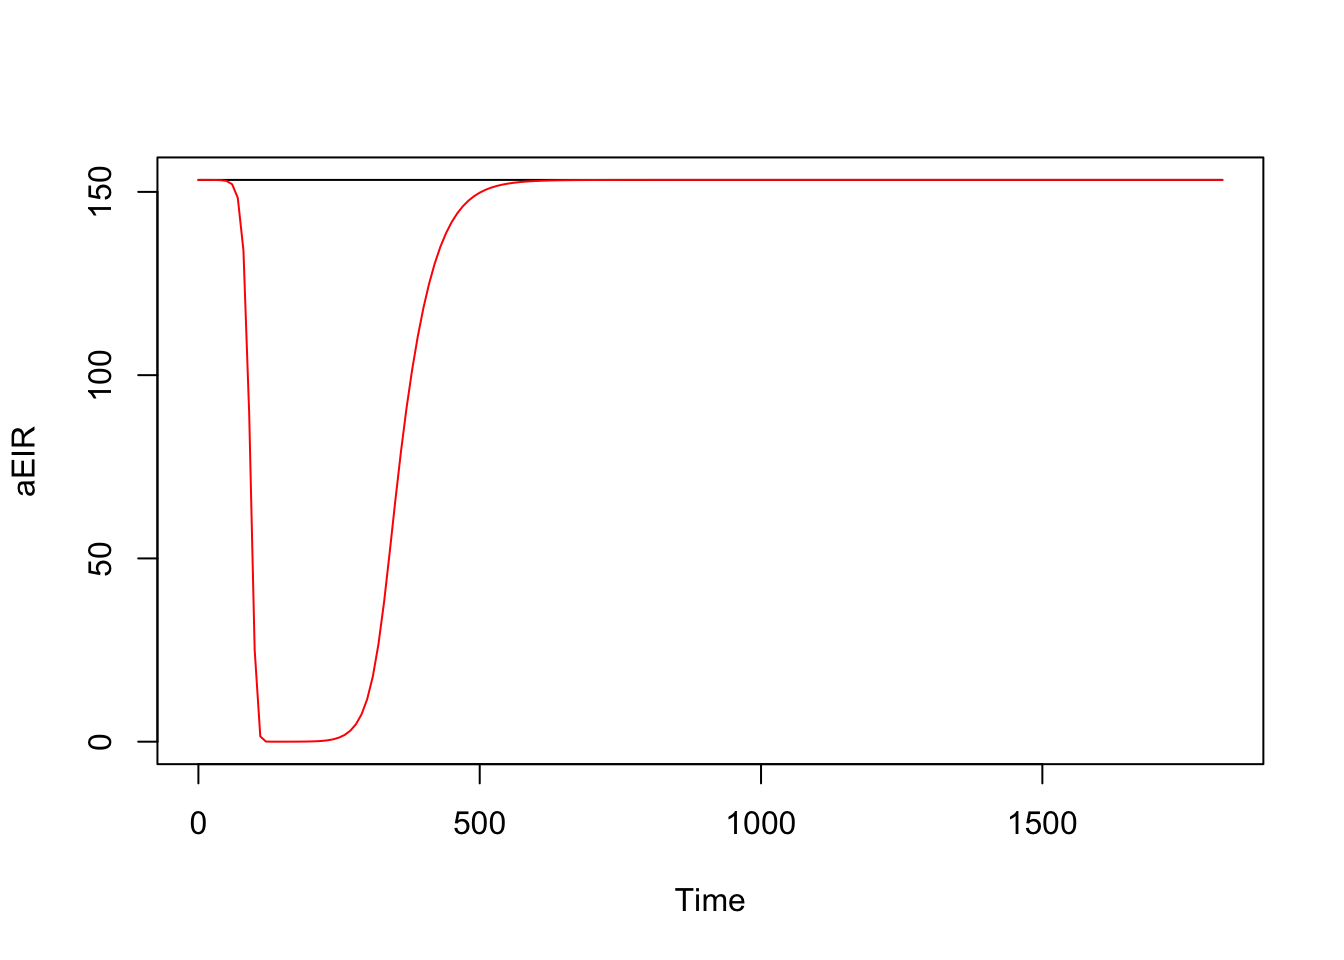
xds_plot_PR(model)
xds_plot_PR(itn_mod, clrs = "darkred", add=TRUE)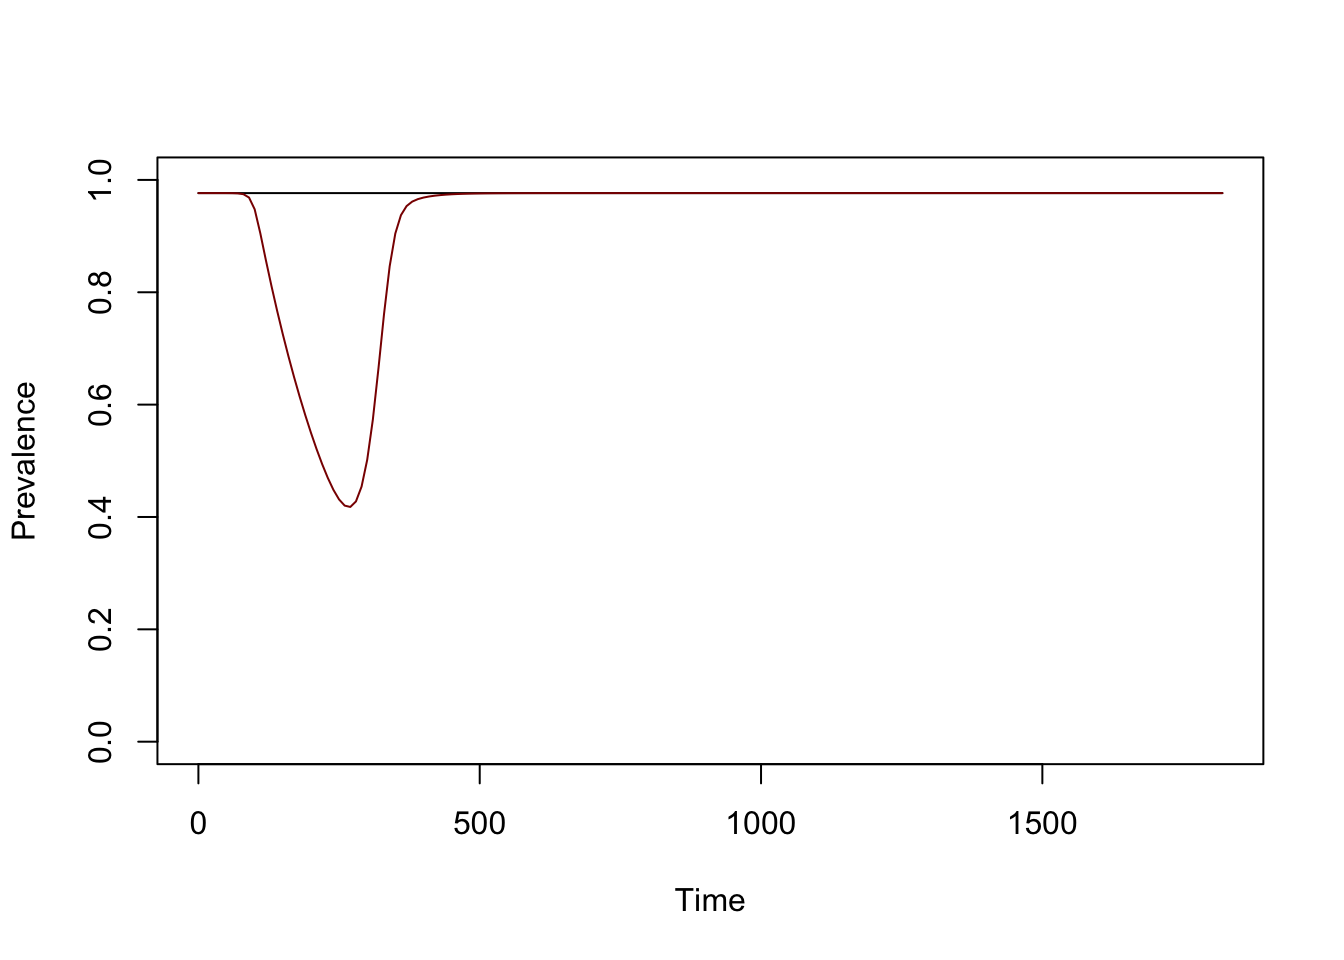
Implementation Notes
A Sharkfin
In this example, we write a function that computes bed net coverage directly. Coverage was configured as a trace function. The function family is called setup_bednet_coverage.func. The coverage function must return a value between 0 and 1, so the function chops values returned by the function to be 0 if the value returned by the function is less than 0, and 1 if the value returned is greater than 1.
In the case of bed nets, we imagine a bed net mass distribution campaign, where the nets go out over a few weeks leading to a peak in coverage, but then ITN ownership wanes as the nets are torn or discarded. To construct a smooth function, we use the sharkfin family of functions. A sharkfin is the product of two sigmoidal functions with different shape parameters – the first sigmoidal function describes the scale-up phase and the second describes the decay phase.
Visualization
Le Menach
The model developed by Le Menach et al. has been encoded in ramp.control with three functions:
BedNetEffectSizes.lemenachcalls the modelcompute_bednet_effect_sizes_lemenachcompute_bednet_effect_sizes_lemenachreturns an effect size for each bionomic parameter.
setup_bednet_effectsizes.lemenachdispatches theS3modelsetup_bednet_effectsizesand callssetup_bednet_effectsizes_lemenach.setup_bednet_effectsizes_lemenachconfigures and returns a bed net model object, with default parameters and user overwritable options.
Implementation Notes
References
1.
Le Menach A, Takala SL, McKenzie FE, Perisse A, Harris A, Flahault A, et al. An elaborated feeding cycle model for reductions in vectorial capacity of night-biting mosquitoes by insecticide-treated nets. Malar J. 2007;6: 10. doi:10.1186/1475-2875-6-10
2.
Macdonald G. The analysis of the sporozoite rate. Trop Dis Bull. 1952;49: 569–586. Available: https://www.ncbi.nlm.nih.gov/pubmed/14958825
3.
Macdonald G. The analysis of equilibrium in malaria. Trop Dis Bull. 1952;49: 813–829. Available: https://www.ncbi.nlm.nih.gov/pubmed/12995455
4.
Garrett-Jones C. Prognosis for interruption of malaria transmission through assessment of the mosquito’s vectorial capacity. Nature. 1964;204: 1173–1175. doi:10.1038/2041173a0
5.
Garrett-Jones C. The human blood index of malaria vectors in relation to epidemiological assessment. Bull World Health Organ. 1964;30: 241–261. Available: https://www.ncbi.nlm.nih.gov/pubmed/14153413
6.
Garrett-Jones C, Grab B. The assessment of insecticidal impact on the malaria mosquito’s vectorial capacity, from data on the proportion of parous females. Bull World Health Organ. 1964;31: 71–86. Available: http://www.ncbi.nlm.nih.gov/entrez/query.fcgi?cmd=Retrieve&db=PubMed&dopt=Citation&list_uids=14230896
7.
Smith DL, Hay SI, Noor AM, Snow RW. Predicting changing malaria risk after expanded insecticide-treated net coverage in Africa. Trends Parasitol. 2009;25: 511–516. doi:10.1016/j.pt.2009.08.002