6 Survey Helper
You will almost certainly not want to endure the tedium required to survey all the frogs in all the ponds and tanks for every study you conduct. Fortunately, you have a devoted and efficient helper who will do the surveys for you. Select the Plot Histograms tab in the Analyses pane. This pane shows histograms revealing the total number of four- and five-legged frogs in every pond and tank.
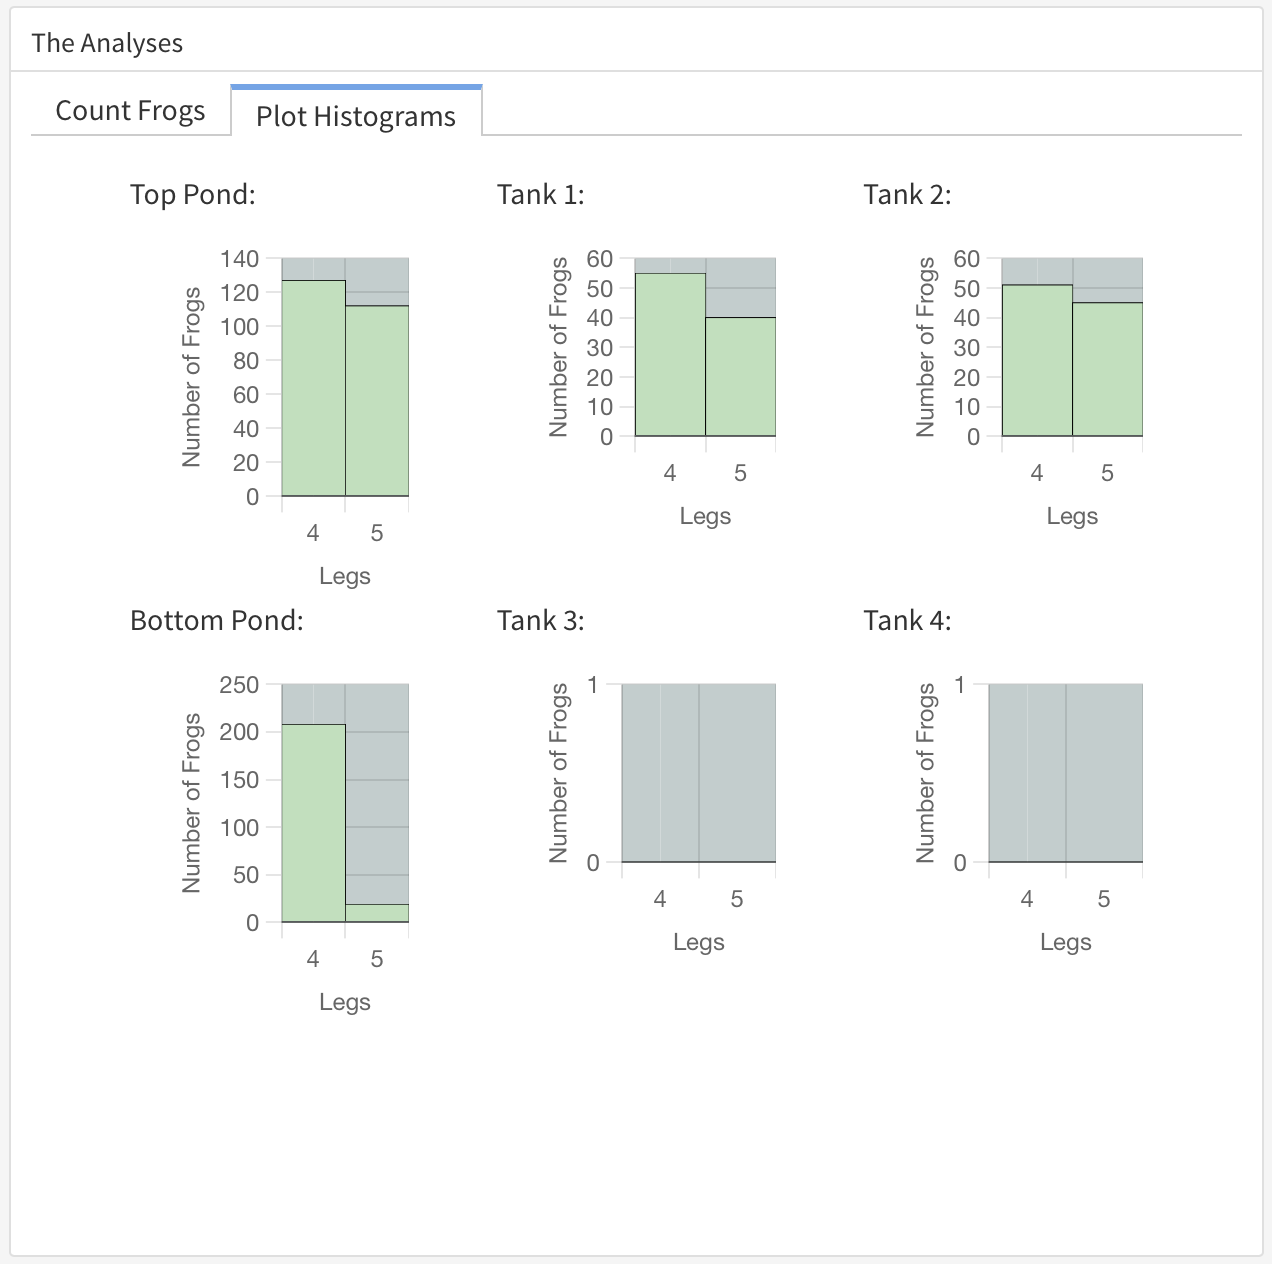
The histograms update in real time as the simulation runs. Note that the updates may change the scale for the vertical axis.
Please don’t be too upset that I let you sort and count a whole lot of frogs by hand before telling you about the histograms! Having practiced collecting data yourself has given you a deeper appreciation for what the bars in the histograms mean—and why these graphs are useful.