Appendix B Study Designs

Doing science means collecting data to test hypotheses. Imagine that you are playing with a FrogPond simulation and have found a higher frequency of deformed frogs in Top Pond than in Bottom Pond. This appendix explores a few of the strategies you might use to test the hypothesis that the deformities are caused by parasitic worms.

This hypothesis—that the variation in number of legs is environmental—is described in Chapter 3 — Kinds of Variation. If this hypothesis is correct, data on a sample of frogs might look like this:

A dot graph. Vertical axis is Phenotype, with values 4 legs and 5 legs. Each value is illustrated with a cartoon frog. Horizontal axis is Environment, with values No worms and Worms. Each value is illustrated with a cartoon tadpole. The tadpole illustrating the Worms value has an orange dot on it. The field of the graph has two dots, one for each value on the Environment axis. The dot for No worms indicates a phenotype of 4 legs. The dot for Worms indicates a phenotype of 5 legs.
When the variation in leg number is environmental, individuals that get infected with worms as tadpoles grow five legs. All other individuals grow four legs.

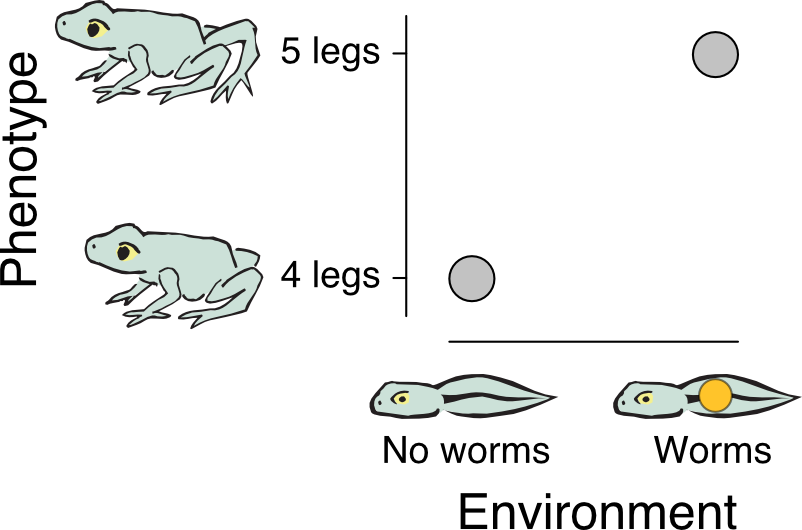
Keep in mind, however, that there are other possibilities—also described in Chapter 3.

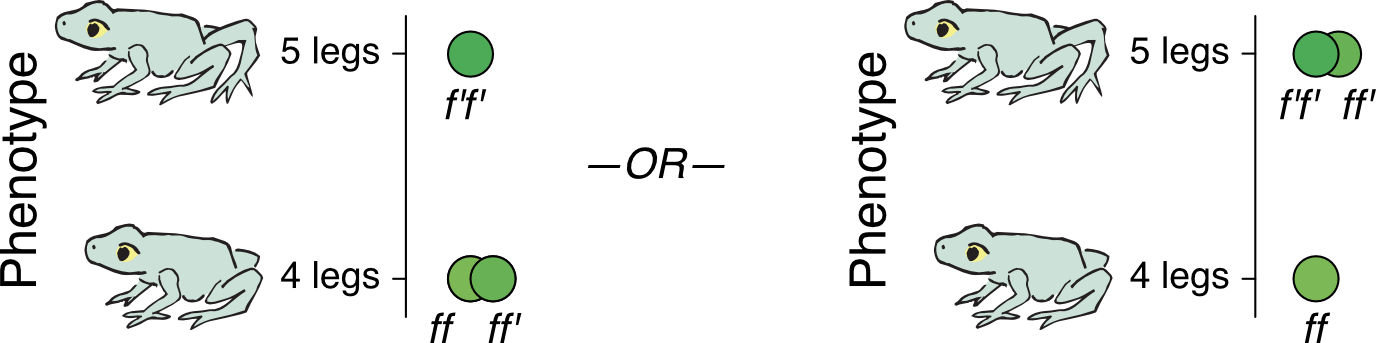
Under the hypothesis that the variation in number of legs is genetic, data on a sample of frogs might look like this:

A pair of dot graphs side-by-side, both with the same axes. Vertical axis is Phenotype, with values 4 legs and 5 legs. Each value is illustrated with a cartoon frog. There is no horizontal axis. Each graph has three dots, labeled f f, f f-prime, and f-prime f-prime. In the first graph, the f f and f f-prime dots indicate a phenotype of 4 legs and the f-prime f-prime dot indicates a phentype of 5 legs. In the second graph, the the f f dot indicates a phenotype of 4 legs and the f f-prime and f-prime f-prime dots indicate a phentype of 5 legs.
When the variation in leg number is genetic, individuals that inherit two copies of a deleterious allele (left)—or one or two copies (right)—develop five legs. All other individuals grow four legs.

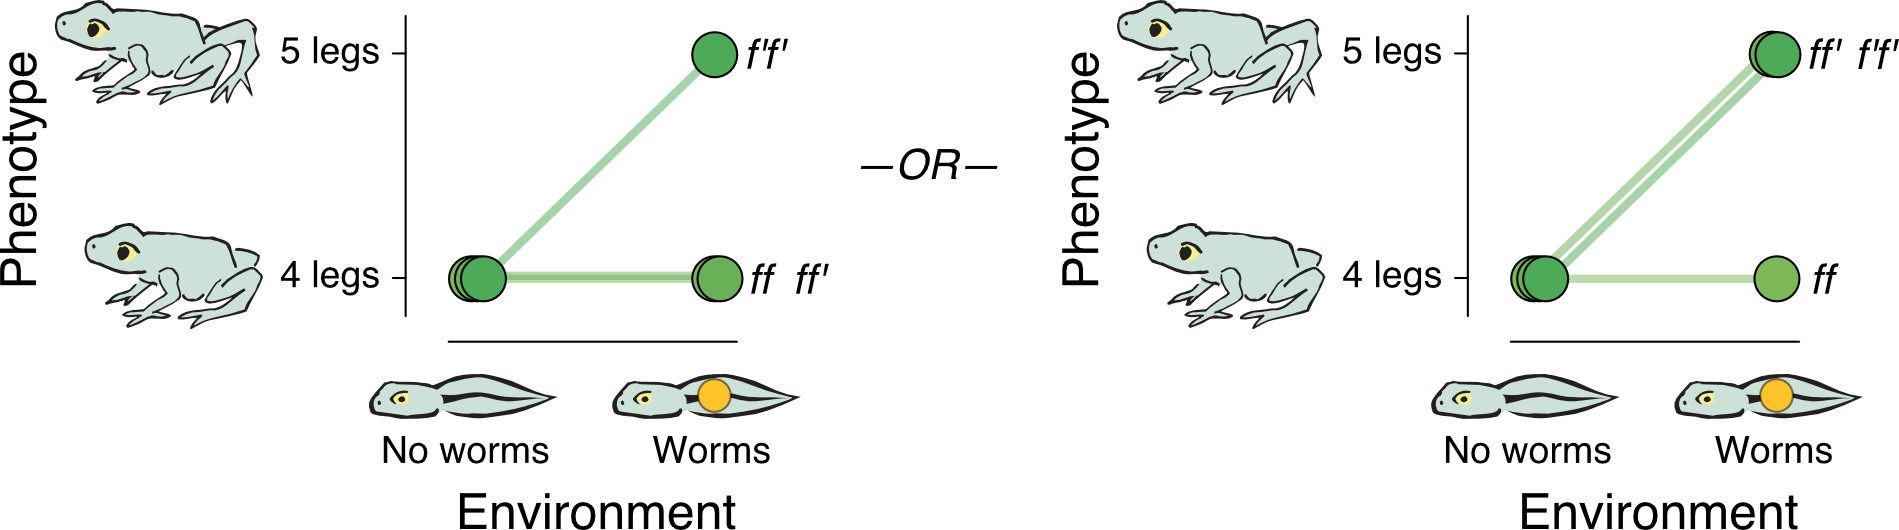
Under the hypothesis that variation in leg number is the result of genotype-by-environment interaction, data on a sample of frogs might look like this:

A pair of reaction norm graphs side-by-side, both with the same axes. Vertical axis is Phenotype, with values 4 legs and 5 legs. Each value is illustrated with a cartoon frog. Horizontal axis is Environment, with values No worms and Worms. Each value is illustrated with a cartoon tadpole. The tadpole illustrating the Worms value has an orange dot on it. The field of the graph has three pairs of dots, labeled f f, f f-prime, and f-prime f-prime. One dot in each pair is above the No worms value on the enviroment axis and the other is above the Worms value. The dots in each pair are connected by line segments. In the first graph, dot pairs ff and f f-prime indicate a phenotype of 4 legs in the No worms environment and a phenotype of 4 legs in the Worms environment, while the dot pair f-prime f-prime indicates a phenotype of 4 legs in the no worms environment and 5 legs in the worms environment. In the second graph, dot pair ff indicates a phenotype of 4 legs in the No worms environment and a phenotype of 4 legs in the Worms environment, while the dot pairs f f-prime and f-prime f-prime indicate a phenotype of 4 legs in the no worms environment and 5 legs in the worms environment.
When the variation in leg number results from genotype-by-environment interaction, individuals that inherit two copies of a deleterious allele (left)—or one or two copies (right)—AND acquire worms as tadpoles develop five legs. All other individuals grow four legs.

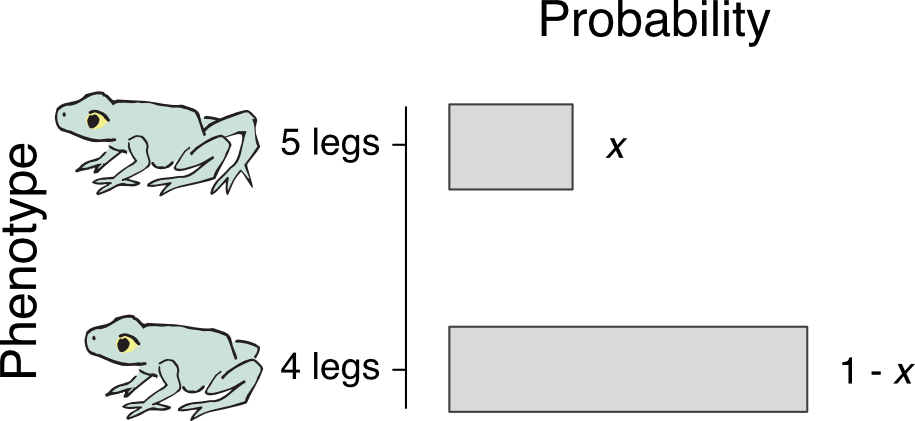
And, finally, under the hypothesis that the variation in leg number is the result of random chance, data on a sample of frogs might look like this:

A horizontal bar chart. Vertical axis is Phenotype, with values 4 legs and 5 legs. Each value is illustrated with a cartoon frog. Horizontal axis is Probability. A short grey bar for the 5-legs phenotype is labeled x. A long gray bar for the 4-legs phenotype is labeled 1-x.
When the variation in leg number results from chance, every individual has probability x of growing five legs and probability 1 - x of growing four.