5 Guiding Question One
Is there a higher (or lower) frequency of deformed frogs in Top Pond than in Bottom Pond?
The frequency of deformed frogs is their proportional representation in the pond. If six out of ten frogs have an extra leg, then the frequency of deformed frogs is 6 / 10 = 0.6, or 60%.
To answer Question 1, survey the frogs. Start with Top Pond. Pick a frog at random and examine it. If it is deformed (has five legs), drag it to the upper left tank (Tank 1). If it is normal (has four legs), drag it to the upper right tank (Tank 2). Now look at the pane labeled The Analyses. Make sure the Count Frogs tab is selected. This tab has a counter for each pond and tank.
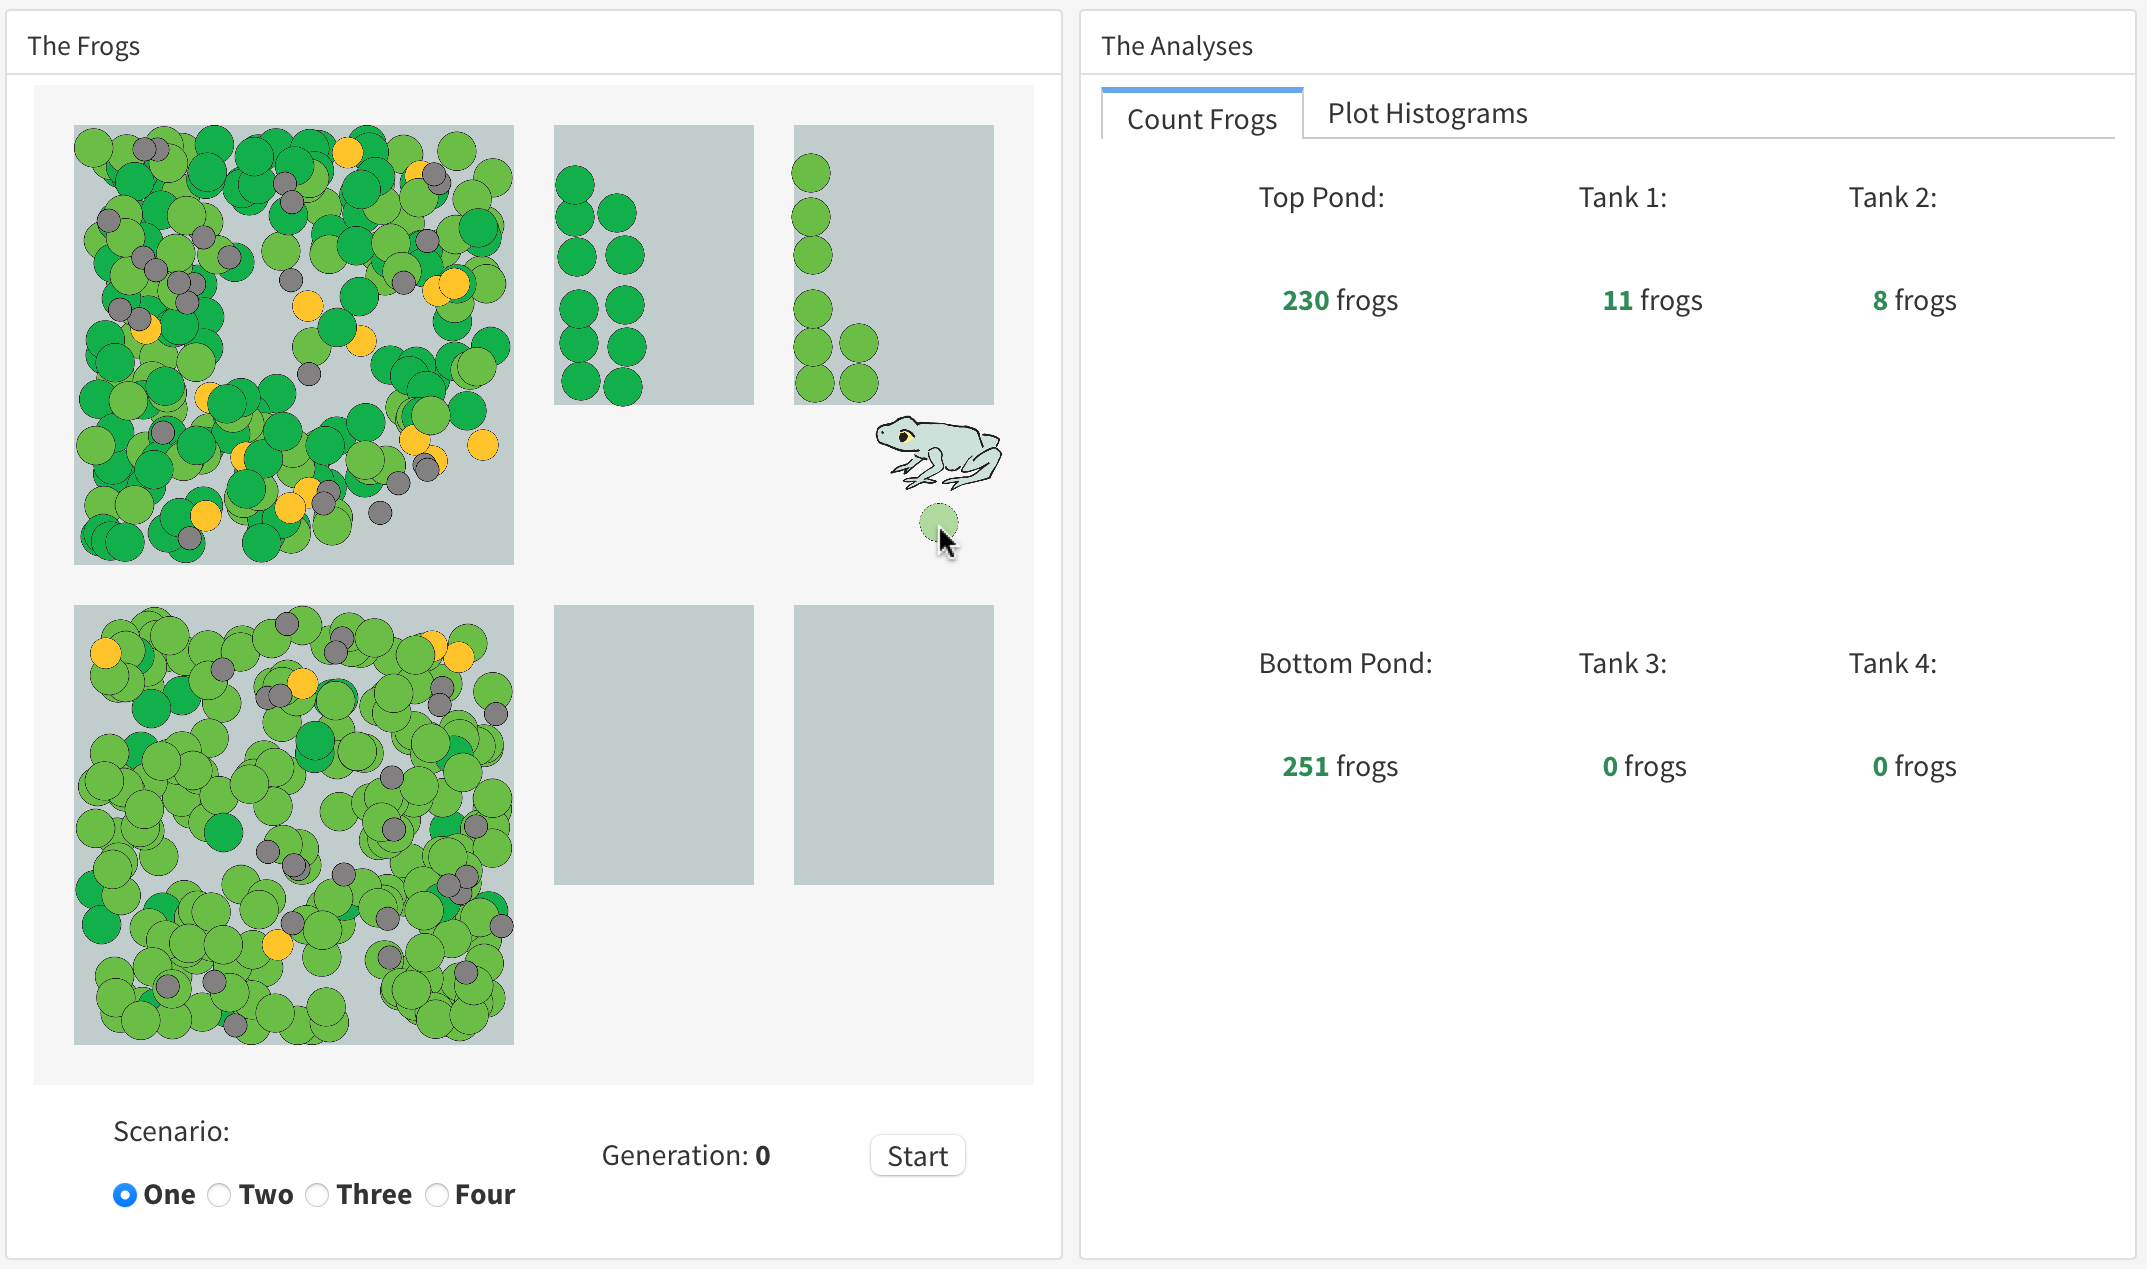
After you have sorted a bunch of frogs, take the number of deformed frogs and divide it by the total number of deformed + normal frogs in Tanks 1 & 2. That will give you an estimate of the frequency of deformed frogs in Top Pond.
- Record your data and your calculations on the FrogPond worksheet.
Sorting the entire population would be tedious. How many frogs do you think you need to survey to get a reasonably accurate estimate of the frequency of deformities? If you’re interested in exploring this question in some detail, see Appendix A - Confidence Intervals.
After you have an estimate you are comfortable with for Top pond, survey Bottom Pond. Record your data and calculations on the worksheet.
Depending on the scenario, there may not be much difference in the frequency of deformity in Top versus Bottom Pond. Any apparent difference may be mostly due to chance—that is, luck-of-the-draw in the frogs you happened to survey. Do you think this is the case? Or is there really a difference between the frequency of deformity in Top versus Bottom Pond?
- Do you think the true frequency of deformity is substantially different between the two ponds?
When finished with your survey, you can return the frogs to their ponds (see under Chapter 1 - Frogs in a Pond).
If you think any apparent difference in the rate of deformity is just due to chance, your investigation is complete. Deformity just happens, and every frog has the same risk of growing an extra leg. Try a different scenario.
If you think there really is a substantial difference between Top versus Bottom Pond in the frequency of five-legged frogs, proceed to Guiding Question 2 (but first read Chapter 6—Survey Helper).