B.3 Other hypotheses
The hypothesis that leg number variation is genetic may seem rather harder to test than the hypothesis that the variation is environmental. You may not feel like you have enough information—because you can’t tell a frog’s genotype by looking at it. This is one reason I suggested that you start your investigation by testing the hypothesis that deformity is caused by worms.
Despite not knowing genotypes, you are in possession of a useful fact. I am assuming that you’ve found a difference in the frequency of five legs between Top versus Bottom Pond. If the variation in leg number is genetic, then the pond with the higher frequency of five-legged frogs must also have a higher frequency of the genetic variant responsible. If you pick frogs at random and move them elsewhere, they will bring their copies of the variant with them. And they will transmit the variant to their offspring. When reared in a parasite-free laboratory environment, frogs descended from the high-frequency population will still exhibit a higher frequency of deformity versus frogs descended from the low-frequency population.
You can perform a common garden experiment in FrogPond. Move a random sample of frogs from Top Pond to Tank 1 and a random sample of frogs from Bottom pond to Tank 3. Make sure both tanks are free of free-swimming parasites. Run the simulation until the Generation counter changes twice (for example, from 0 to 2). This is more than enough time for all the original frogs to be replaced by their descendants. If deformity is caused by a genetic mutation, the difference in the rate of deformity between Top versus Bottom Ponds should still be evident between Tank 1 versus Tank 2.
You might organize the data from a common garden experiment like this:
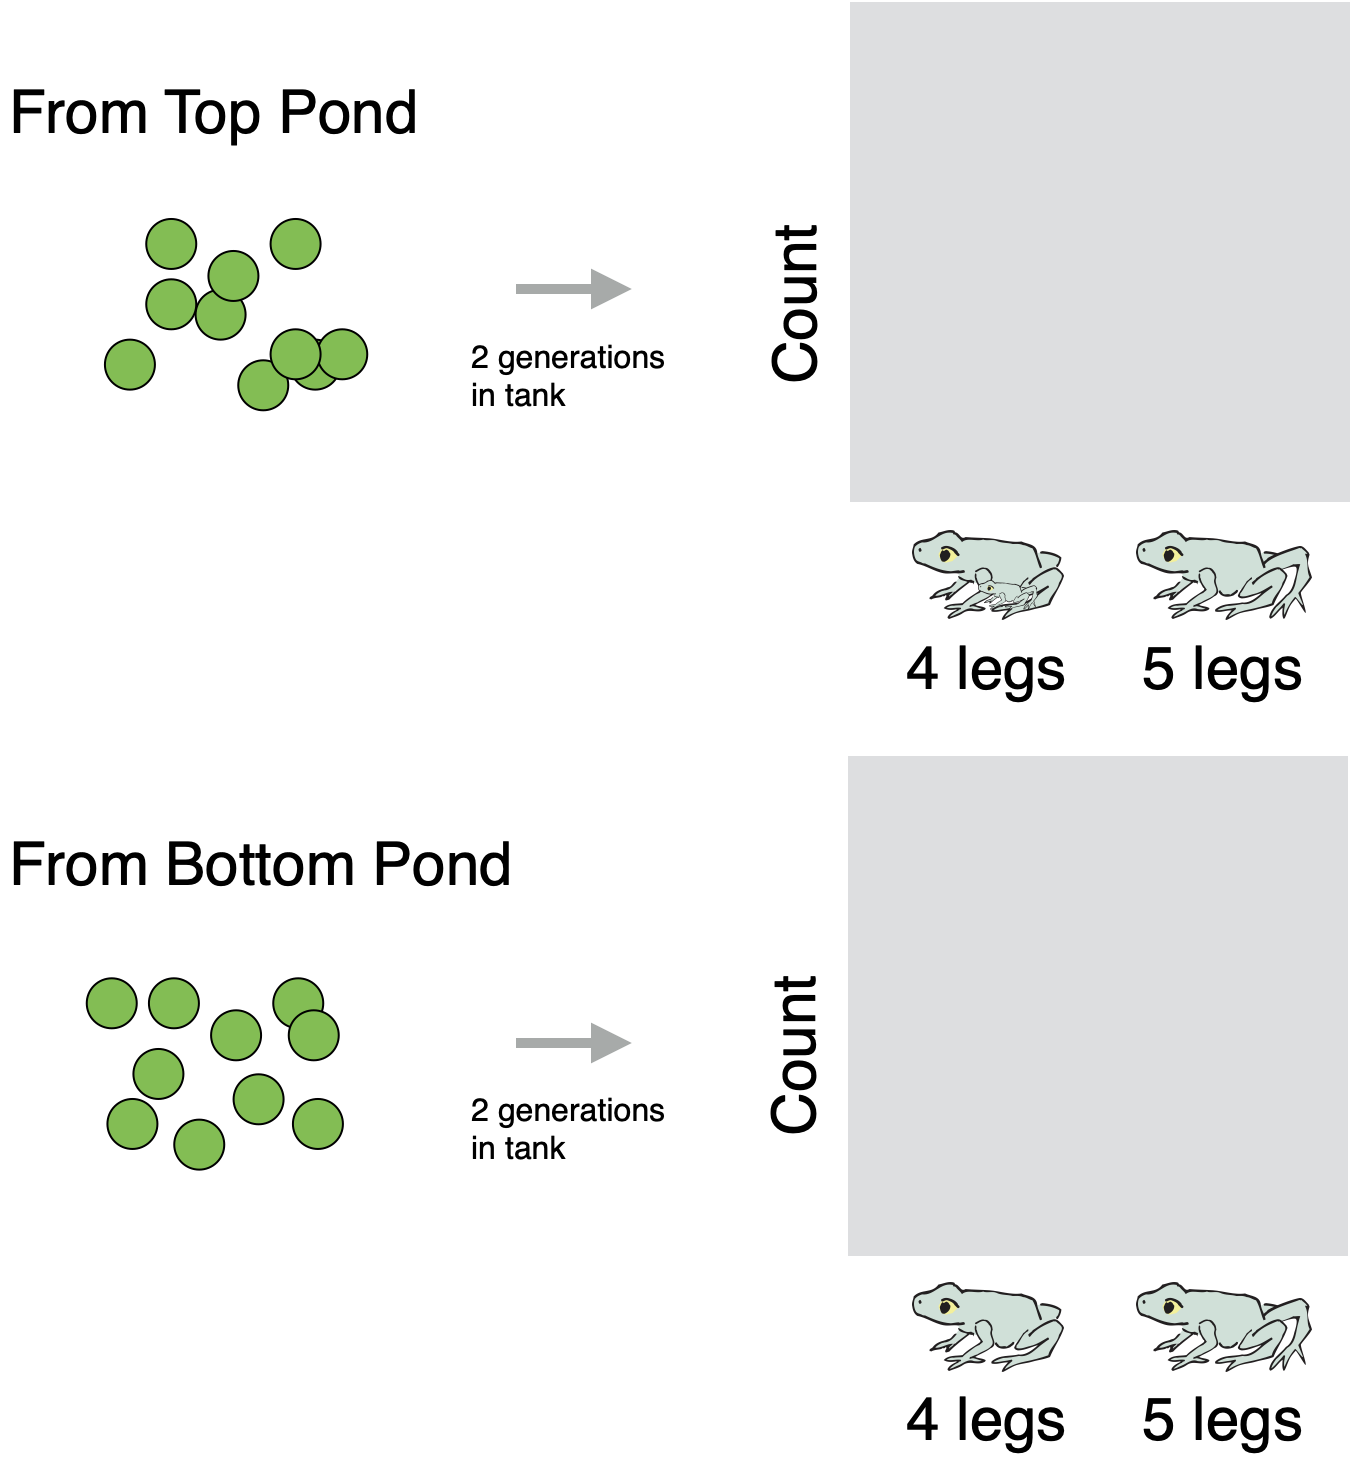
Sketch graphs showing the pattern in the data if the environmental variation hypothesis is correct and if it is incorrect.
There are other ways to test the hypothesis that differences in leg number are due to genetic variation. If the hypothesis is true, you should be able to create pure-breeding populations of four-legged frogs and pure-breeding populations of five-legged frogs. Once you have them, you can mate individuals of known genotype. Can you figure out of the two possible tables of genotypes and phenotypes—see Section 3.2—is correct ?
The hypothesis that variation in leg count reflects genotype-by-environment interaction is even more challenging to test. I’ll leave it to you to work out how, but will note that I gave you a useful hint in Section 3.3. In the g-by-e interaction scenario in FrogPond, the difference between ponds in the frequency of five legs is due to both a difference in the density of worms and a difference in the frequency of the f’ allele. Once you’ve identified the scenario in which there is genotype-by-environment interaction, can you figure out which genotypes are a susceptible to deformity?