
A collaboration: ![]()
![]()
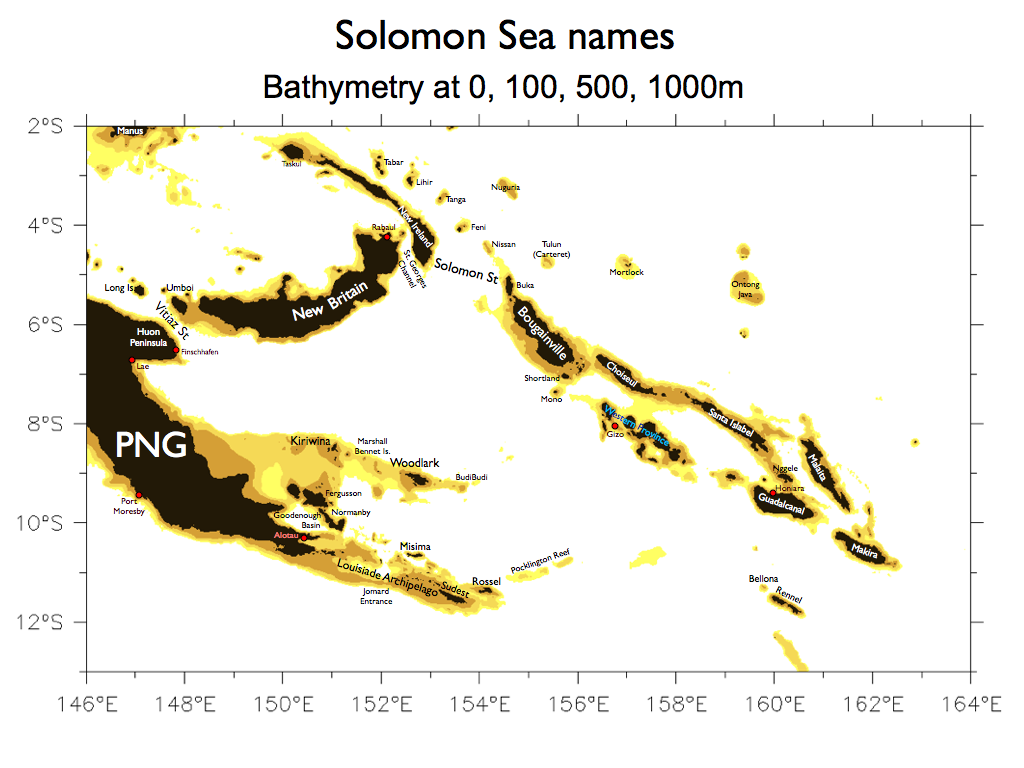
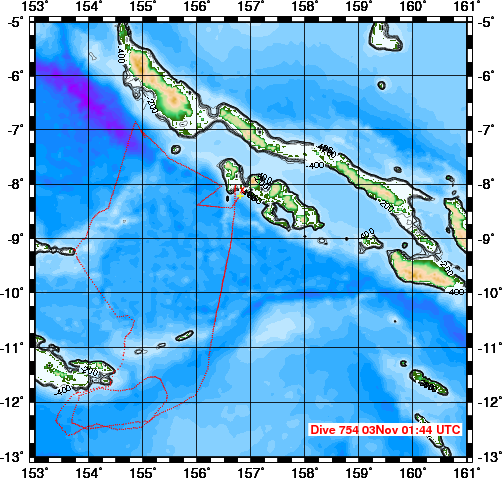
The at-sea operations could not have been done without the assistance of Solomon Islanders Danny Kennedy of DiveGizo, Chanel Iroi of the Solomon Islands Meteorological Service, and the boat crews of the Regional Assistance Mission to the Solomon Islands (RAMSI). This assistance is gratefully acknowledged.
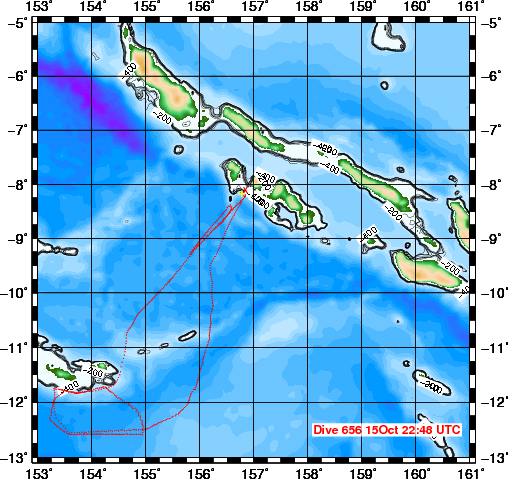
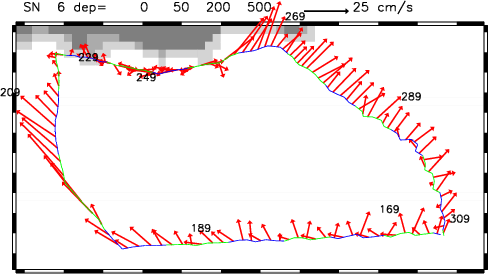
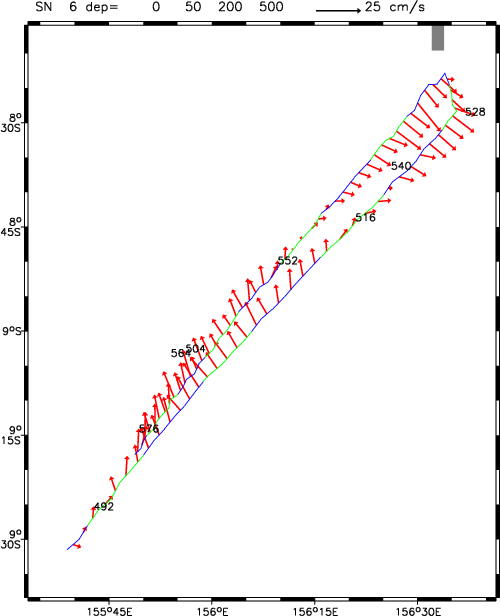
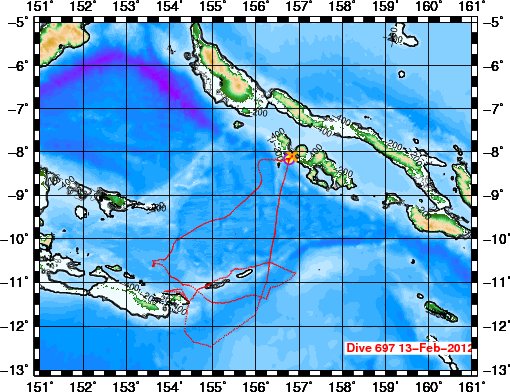
The plots are organized by mission (latest at bottom). Later sections often include plots showing results from earlier missions overlaid.
Jump down to particular missions:
| 1st | Solomon Sea transect (SN6 | = 078006 | 18 Aug 07 - | 6 Nov 07) |
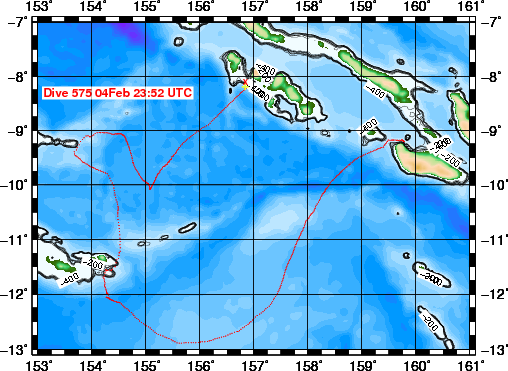
| 2nd | Solomon Sea transect (SN18 | = 07B018 | 14 Nov 07 - | 4 Feb 08) |
| 3rd | Solomon Sea transect (SN1 | = 082001 | 27 Feb 08 - | 18 Jul 08) |
| 4th | Solomon Sea transect (SN6 | = 087006 | 4 Jul 08 - | 15 Oct 08) |
| 5th | Solomon Sea transect (SN18 | = 08B018 | 10 Nov 08 - | 2 Feb 09) |
| 6th | Solomon Sea transect (SN1 | = 097001 | 13 Jul 09 - | 1 Nov 09) |
| 7th | Solomon Sea transect (SN6 | = 097006 | 13 Jul 09 - | 31 Oct 09) |
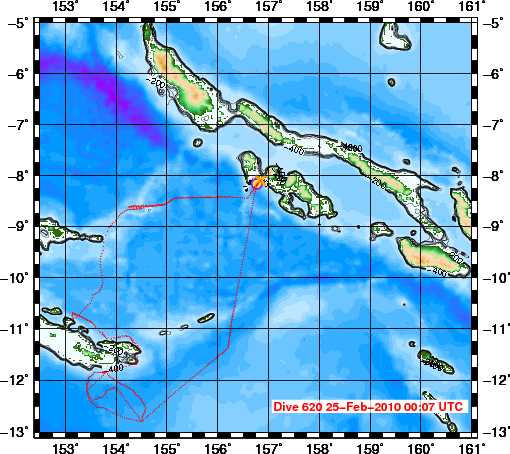
| 8th | Solomon Sea transect (SN18 | = 09B018 | 7 Nov 09 - | 24 Feb 10) |
| 9th | Solomon Sea transect (SN42 | = 104042 | 19 Apr 10 - | 28 Jan 11) |
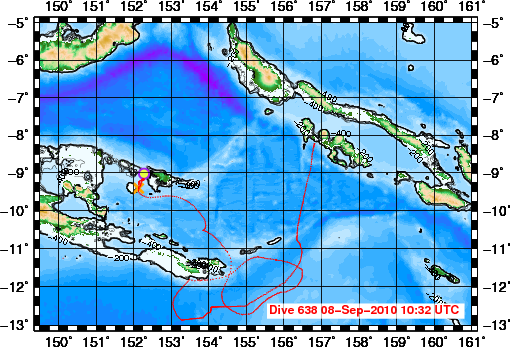
| 10th | Solomon Sea transect (SN43 | = 104043 | 19 Apr 10 - | 9 Sep 10) |
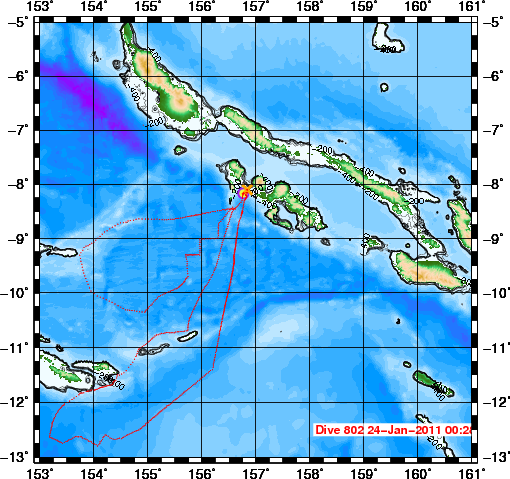
| 11th | Solomon Sea transect (SN1 | = 109001 | 28 Sep 10 - | 24 Jan 11) |
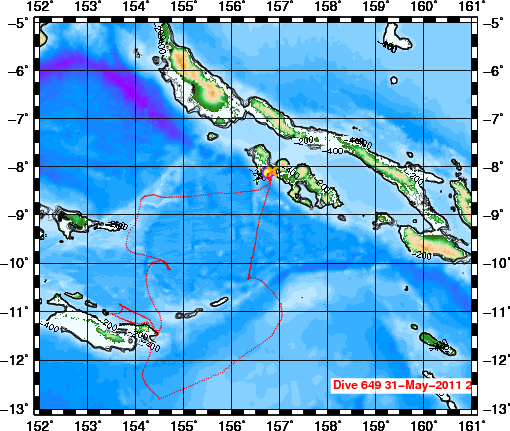
| 12th | Solomon Sea transect (SN27 | = 111027 | 31 Jan 11 - | 31 May 11) |
| 13th | Solomon Sea transect (SN18 | = 113018 | 31 Mar 11 - | 12 Jul 11) |
| 14th | Solomon Sea transect (SN6 | = 117006 | 10 Jul 11 - | 12 Aug 11) |
| 15th | Solomon Sea transect (SN43 | = 117043 | 27 Jul 11 - | 8 Dec 11) |
| 16th | Solomon Sea transect (SN1 | = 11A001 | 12 Oct 11 - | 13 Feb 12) |
| 17th | Solomon Sea transect (SN42 | = 11C042 | 7 Dec 11 - | 19 Apr 12) |
| 18th | Solomon Sea transect (SN27 | = 124027 | 19 Apr 12 - | 16 Aug 12) |
| 19th | Solomon Sea transect (SN18 | = 126018 | 01 Jun 12 - | 24 Oct 12) |
| 20th | Solomon Sea transect (SN53 | = 12A053 | 10 Oct 12 - | 20 Feb 13) |
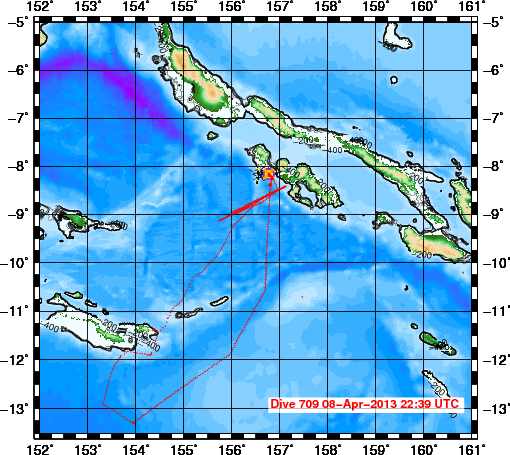
| 21th | Solomon Sea transect (SN6 | = 12C006 | 3 Dec 12 - | 8 Apr 13) |
| 22th | Solomon Sea transect (SN43 | = 135043 | 14 May 13 - | 1 Sep 13) |
| 23th | Solomon Sea transect (SN42 | = 137042 | 4 Aug 13 - | 14 Nov 13) |
| 24th | Solomon Sea transect (SN27 | = 137042 | 29 Sep 13 - | 19 Dec 13) |
| 25th | Solomon Sea transect (SN1 | = 13B001 | 22 Nov 13 - | 26 Feb 14) |
| 26th | Solomon Sea transect (SN53 | = 143053 | 29 Mar 14 - | 14 Aug 14) |
| 27th | Solomon Sea transect (SN18 | = 146018 | 5 Jun 14 - | 21 Sep 14) |
| 28th | Solomon Sea transect (SN43 | = 149043 | 26 Sep 14 - | ) |
Talk at the UW, 24 Oct 2007 (6.2Mb pdf file)
Poster at the Fall AGU meeting, Dec 2007 (3.3Mb pdf file)
Other relevant pages:
Complete track map from Scripps
Complete track map from Scripps
Complete track map from Scripps
Complete track map from Scripps
Complete track map from Scripps
Complete track map from Scripps
Complete track map from Scripps
Complete track map from Scripps
Complete track map from Scripps
Complete track map from Scripps
Complete track map from Scripps
Complete track map from Scripps
Complete track map from Scripps
Complete track map from Scripps
Complete track map from Scripps
Complete track map from Scripps
Complete track map from Scripps
Complete track map from Scripps
Complete track map from Scripps
Complete track map from Scripps
Complete track map from Scripps
Complete track map from Scripps (while sn43 is in the water)
Complete track map from Scripps
Complete track map from Scripps (while sn27 is in the water)
Complete track map from Scripps (while sn1 is in the water)
Complete track map from Scripps (while sn53 is in the water)
Complete track map from Scripps (while sn18 is in the water)
Complete track map from Scripps (while sn43 is in the water)
Related pages:
 |
Dr. William S. Kessler
NOAA / PMEL / OCRD 7600 Sand Point Way NE Seattle WA 98115 USA |
Tel: 206-526-6221
Fax: 206-526-6744 E-mail: william.s.kessler@noaa.gov |
| See also: | Kessler home page Kessler publications PMEL home page Privacy notice | |