Ekman and Rossby calculations on the Solomon Sea
Linear explorations with merged CCMP/ASCAT winds (1987-2013)...
Related pages:
Note: Monthly-mean winds were constructed from original daily files.
CCMP winds were available from July 1987 to June 2011, ASCAT winds from April 2009 to December 2013. For the overlap period, a simple average was made.
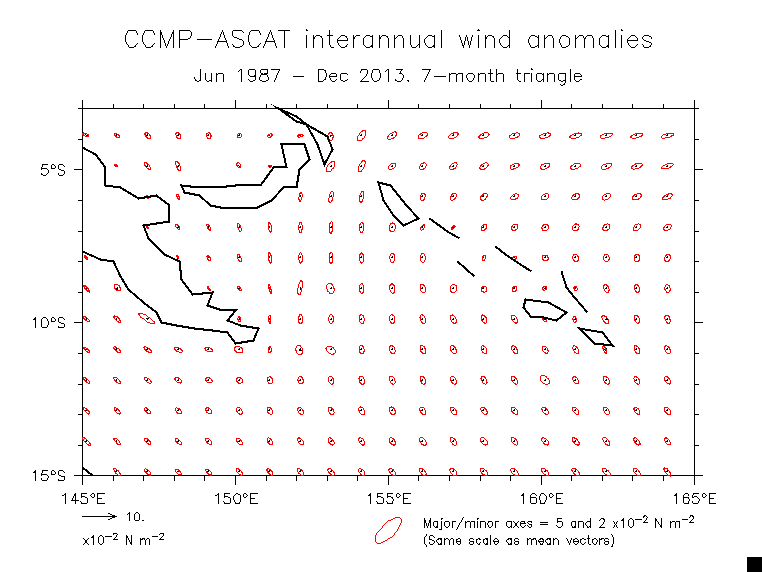
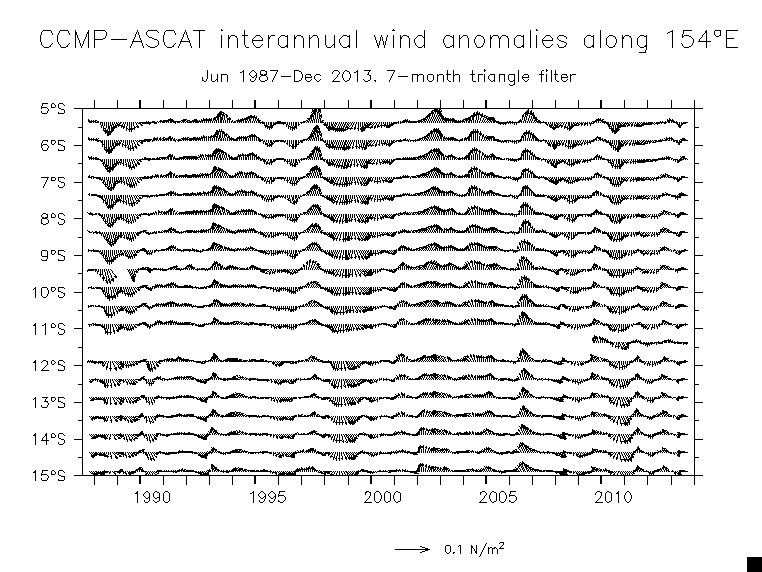
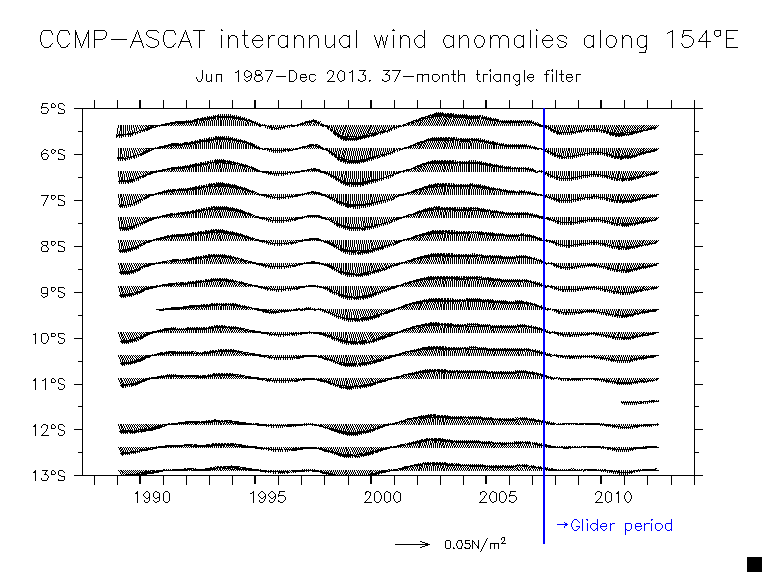
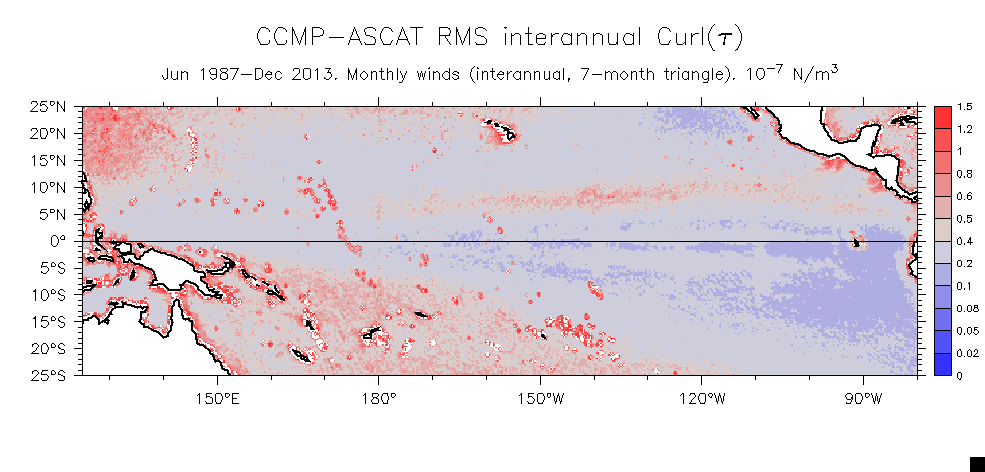
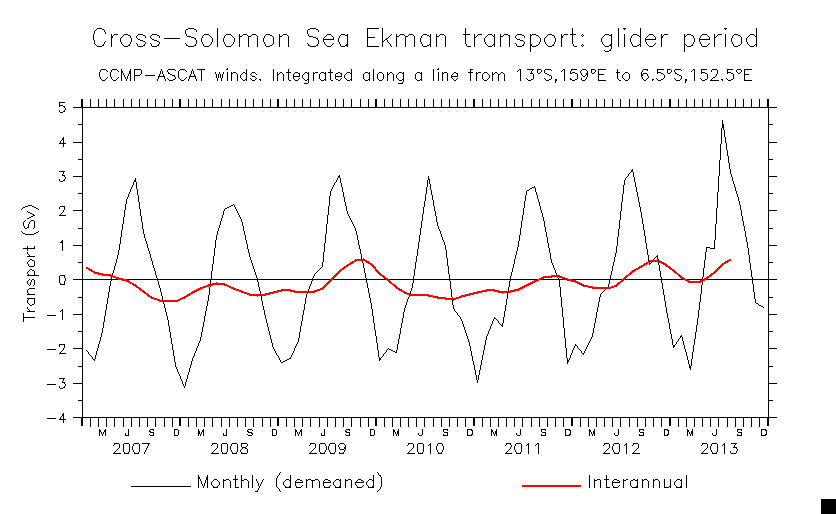
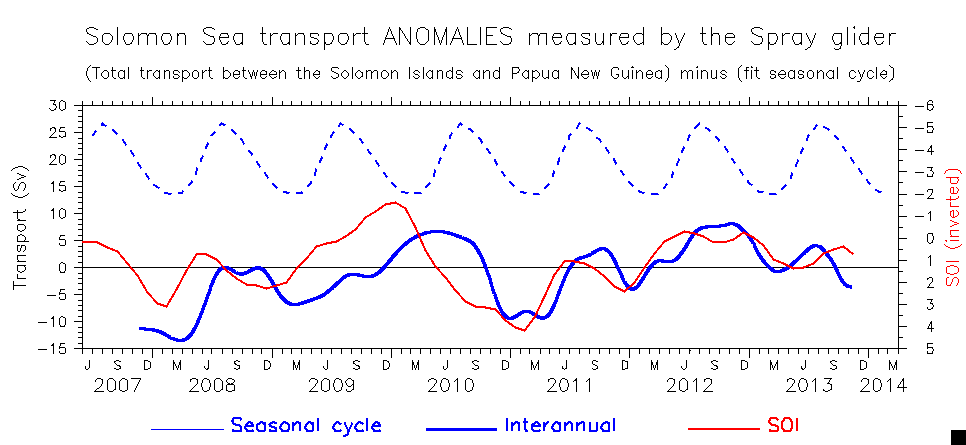
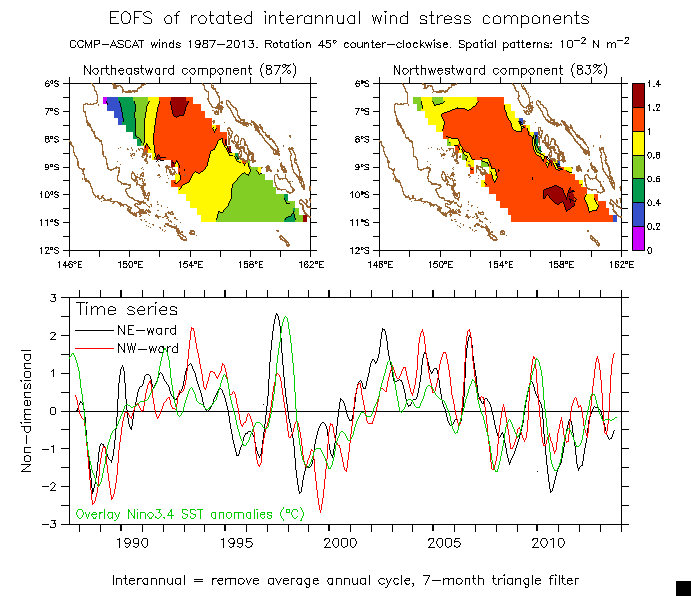
"Interannual" means the average annual cycle was removed, and the residual smoothed with a 7-month triangle filter.
- Mean solution (from Qiu et al 2010)
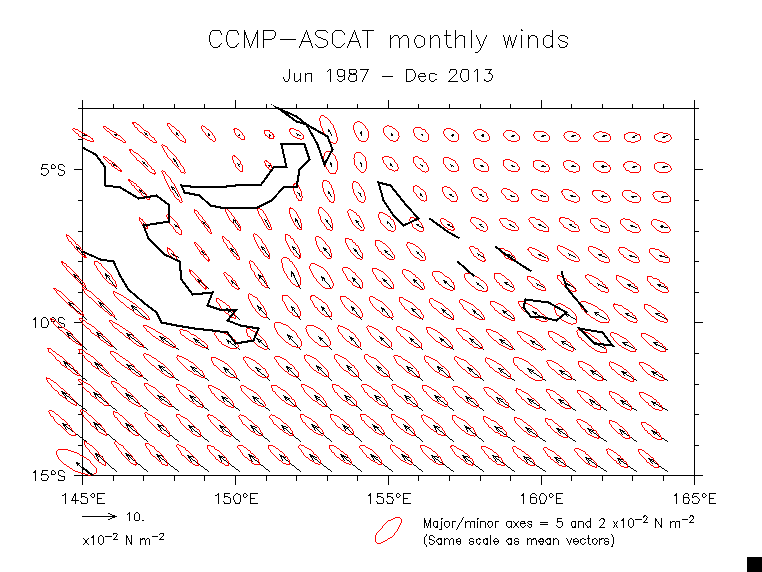
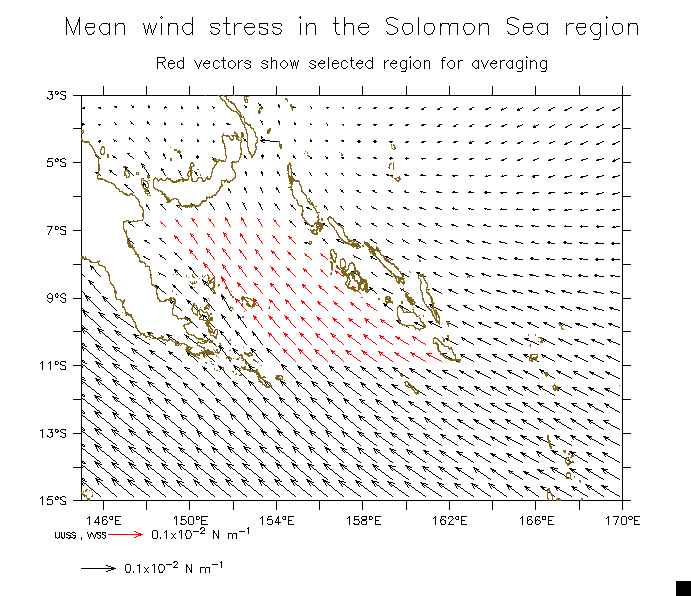
- Wind mean vectors and variance ellipses in frequency bands (Solomon Sea region)
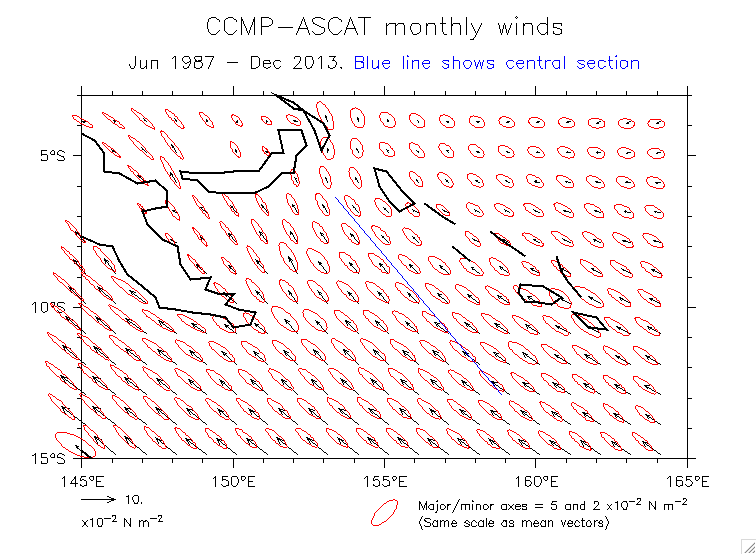
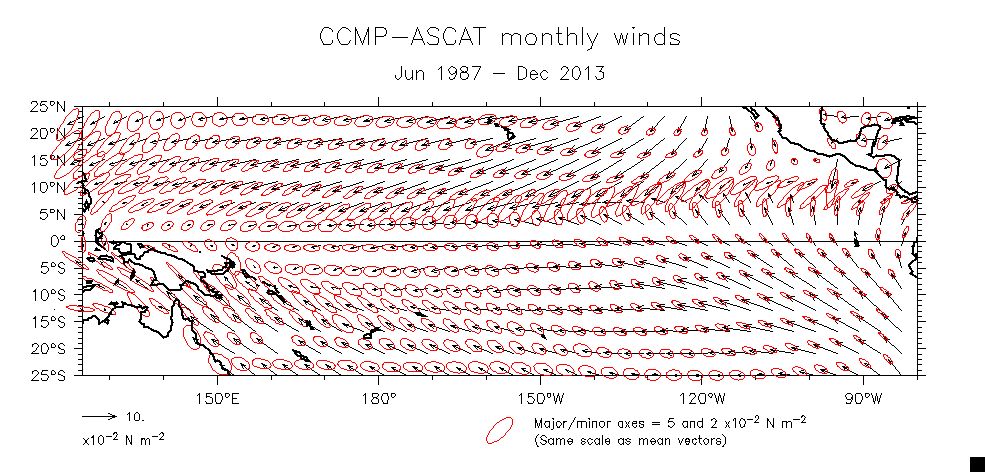
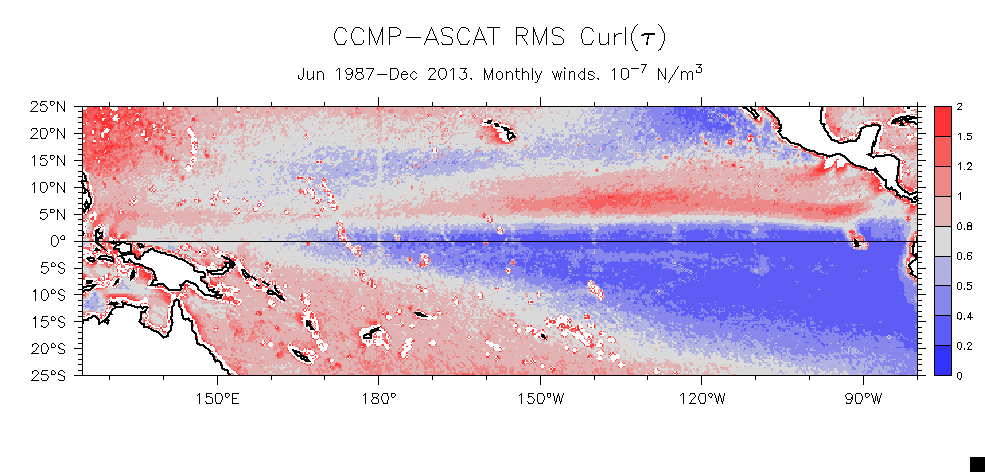
- Monthly (Overlay central section for Ekman transport below)
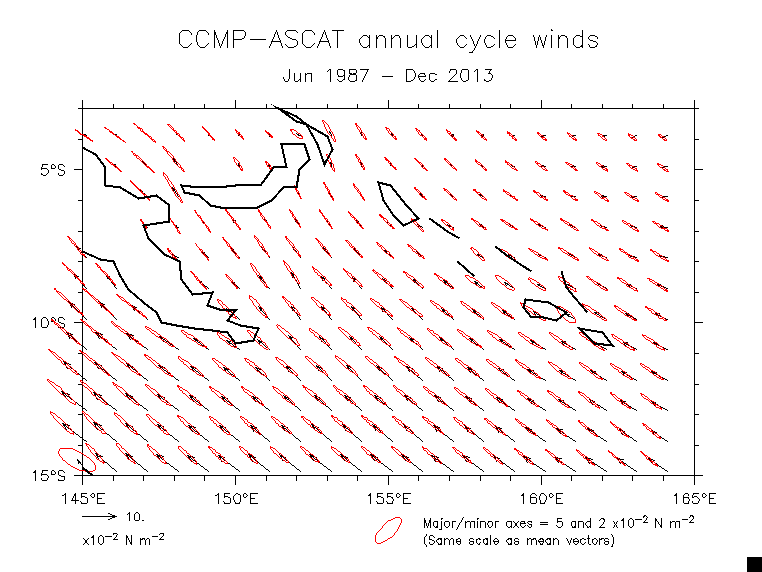
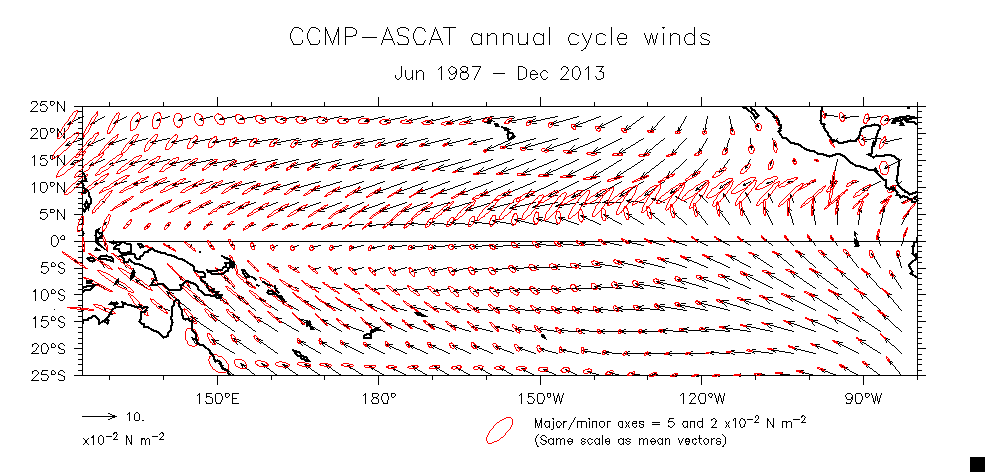
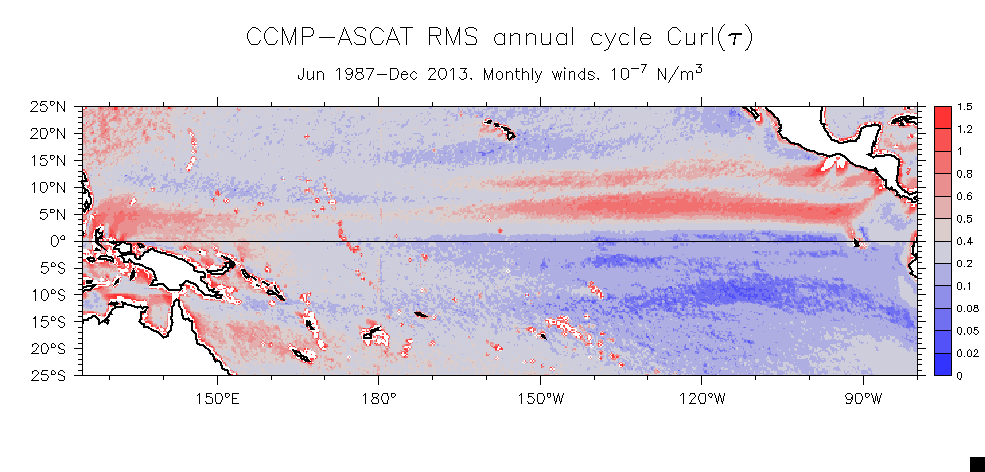
- Annual cycle
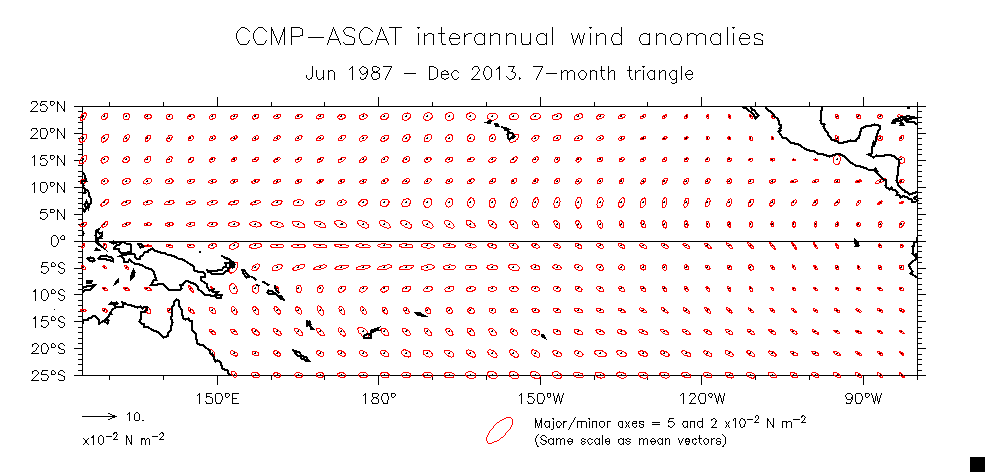
- Interannual
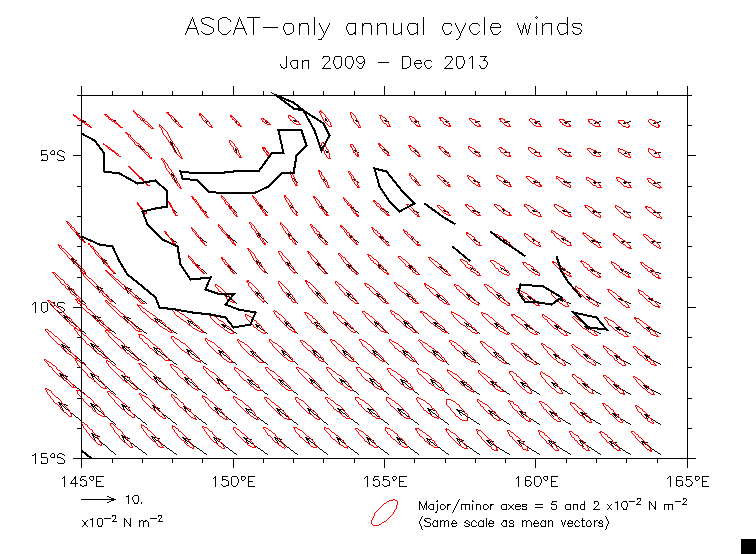
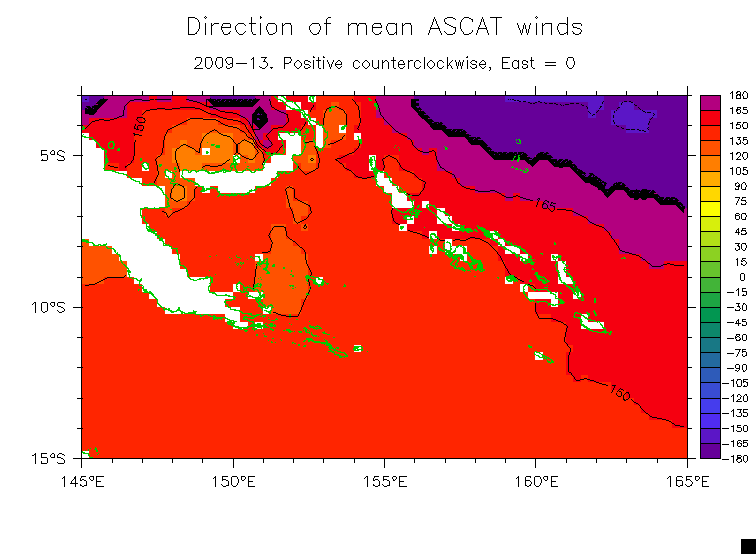
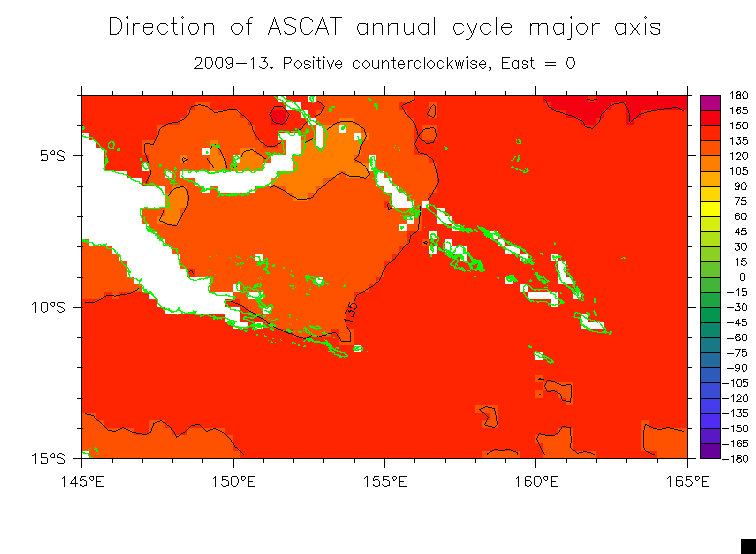
- Annual cycle from ASCAT only (2009-13, finer spatial resolution):
- Variance ellipses
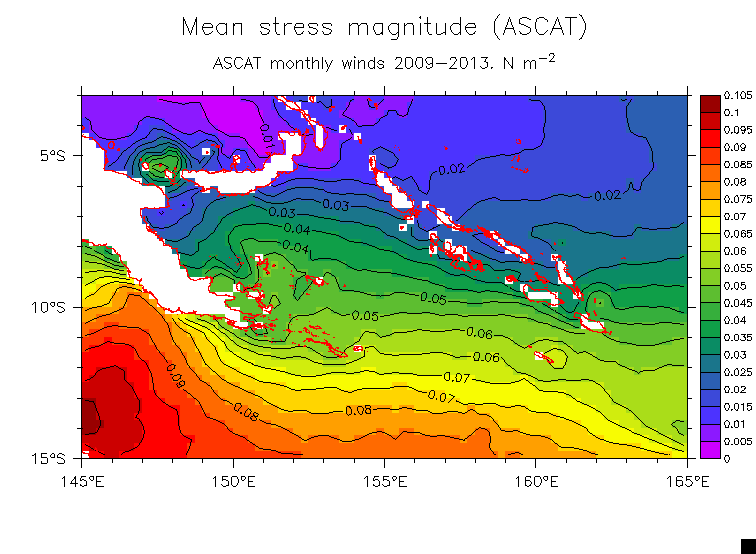
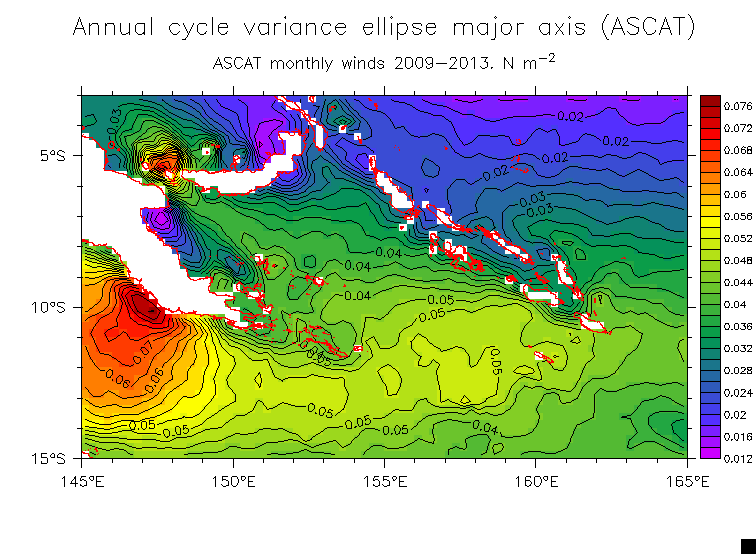
- Magnitudes: Mean stress Variance ellipse major axis
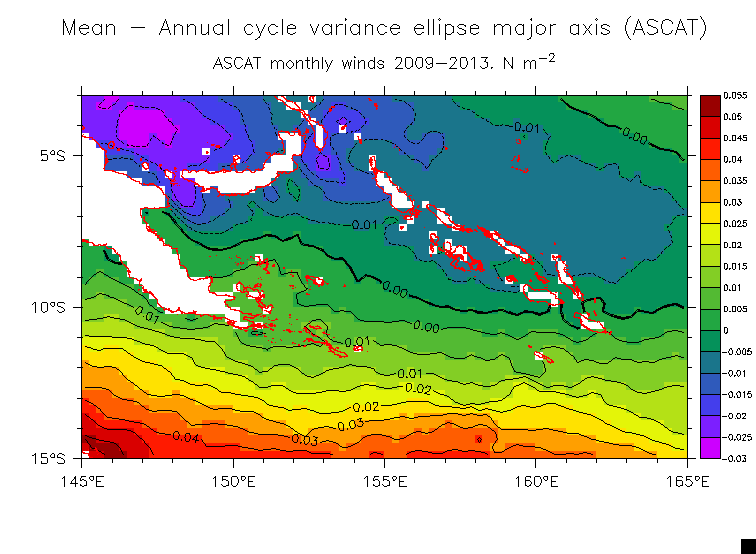
- Mean magnitude minus variance ellipse major axis (Do winds reverse?)
- Direction (Pos. East, counterclockwise): Mean stress Variance ellipse major axis
- Winds along sections
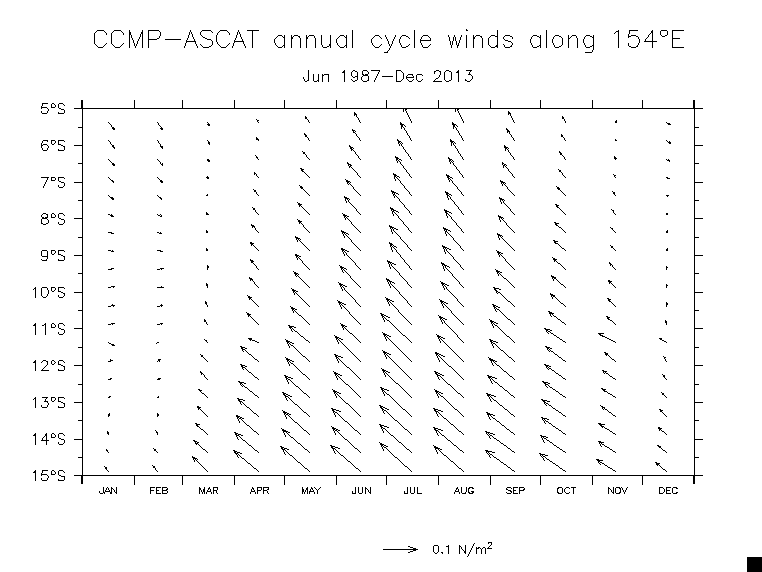
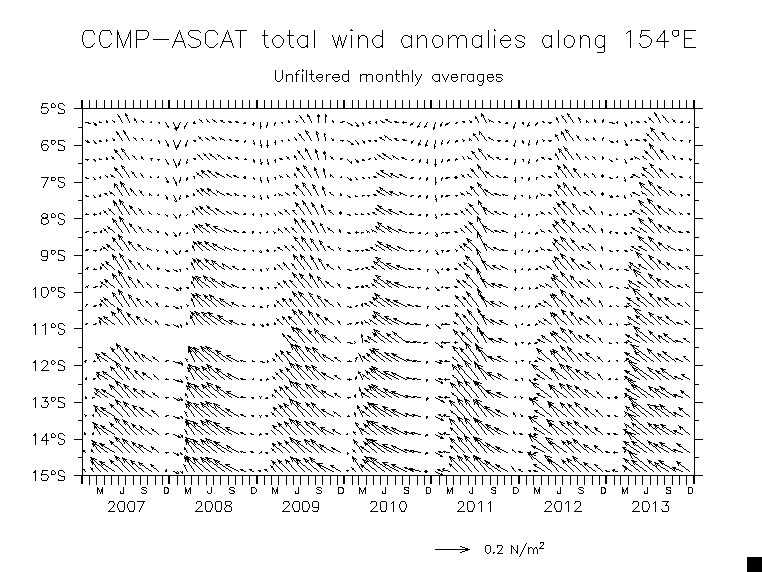
- Along 154°E
- Annual cycle
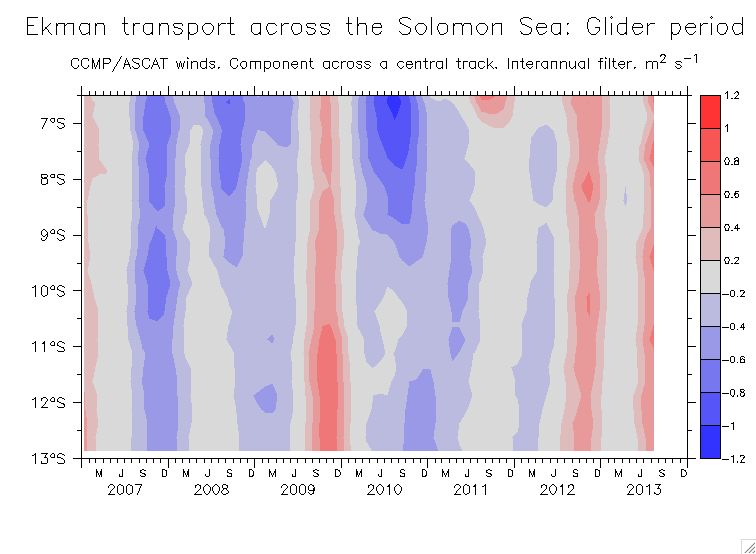
- Interannual (Glider period)
- Long-period
- Unfiltered monthly (glider period)
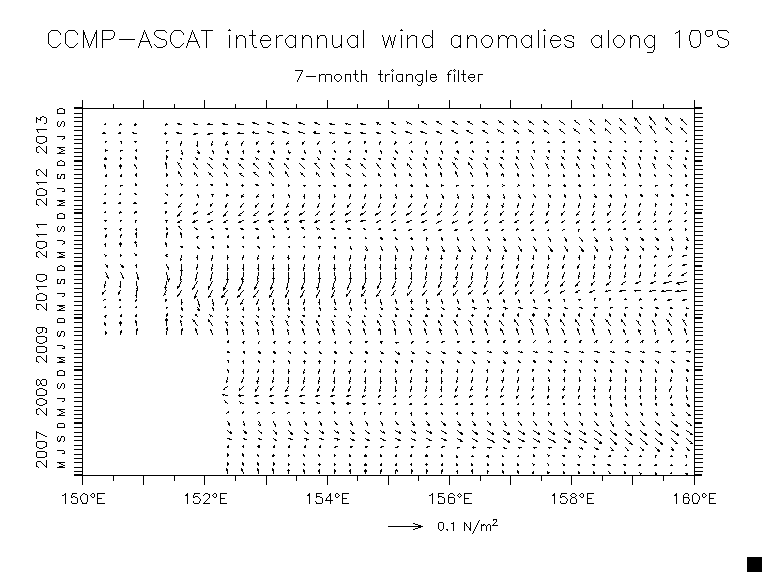
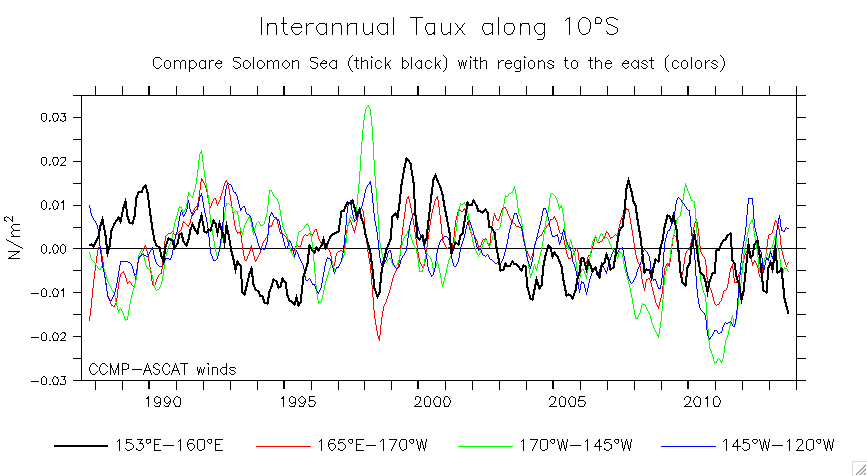
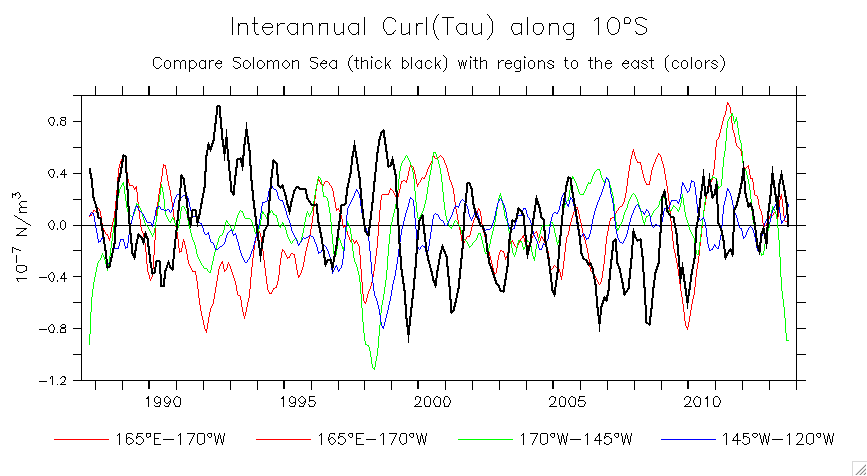
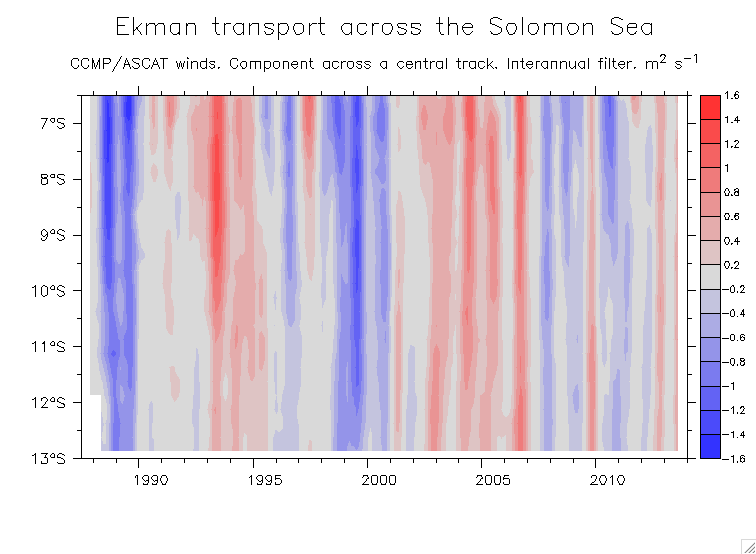
- Interannual along 10°S, inside the Solomon Sea
- Winds along 10°S basin-wide (RW model forcing): Taux Curl
- Basin winds
- Variance ellipses: Monthly Annual cycle Interannual
- Curl RMS: Monthly Annual cycle Interannual
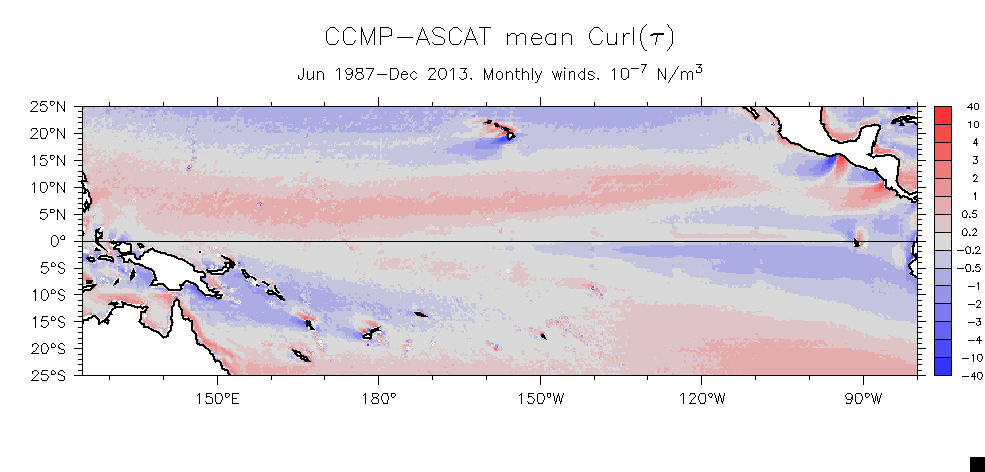
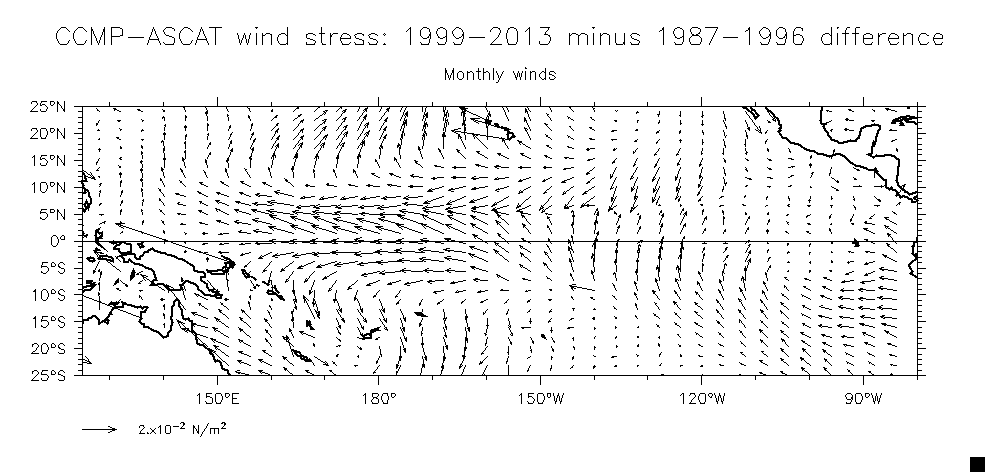
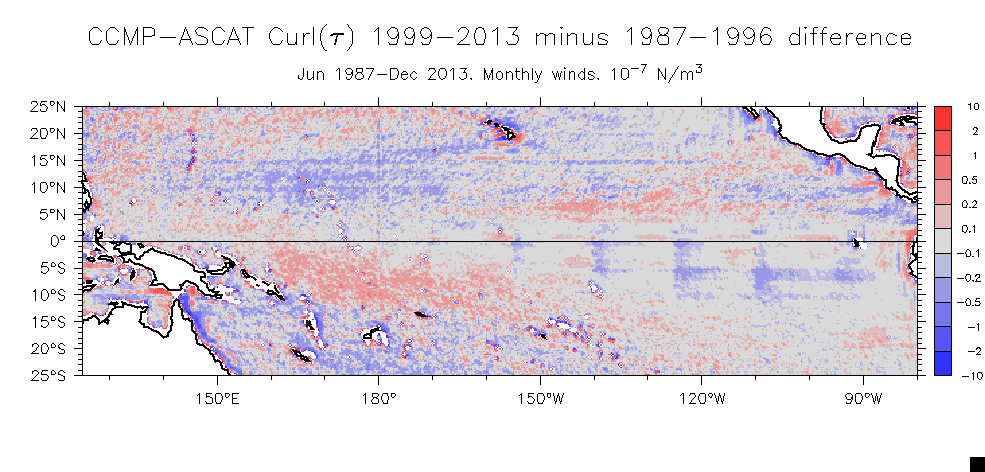
- Decadal changes: 1987-2013 mean Curl Tau difference 99-13 minus 87-96 Curl difference
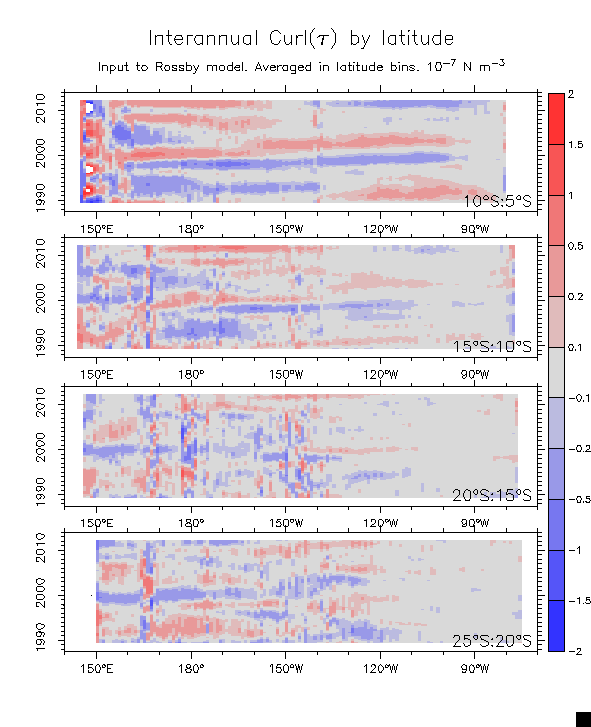
- Low-frequency Curl(x,t) averaged in latitude bins
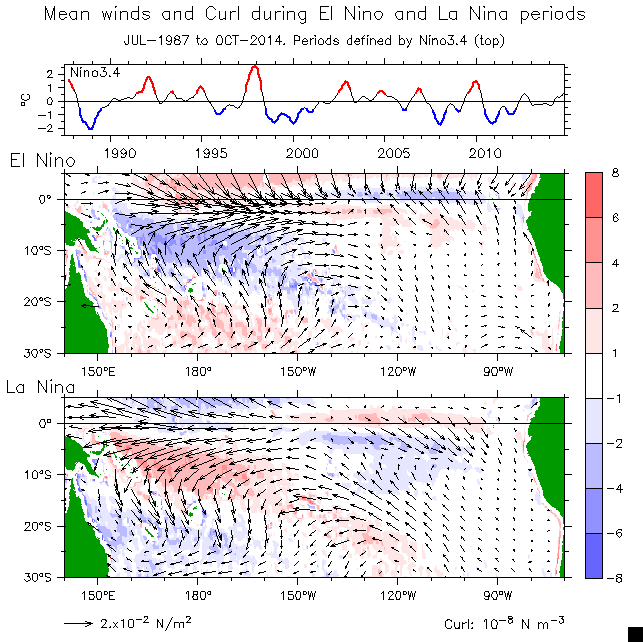
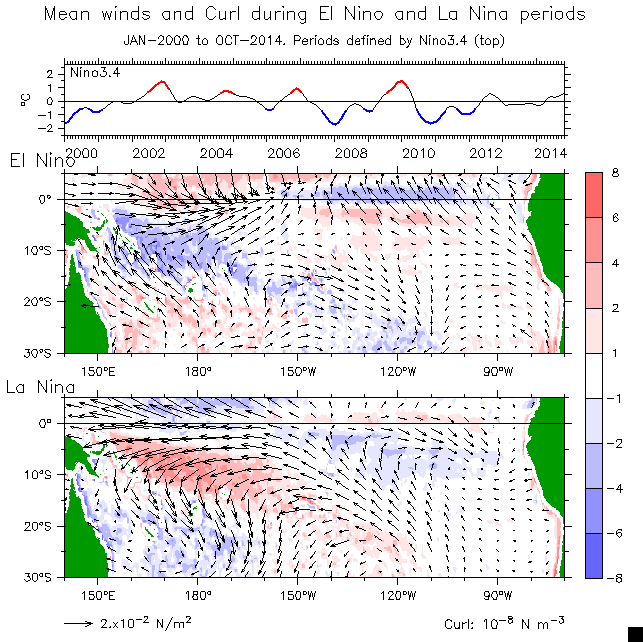
- Nino/Nina winds and curl "composites" for various periods:
1987-2014
1987-99
2000-14
2007-14 (glider period)
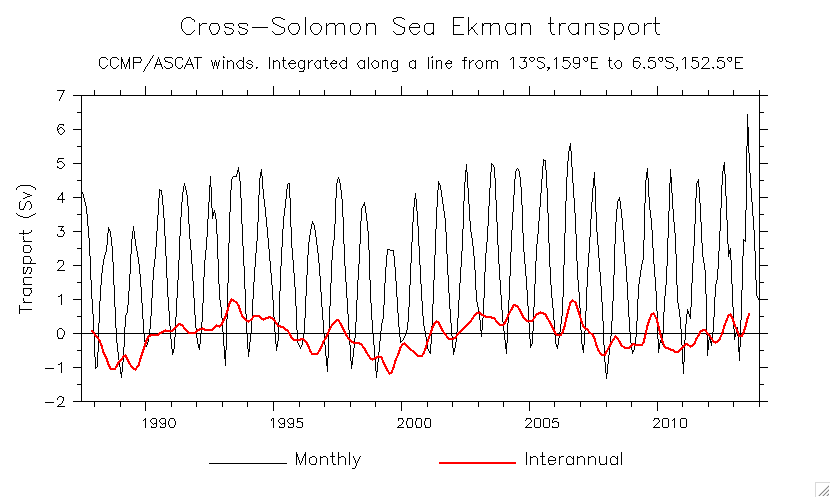
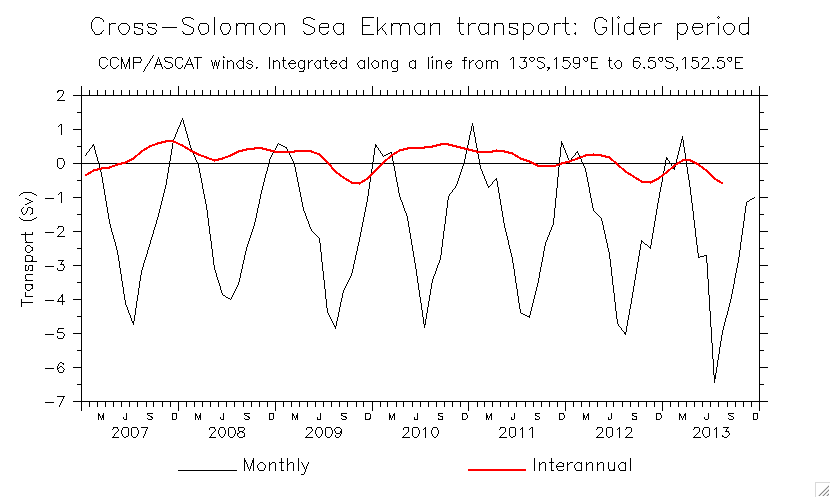
- Ekman transport calculations
Based on a diagonal section down the center of the Sea
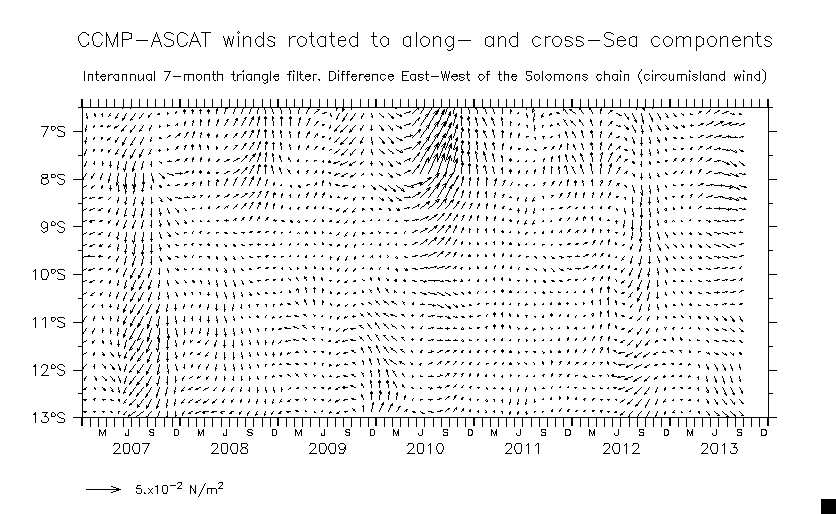
- Interannual winds rotated to Along - and Cross-Sea components
Compare section east of Solomons: Parallel eastern section Difference (circumisland wind)
- Time series integrated along the section (Sv) (Glider period) (Demeaned)
- Time series on latitude (Glider period)
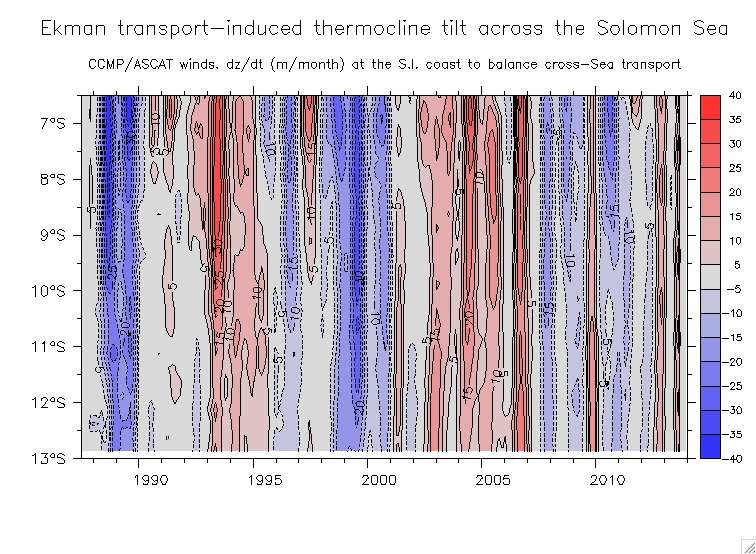
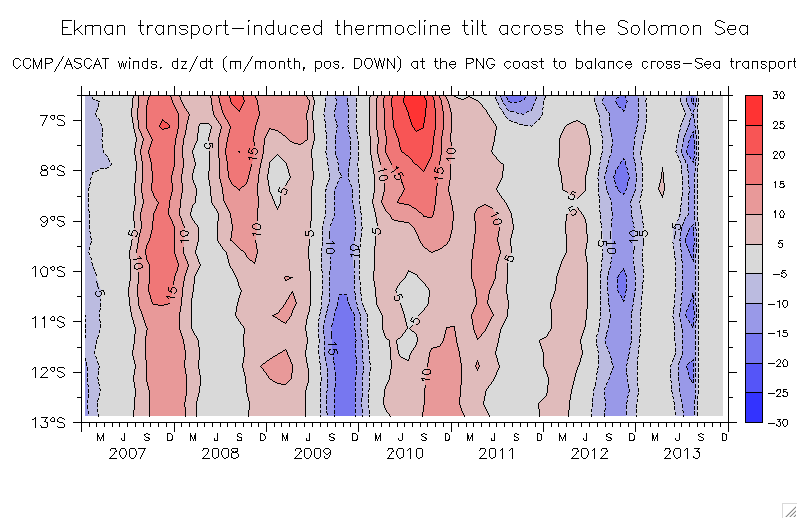
- Implied dh/dt at S.I. coast (Glider period)
- Ekman slides sent to Russ (7 Feb 2014) (pdf)
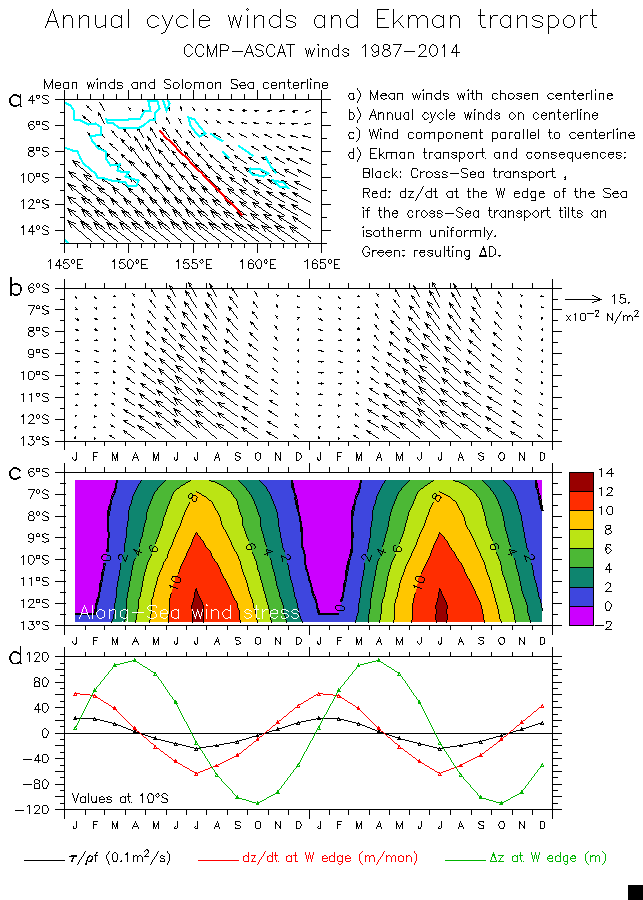
- (Aug 2015) Annual cycle winds and Ekman transport
- Annual cycle Z20 and Ekman inference
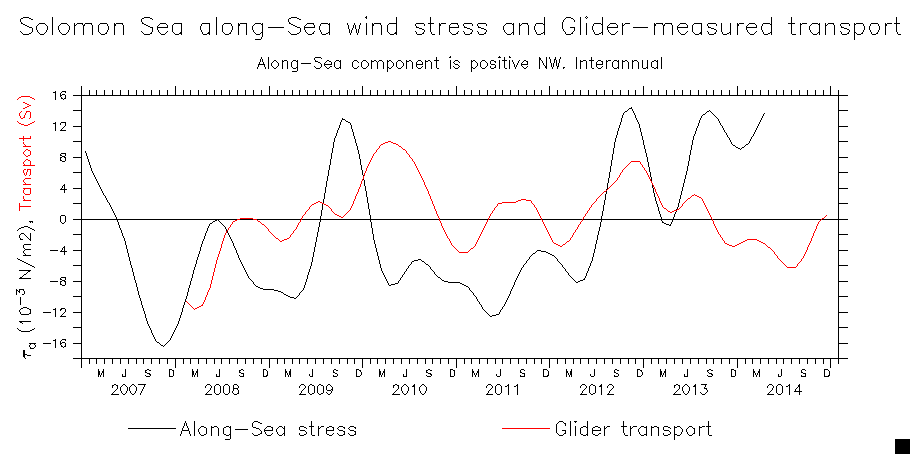
- Interannual alongsea windstress and glider transport
- Later work with along-axis winds:
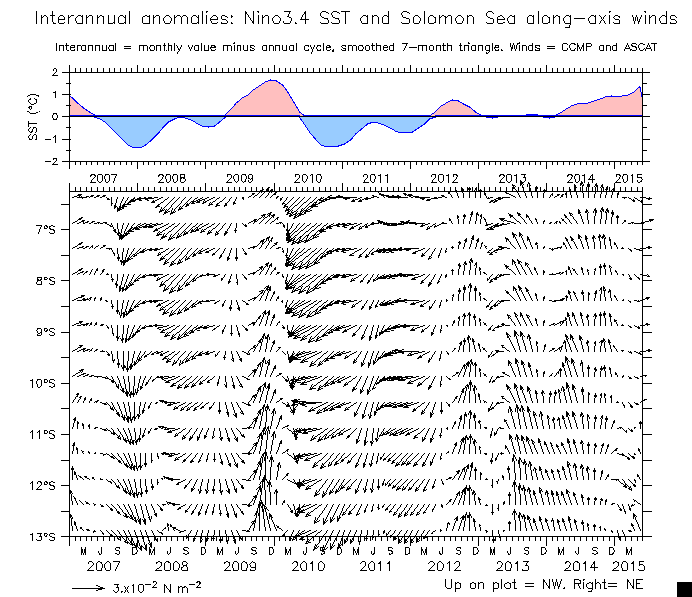
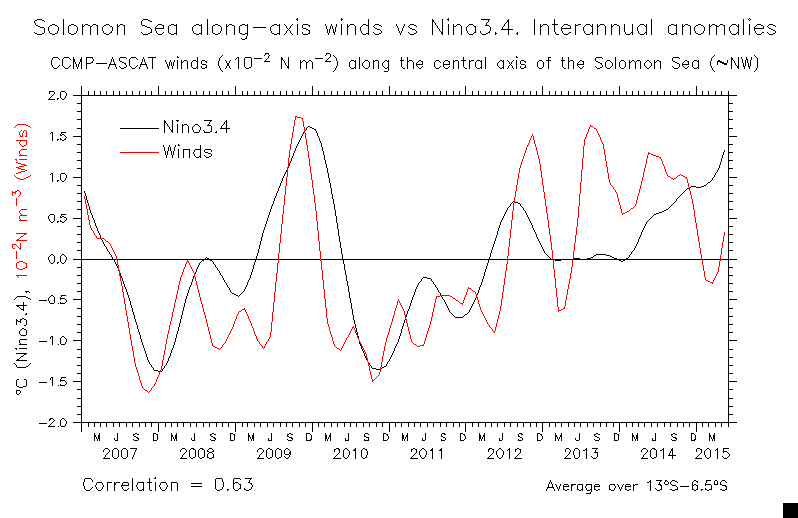
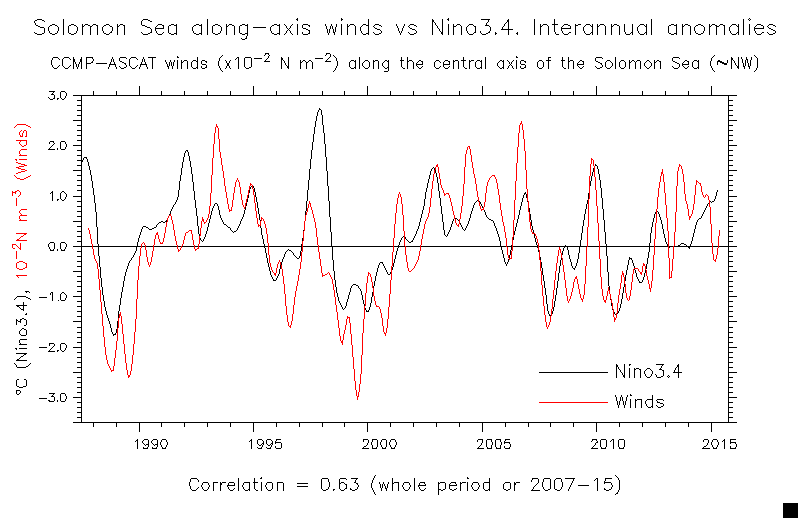
- Vectors of Sol Sea along/cross-axis winds vs Nino3.4
- Line plots of along-axis winds: Glider period to Jun 2015, include transport Winds and Nino3.4 back to 1987
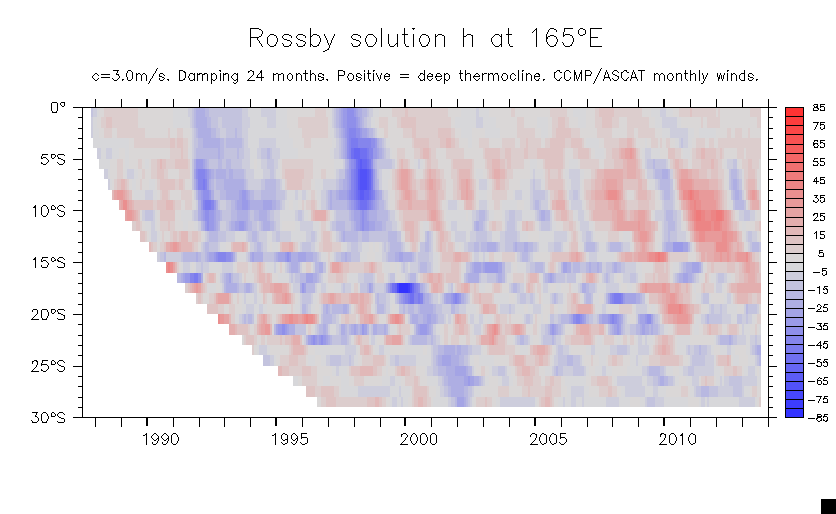
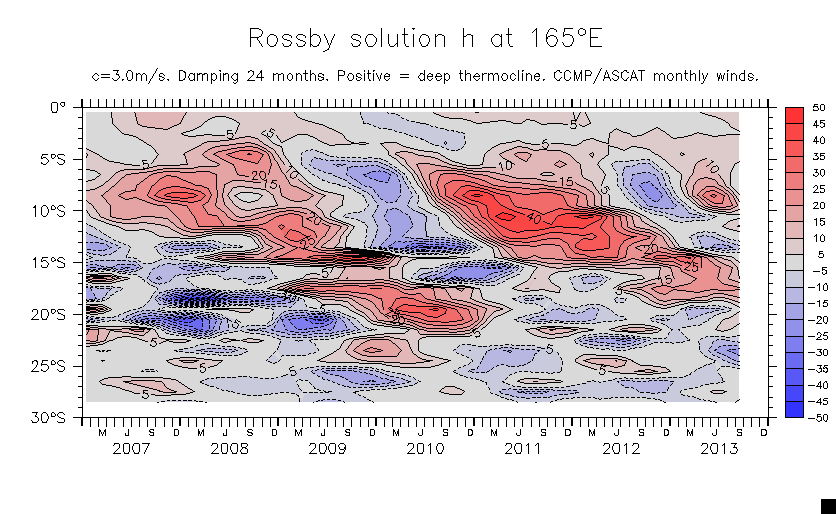
- Rossby solution (Early work, Feb 2014. See next section)
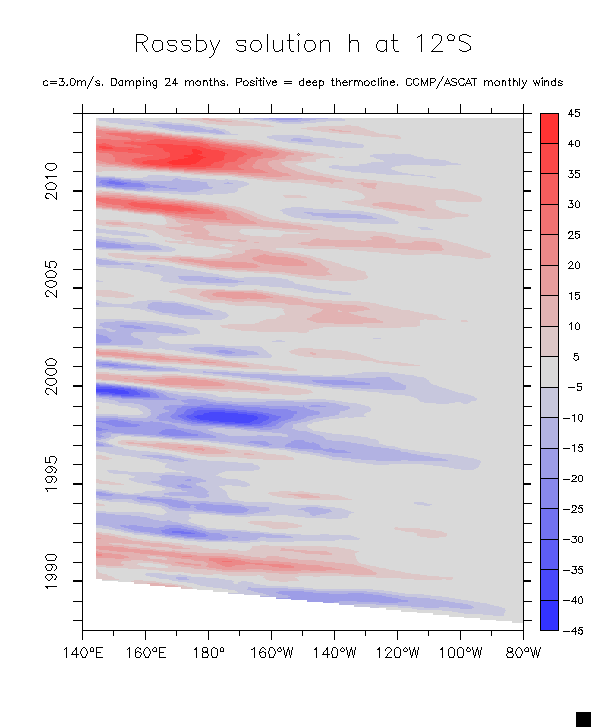
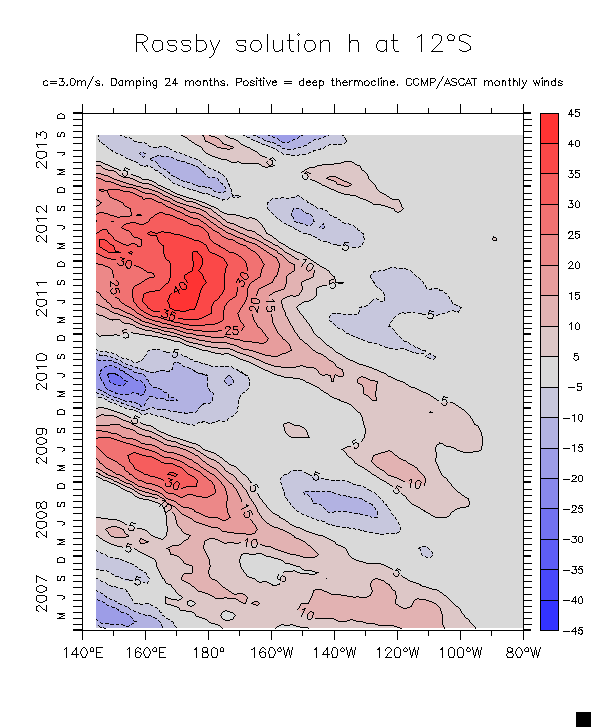
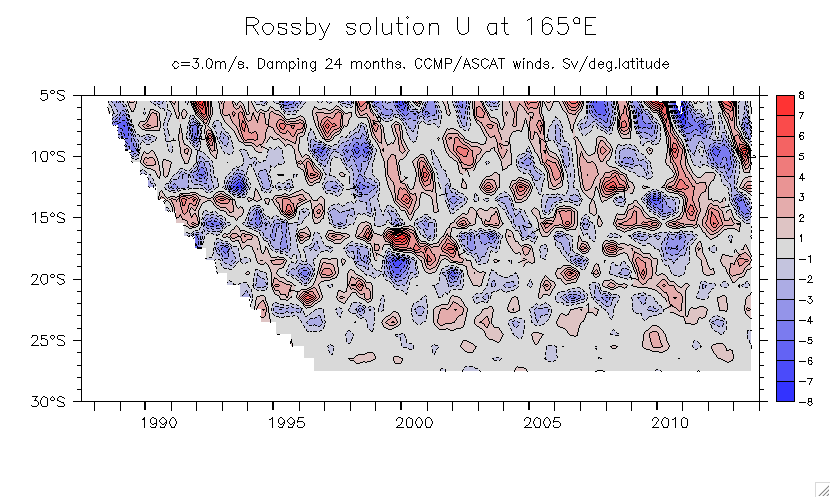
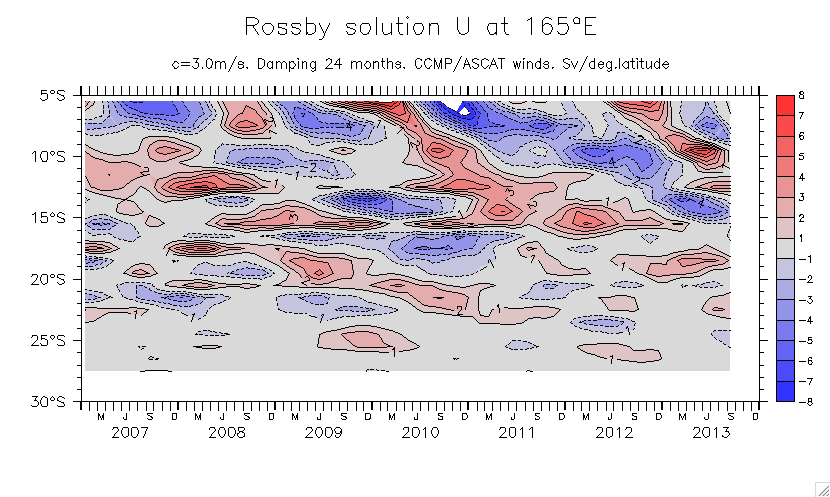
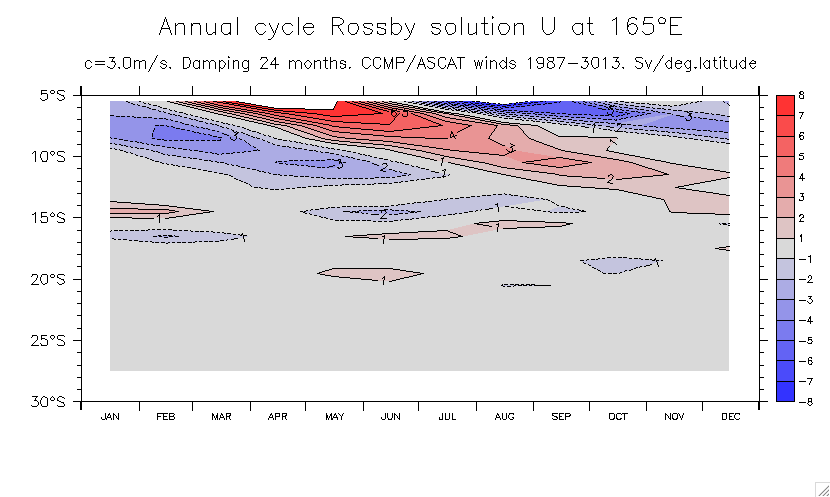
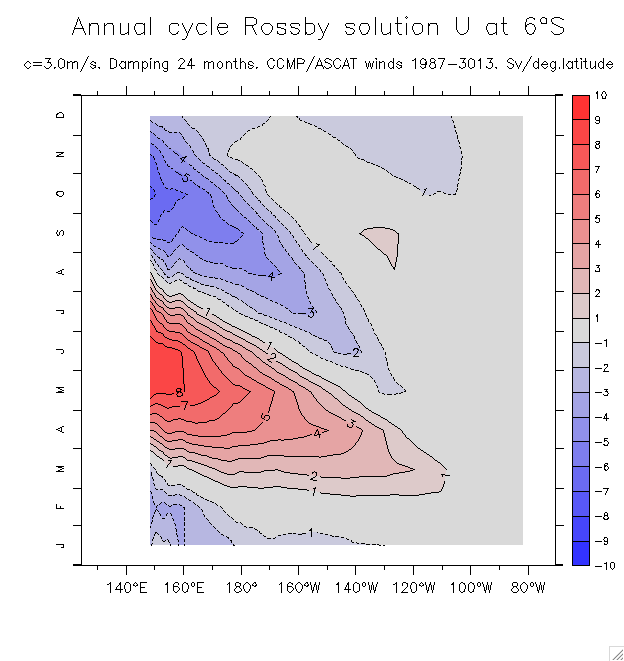
CCMP/ASCAT interannual winds.
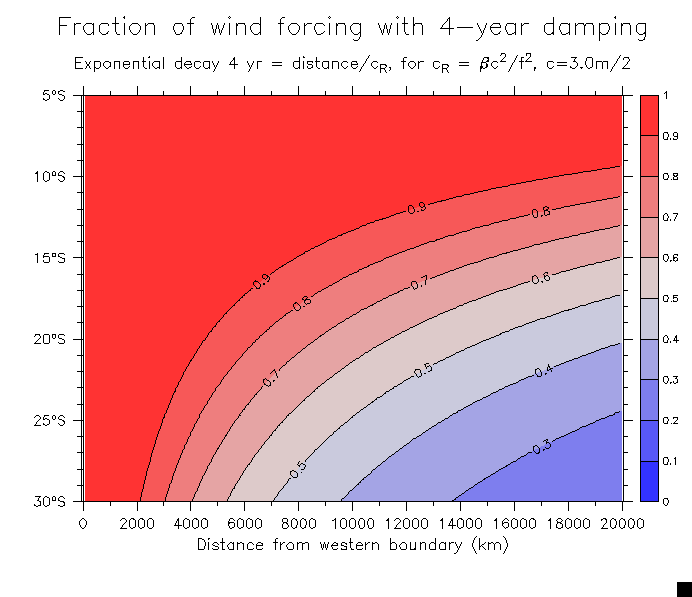
Unless noted: c=3.0m/s, Damping=24 months.
- h: thermocline depth anomalies, positive down
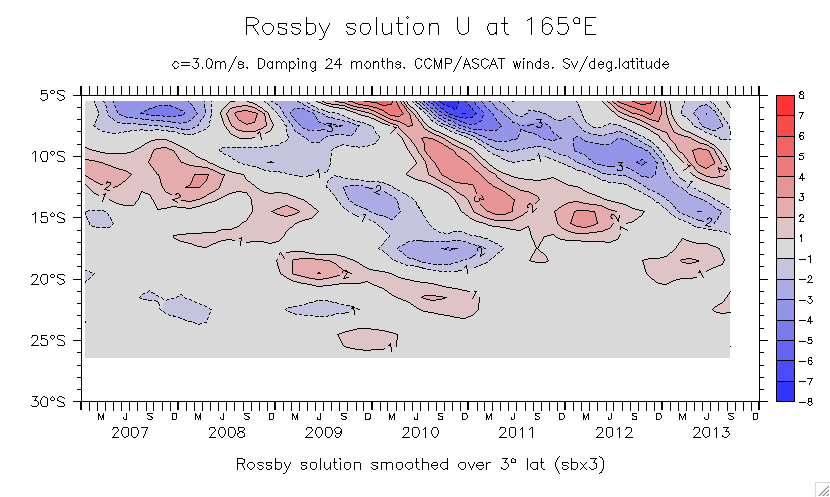
- Along 165°E (Glider period)
- Along 12°S (Glider period)
- ug on 165°E: All Glider period y=spz3
Total u_rw arriving at the Solomon Islands
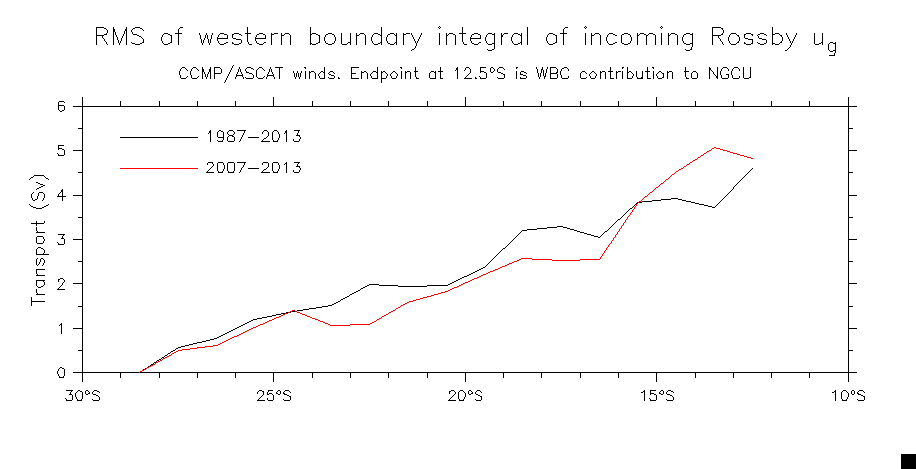
- RMS ug at the western boundary input to the NGCU: Incoming transport RMS(y) Integral RMS
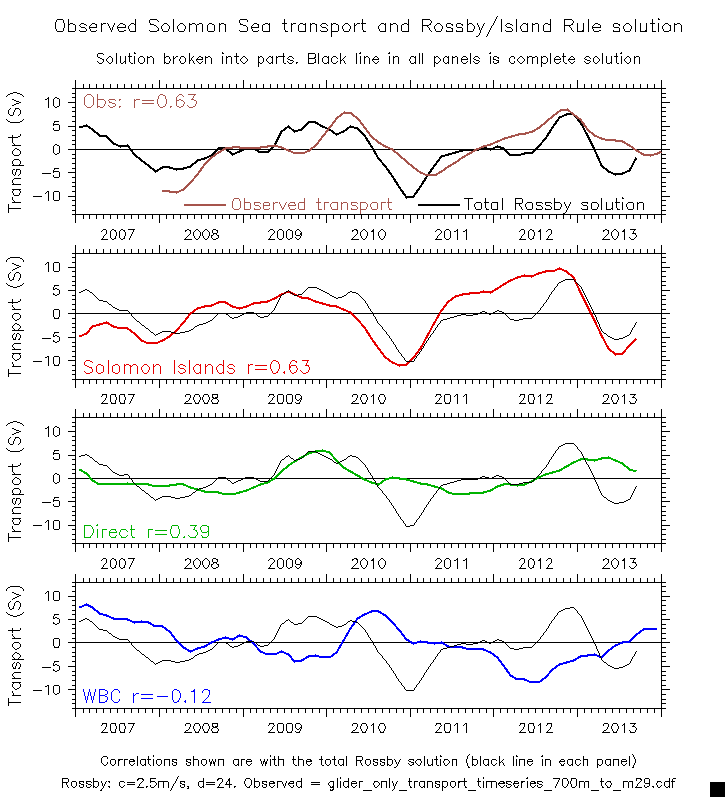
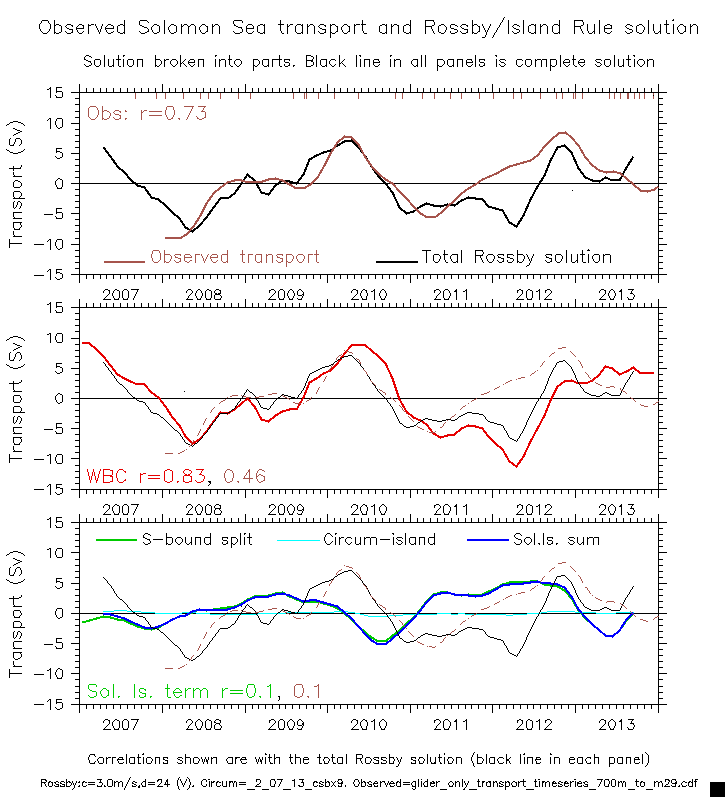
- Rossby/Godfrey solution for Solomon Sea transport (Preliminary)
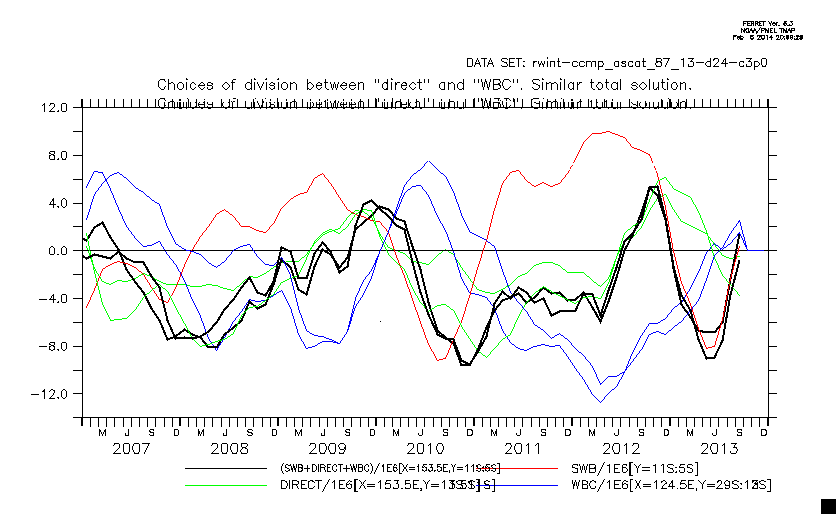
- Solution broken into WBC, direct, Sol.Is.: Compare glider transport Compare SOI (2 choices of dividing latitude) 1987-2013
Compare 700m obs
- Compare SI, Direct, WBC pieces separately (700m): c=3.0m/s c=2.5m/s 1987-2013
- (Glider transport interannual and SOI)
- Annual cycle solution:
- Urw: At 165°E 6°S (Further S is very weak)
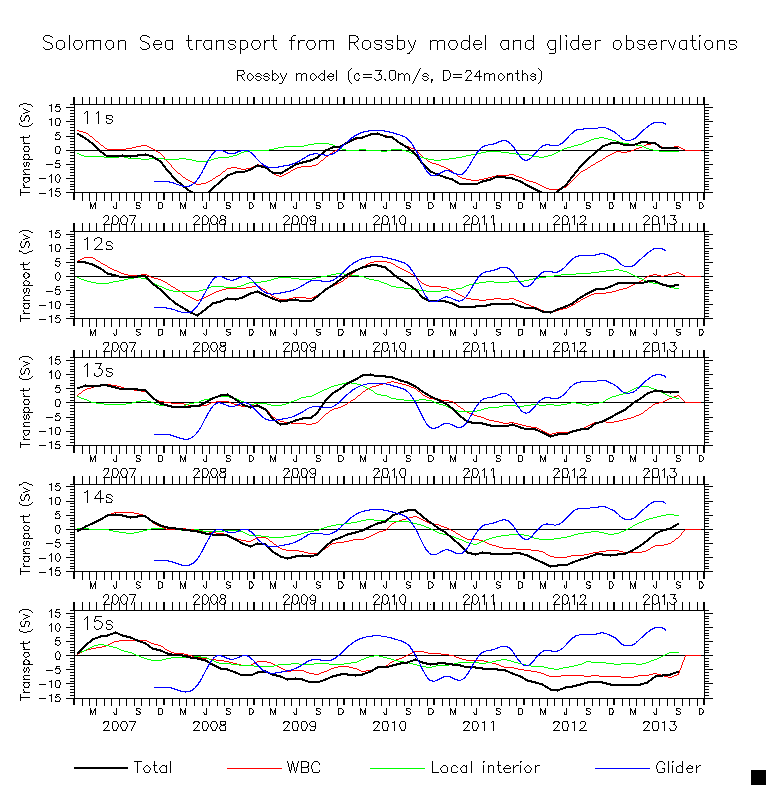
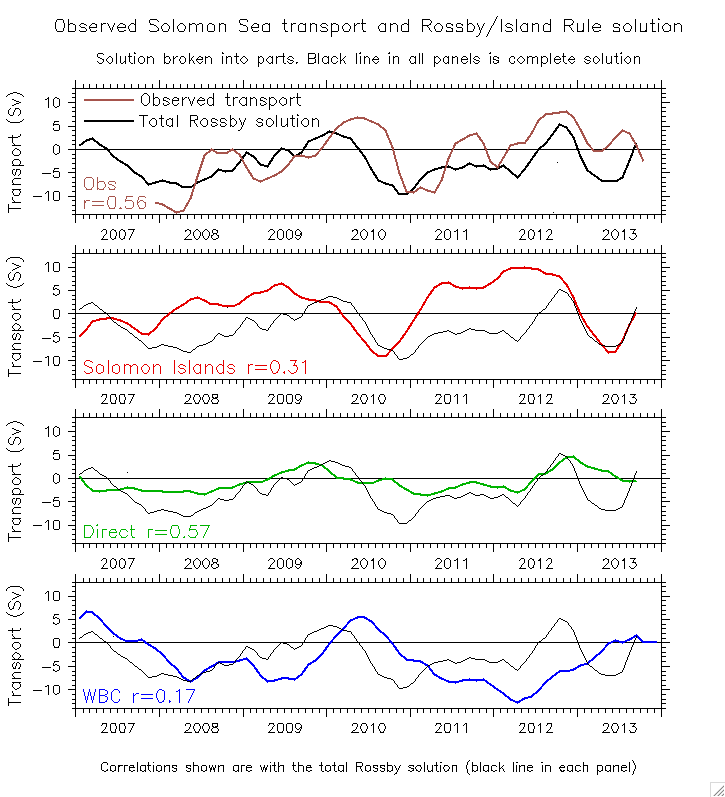
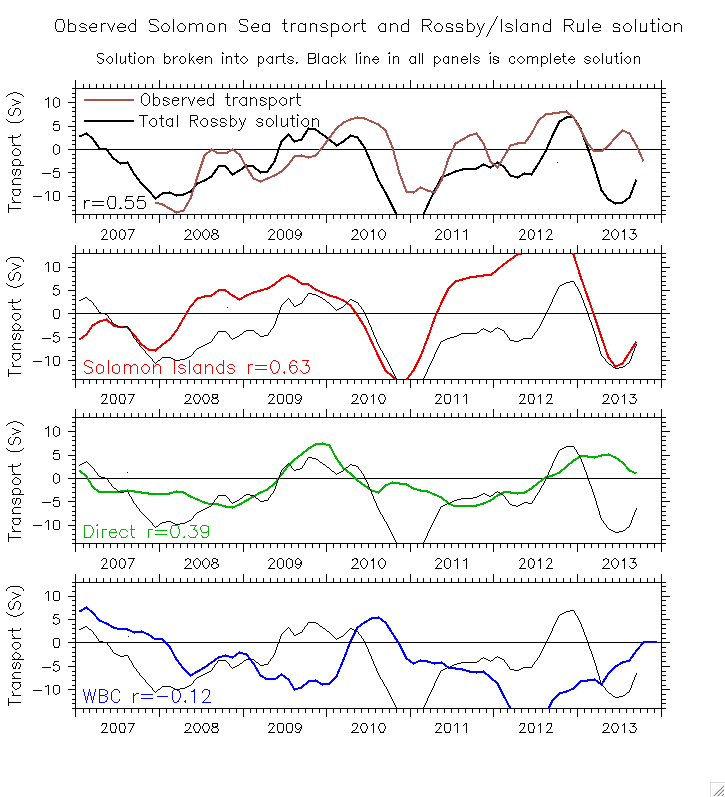
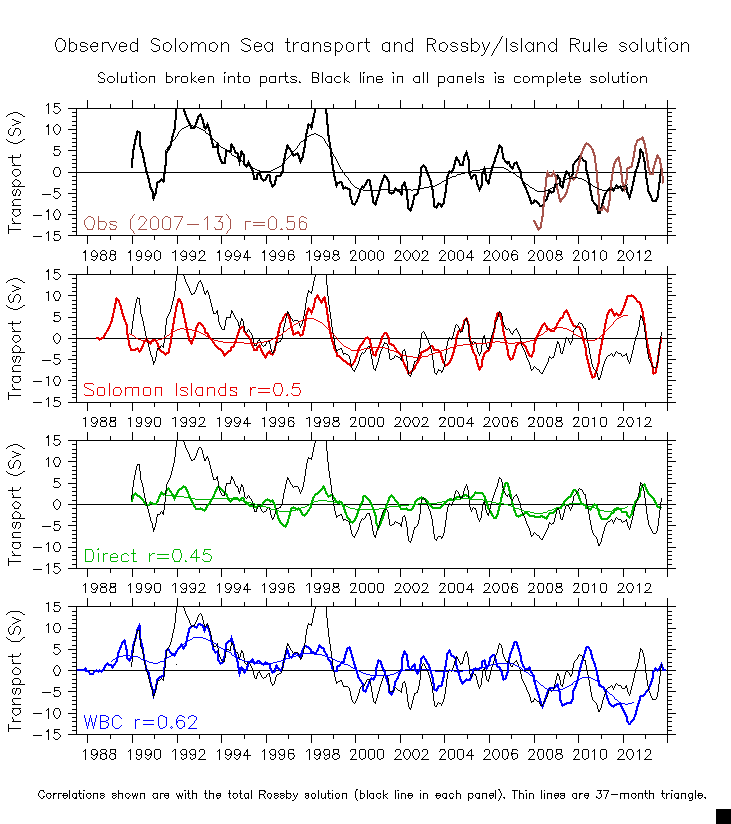
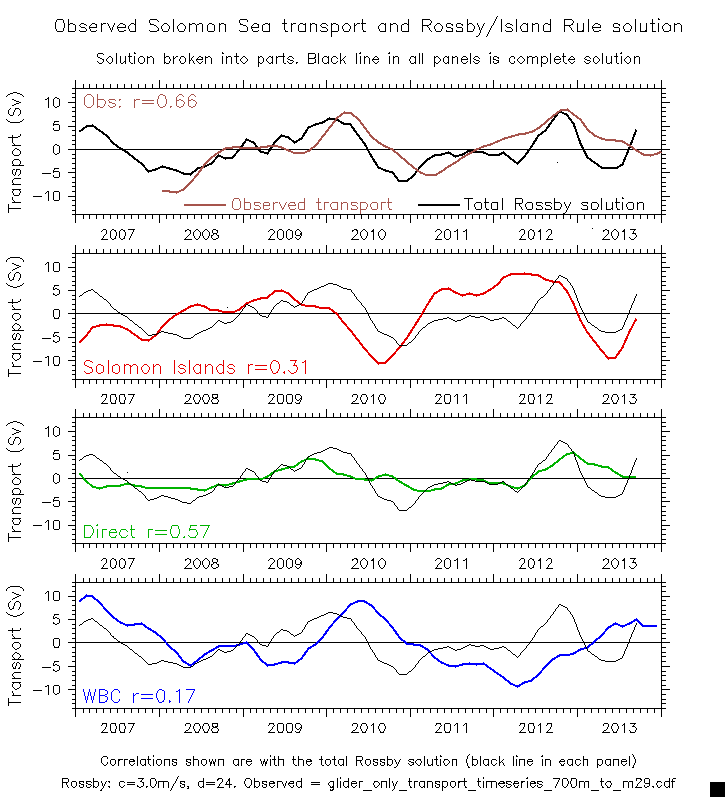
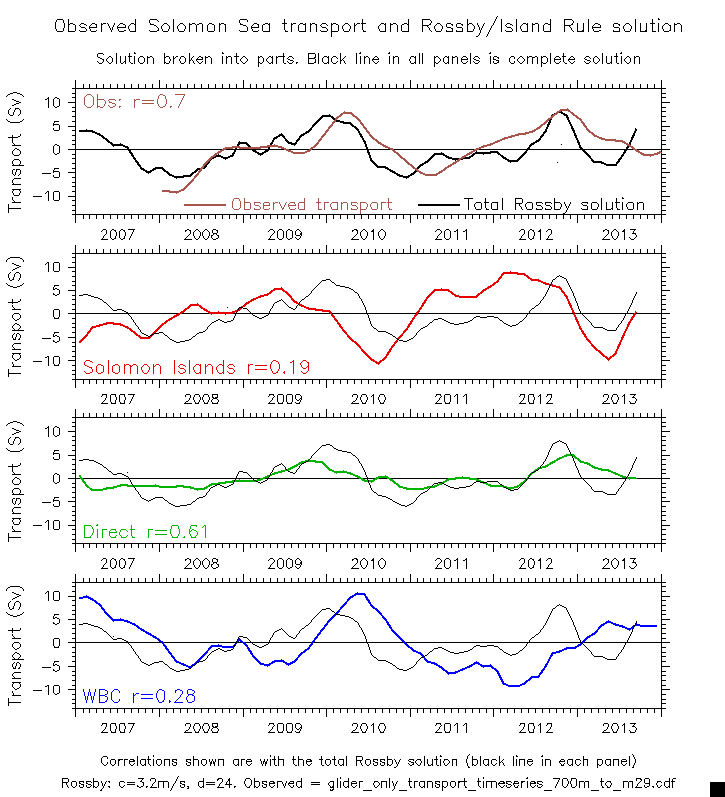
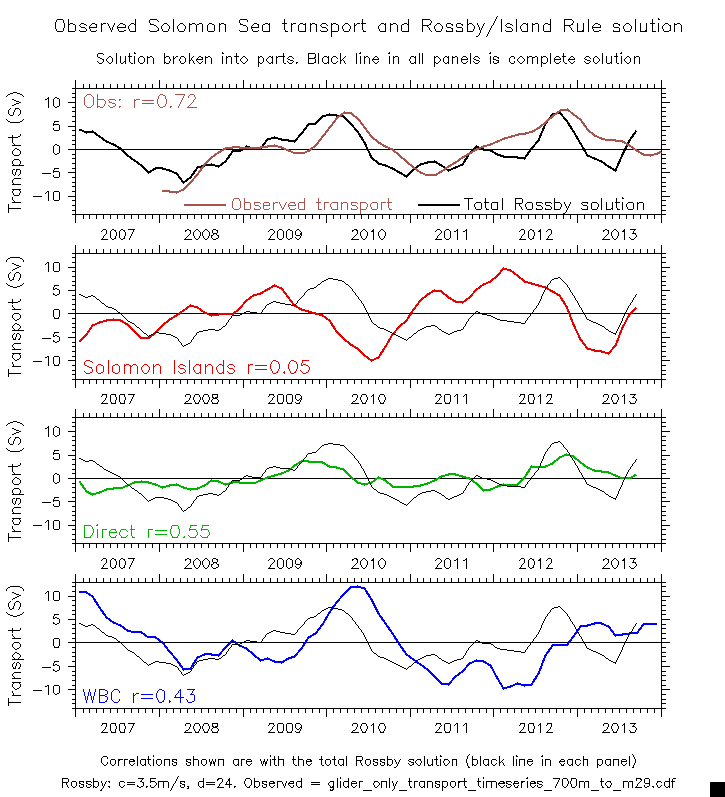
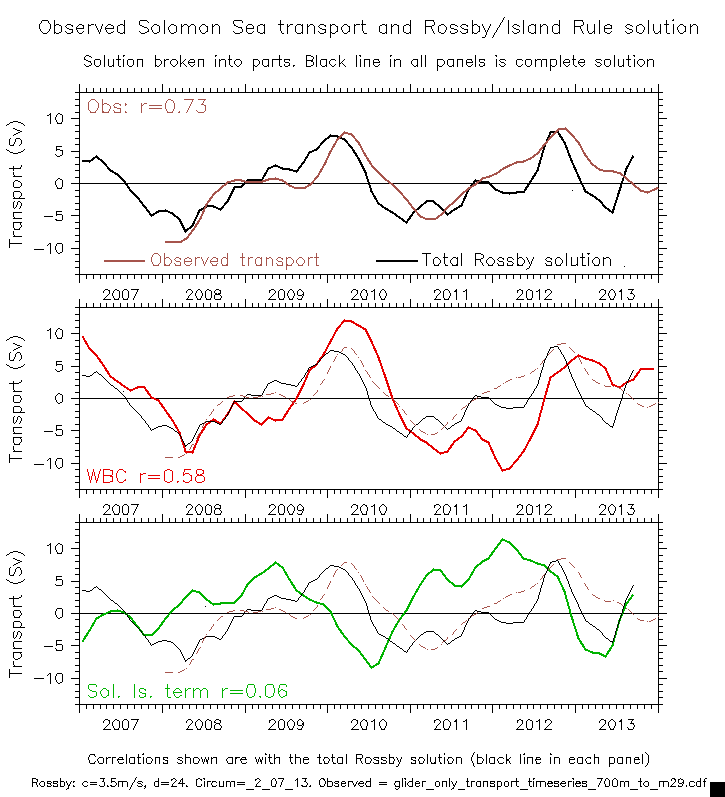
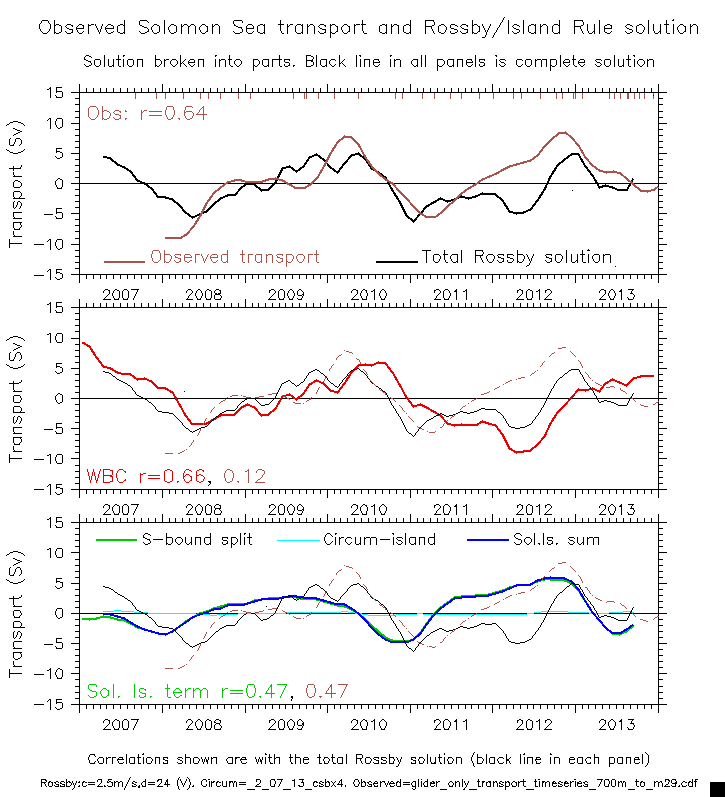
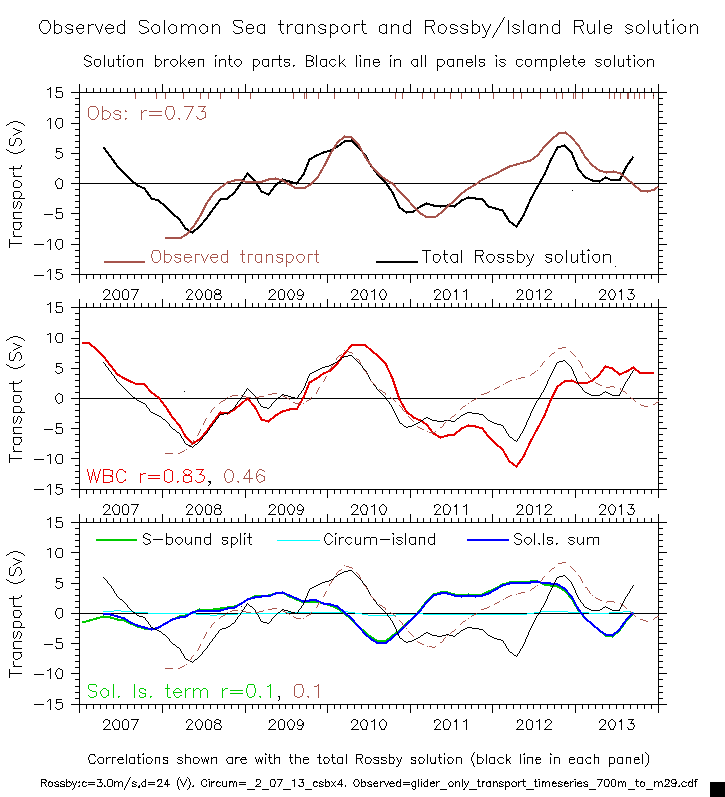
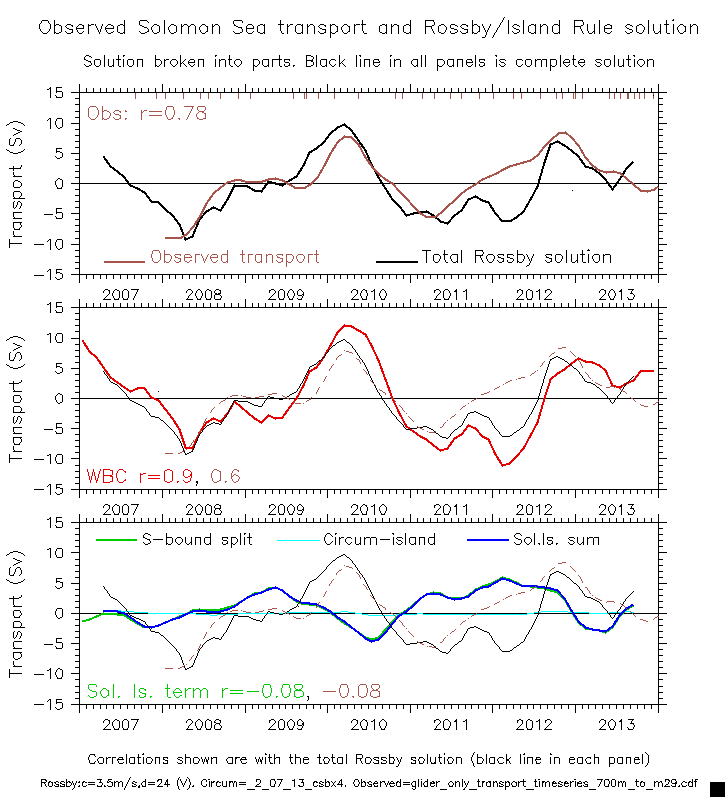
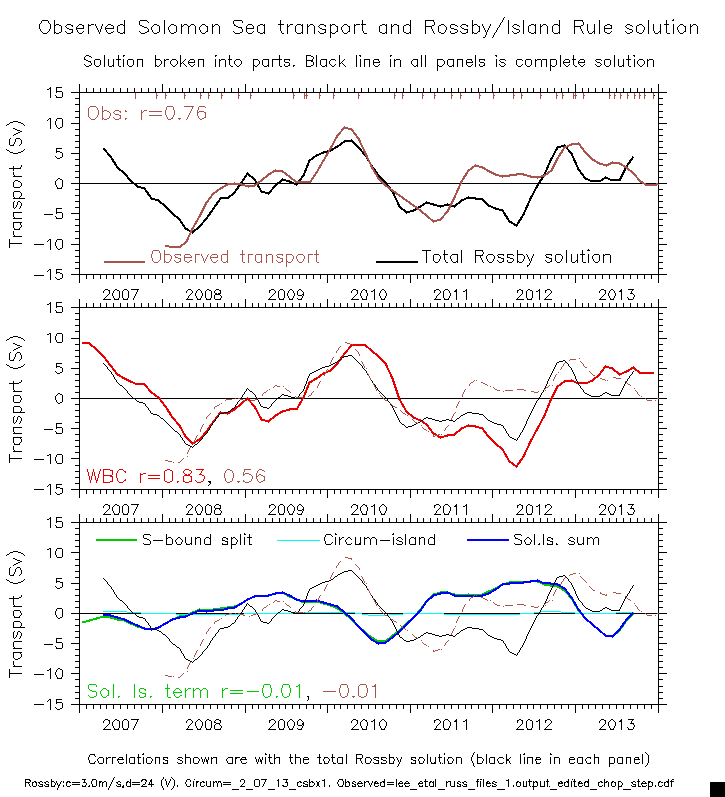
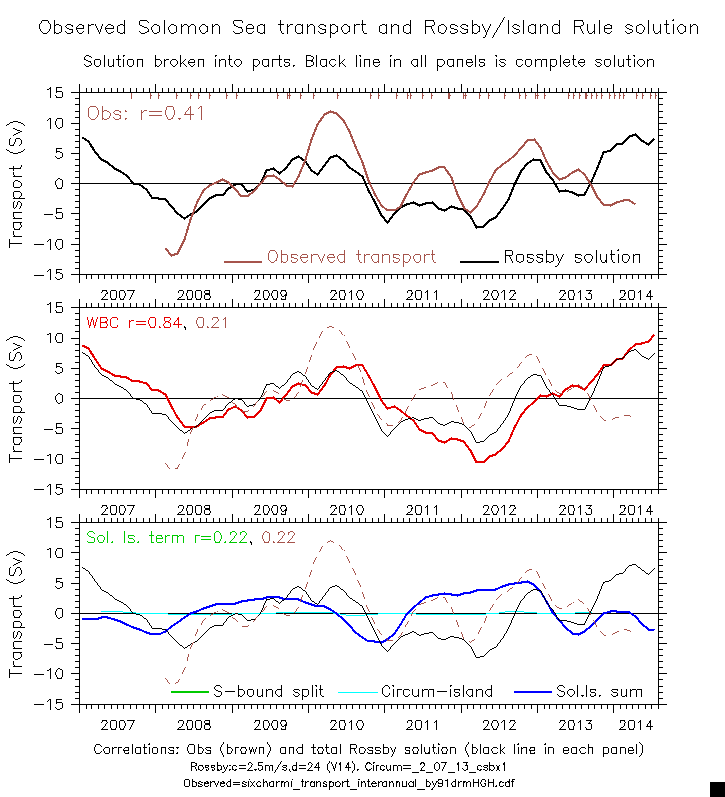
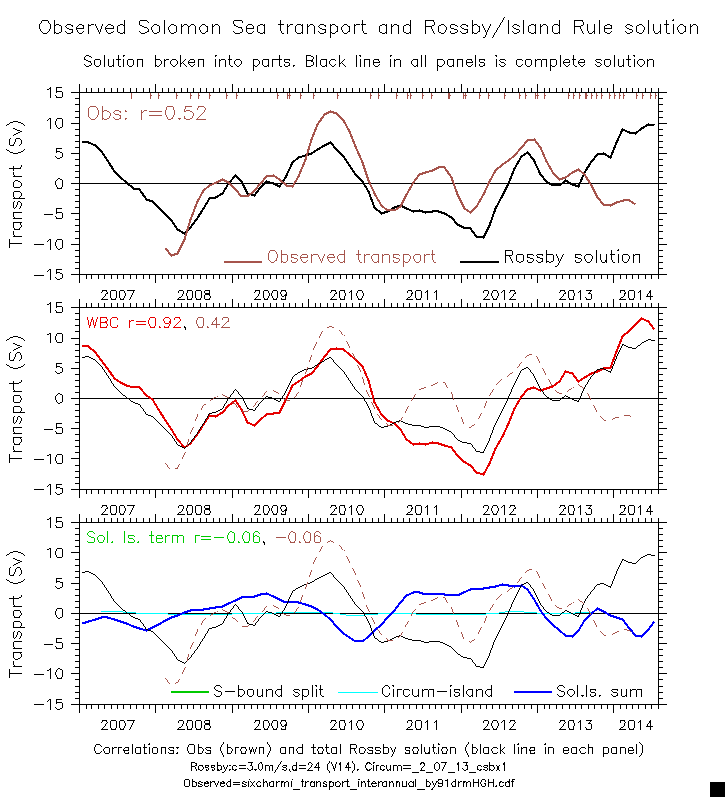
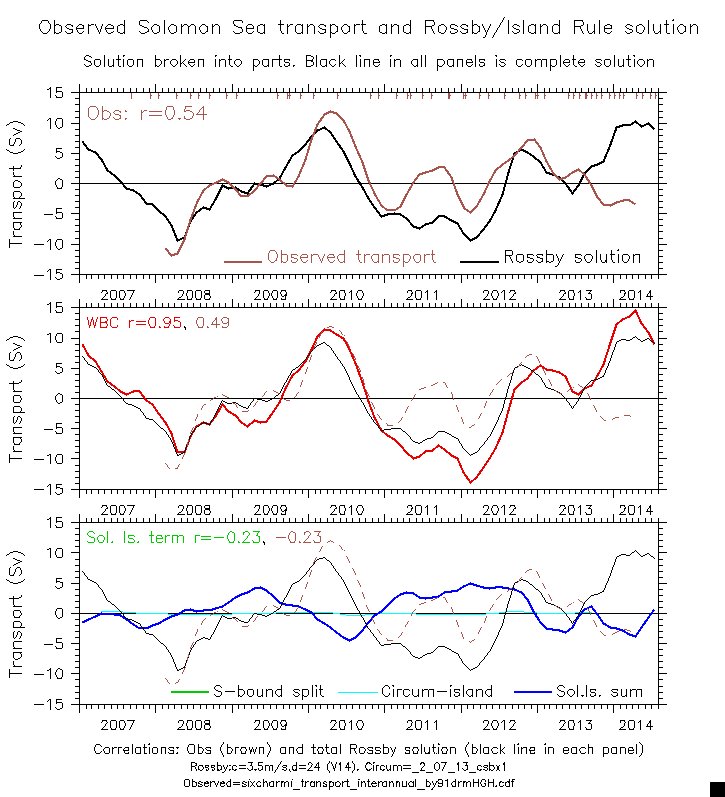
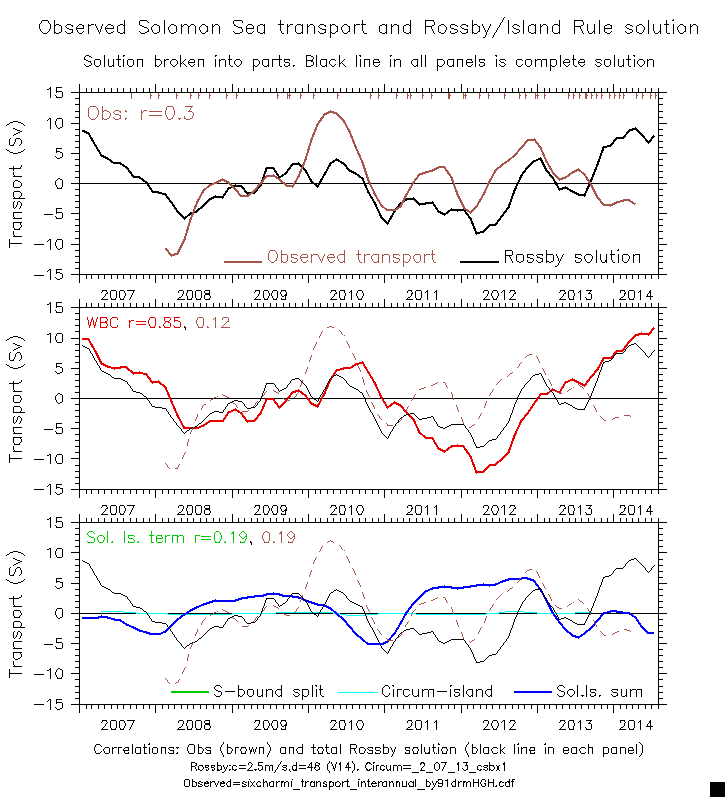
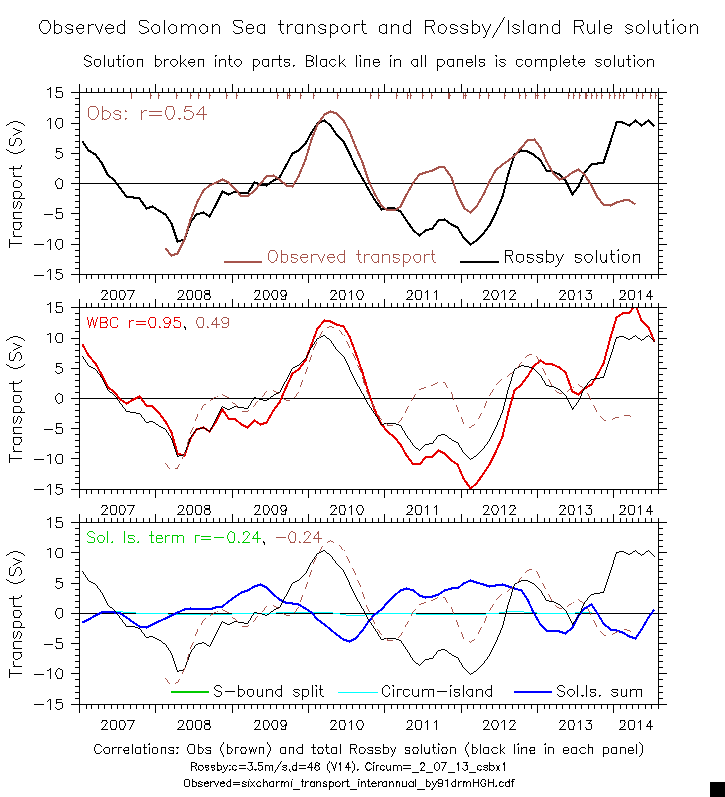
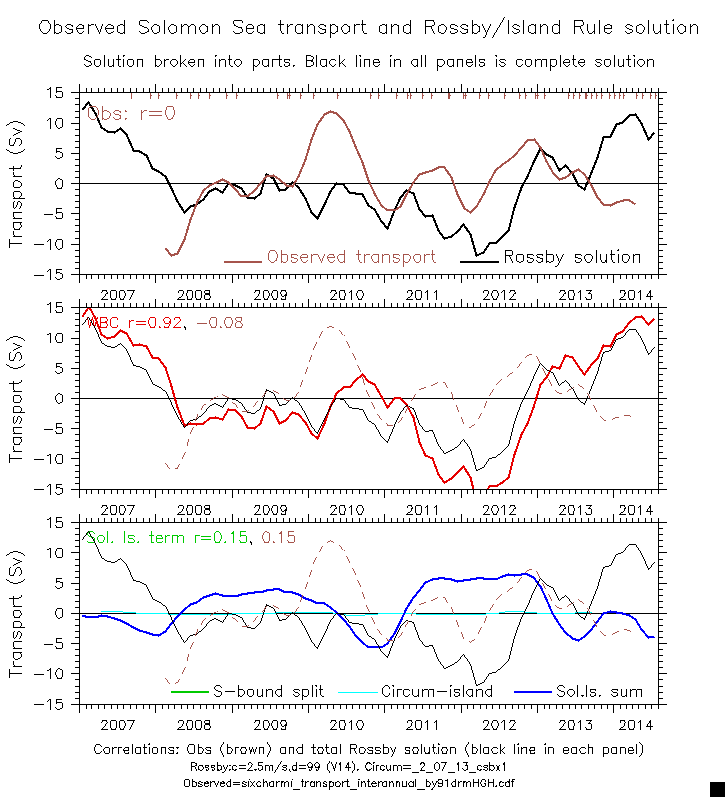
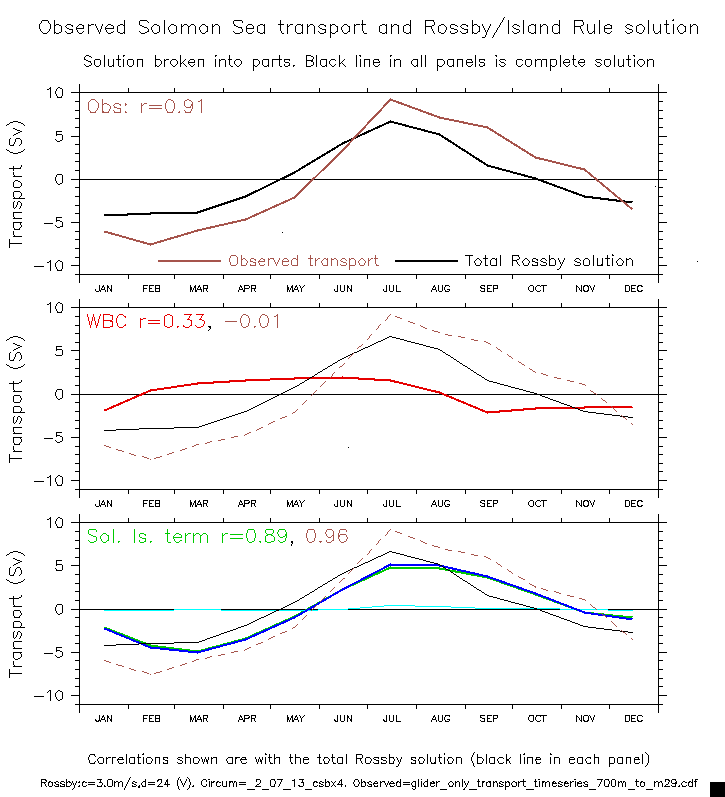
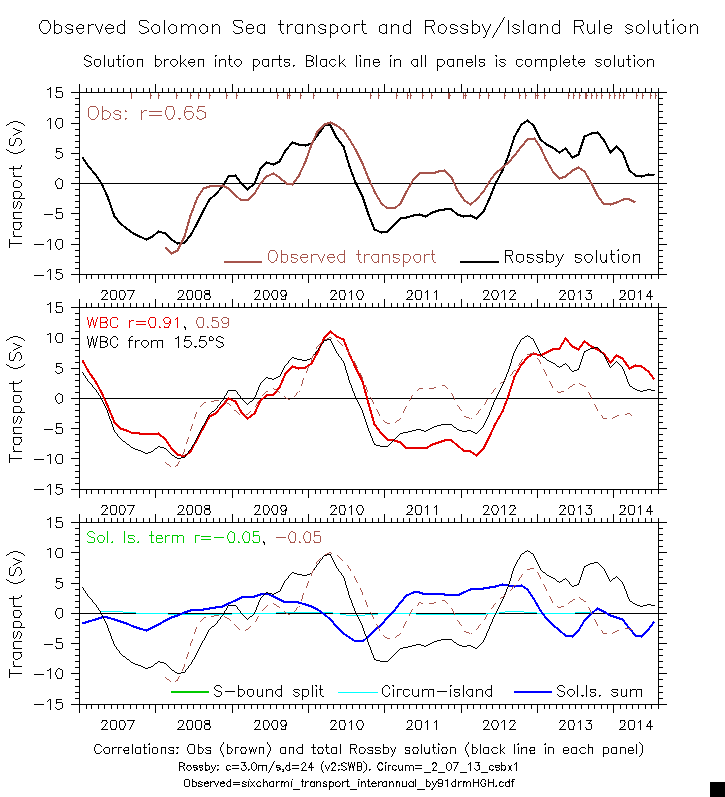
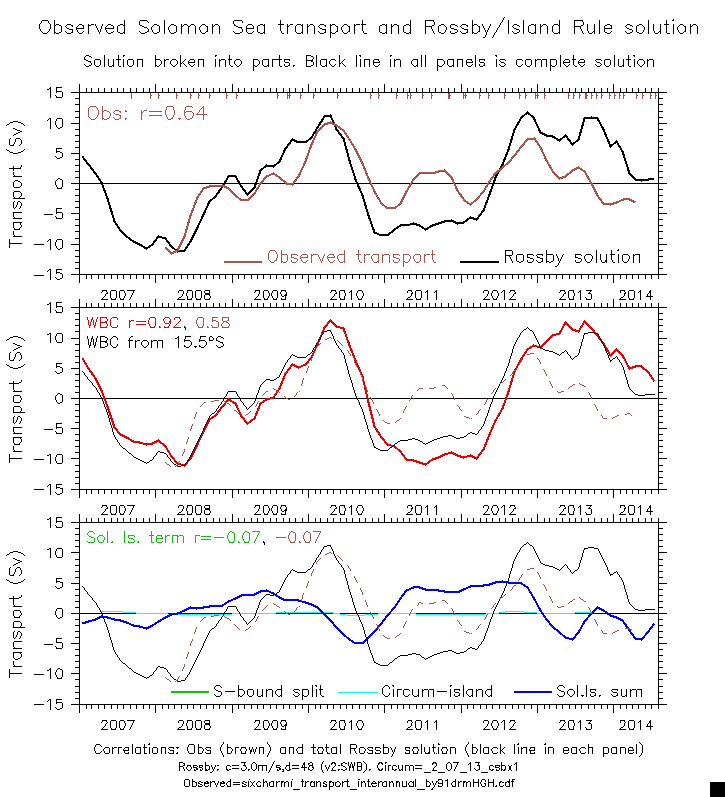
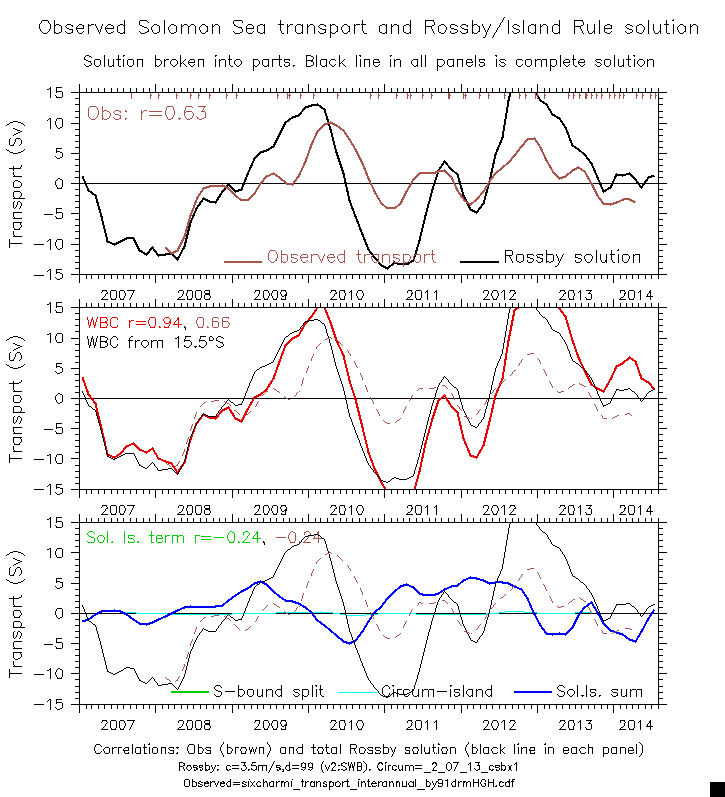
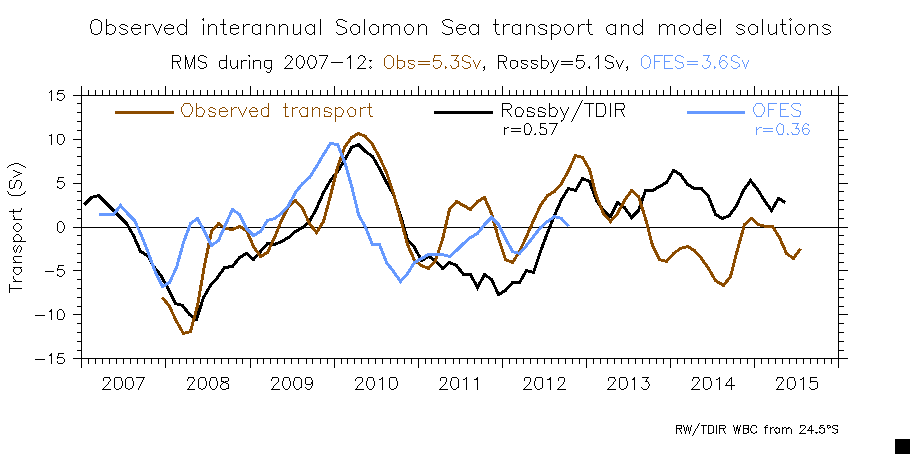
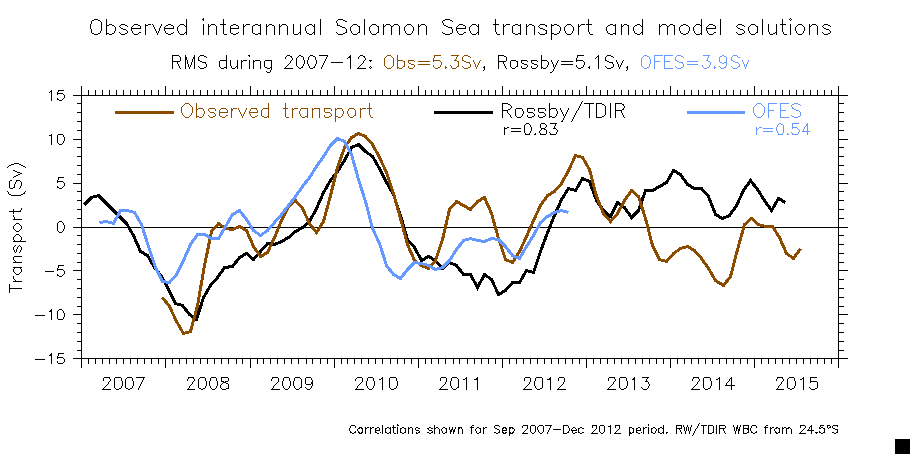
- Rossby solution (in parts) and observed Sol.Sea transport
- Later Rossby/TDIR work (Nov-Dec 2014)
Same 1987-2013 CCMP-ASCAT winds. Updated/improved glider transports, further sophistication.
- One experiment rotating the winds to along-Sea: Show region EOFs of interannual along-Sea winds
- Wind documentation (sequences of maps):
- Monthly full curl
- Annual cycle (full and demeaned)
- Interannual curl anomalies (monthly)
- Interannual curl anomalies (quarterly)
- Combined wind/curl, RW h, RW ug to 2014 (Fixcurl)
- Misc: Nino indices overlaid
- Time series of Sverdrup-relevant quantities at 7.5°S, smoothed for low frequencies
(V_Ek, Vg_RW, V_Sv, V_IR (area-average curl), TDIR V_SolSea)
- Classes of Rossby-TDIR solutions:
- Effect of damping term (fraction of wind forcing left after damping): 24-month damping 48-month
- WBC/Direct/Sol Is (4-way) split, no circumisland term:
V2: uses Rossby ug input only for SI:
c=2.5m/s c=3.0m/s c=3.2m/s c=3.5m/s
- WBC (Incl 12°S in WBC, no "direct")/Sol Is (3-way) split:
V3b:
c=2.5m/s c=3.0m/s c=3.5m/s (Note circum labels are wrong: no circumisland term here)
- WBC (Incl 12°S in WBC, no "direct")/Circum-island corrected/Sol Is (3-way) split:
V4: Includes both ug,vg Rossby transport inputs:
c=2.5m/s c=3.0m/s c=3.5m/s
- V5 (Use RD transports (24-month damping unless noted):
- Speed c: 2.5m/s 3.0m/s 3.5m/s
- Compare damping strength: 24, 48 month, or no damping on one page
- V6 (sixcharmi transports):
| | 2.5 m/s | 3.0m/s | 3.5m/s |
| D = 24mon: | X | X | X |
| D = 48mon: | X | X | X |
| D = None: | X | X | X |
(Also see "What if the WBC integration started at latitude y?" below)
- Compare observed and TDIR-predicted transport for various southern BC latitudes:
7 latitudes (separate plots) Test: zonal inflow only to S.I.
- As V4 but experiment with different coastal averaging for circumisland term (above are 1° from coasts):
All for c=3.0m/s: Coastal gridpoint only 2° from coasts (Slight differences)
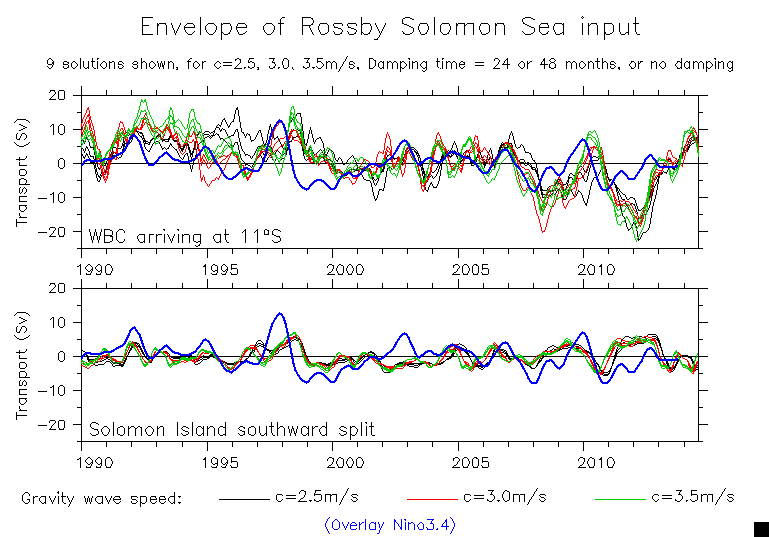
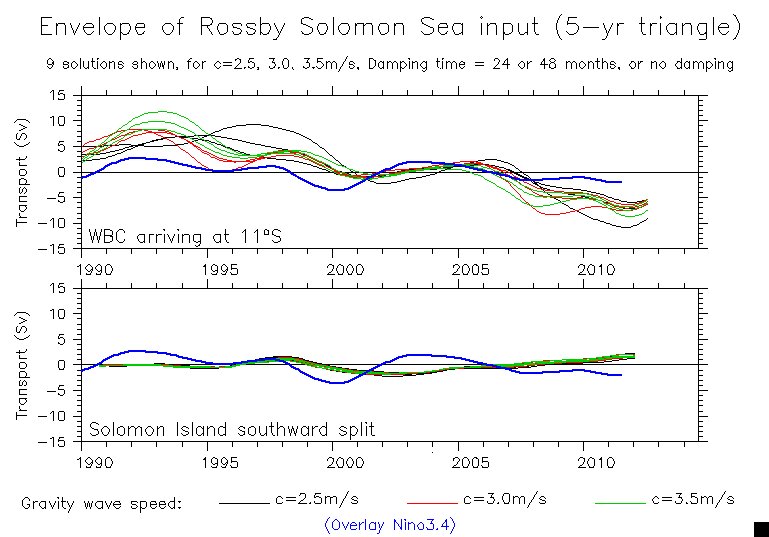
- Damping/speed solution envelopes: 9 solutions Overlay Nino3.4 Low-frequency
- As V4 but for Average Annual Cycle, c=3.0m/s
Add real time to 153042, all curves in 1 panel (sixcharmi only)
For obs through 153042, include Vrw at Sol Sea mouth, WBC from 24.5°S
- TDIR through 2015 (15C006) (all starting latitudes in one file)
- Transport summed through layers (all in one file)
- Seasonal comparison in layers (all in one file)
- Rossby Sol Sea inflow and Nino3.4
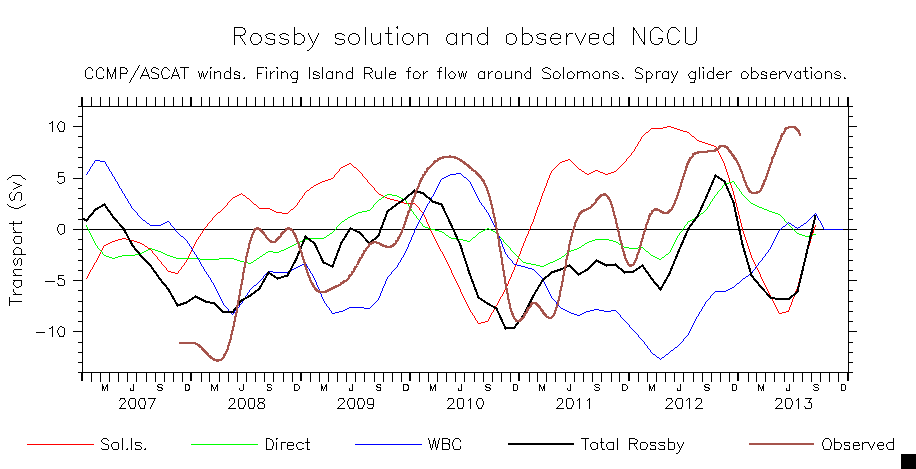
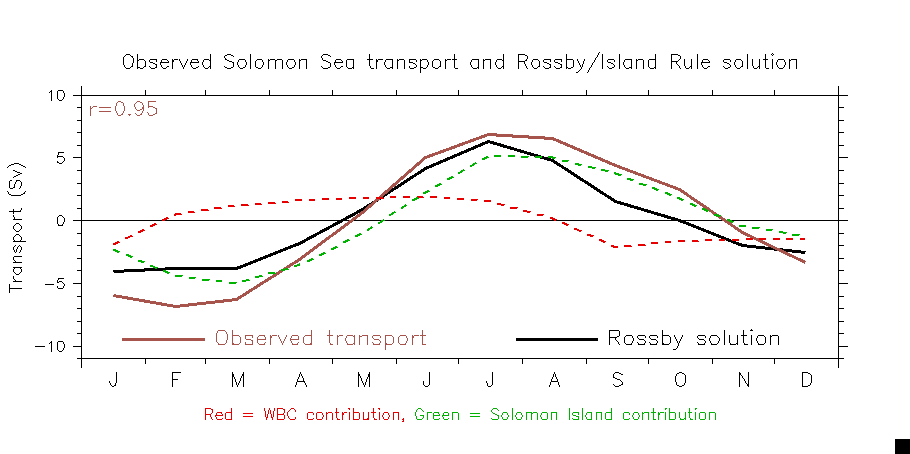
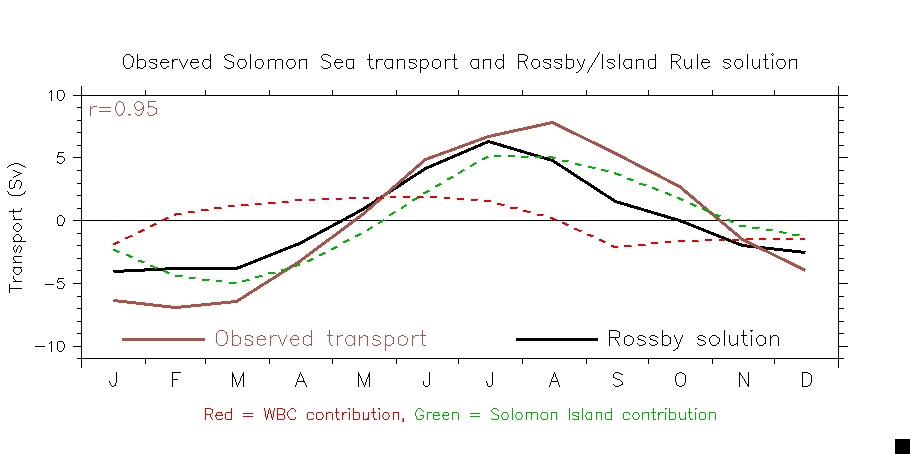
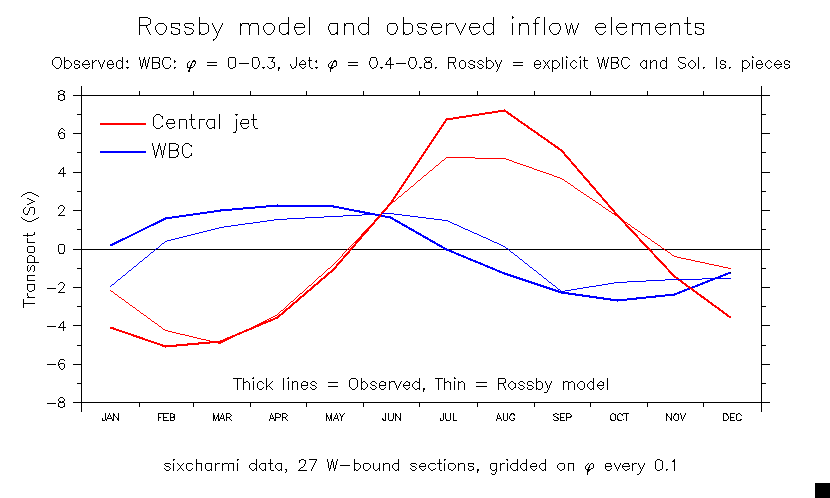
- Rossby Sol Sea inflow elements and corresponding observations
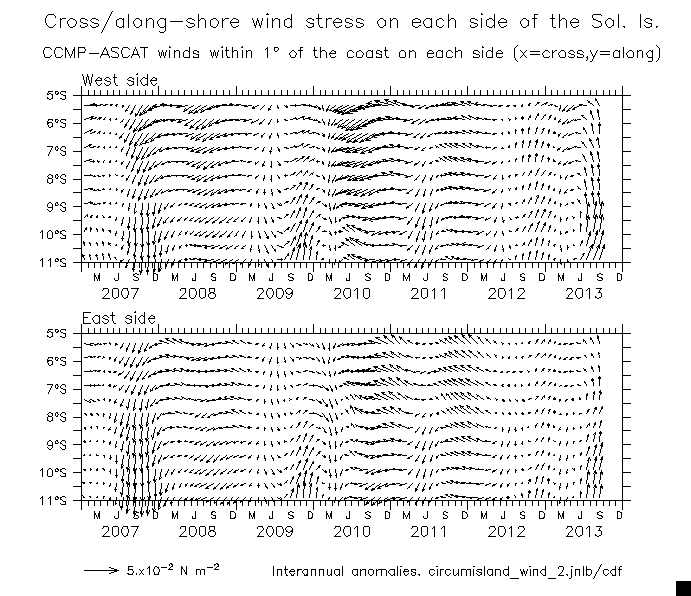
- Circum-island wind term: Interannual, both sides Annual and interannual differences
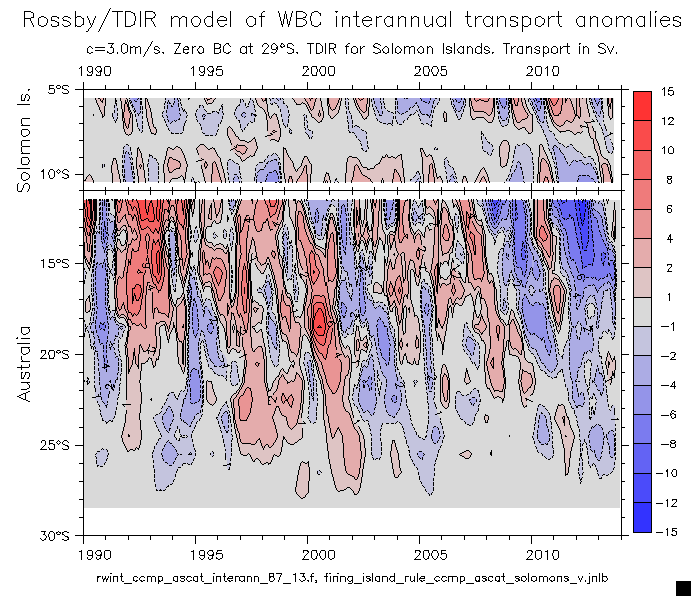
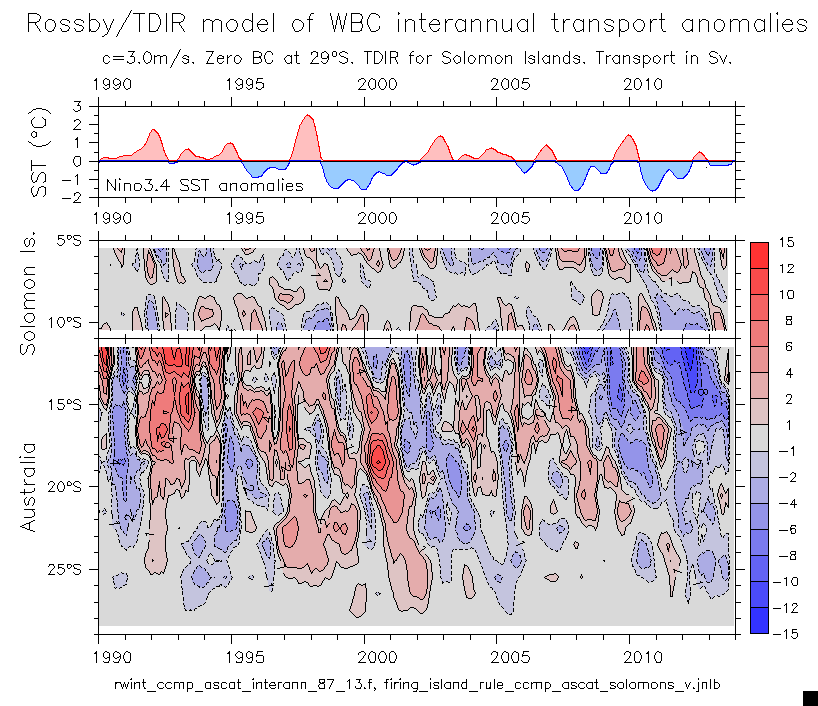
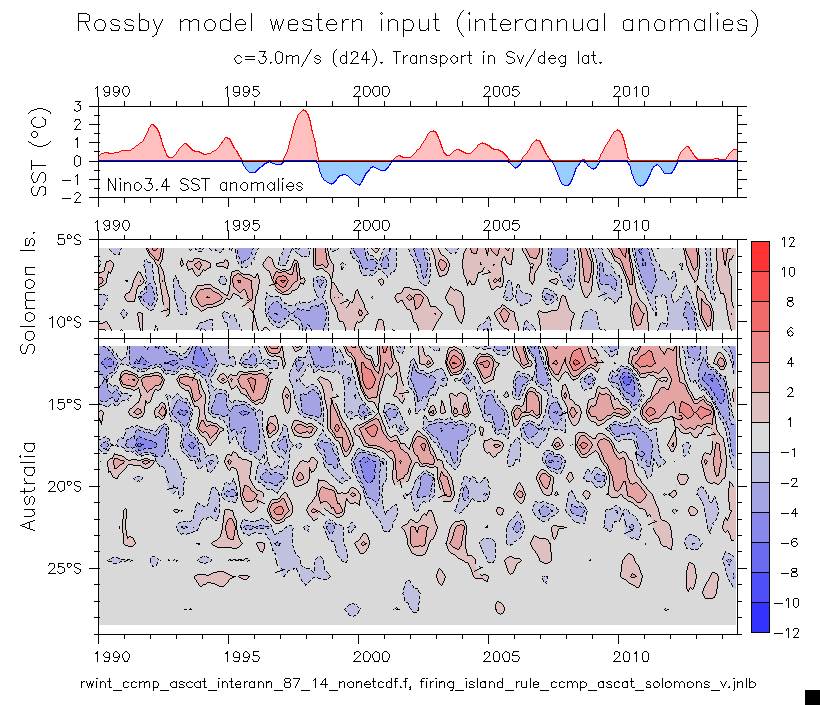
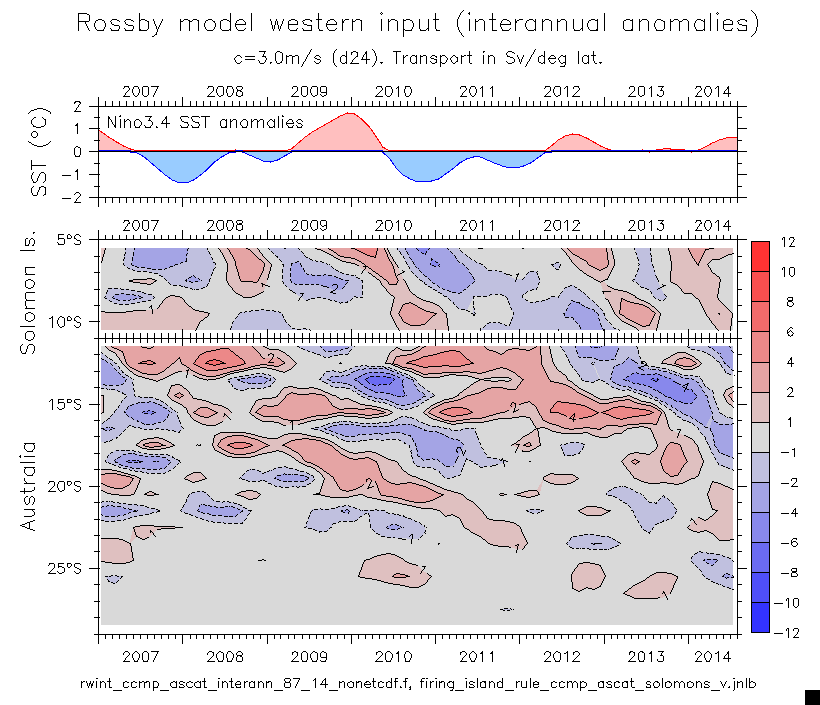
- Rossby-implied WBCs:
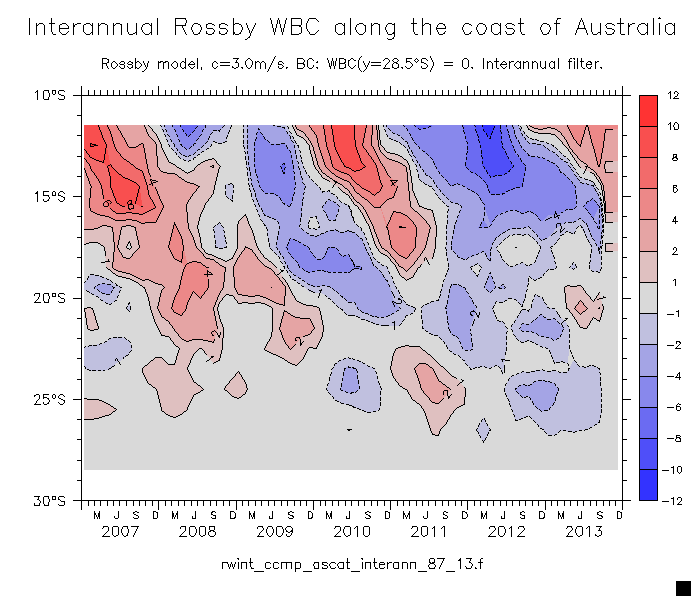
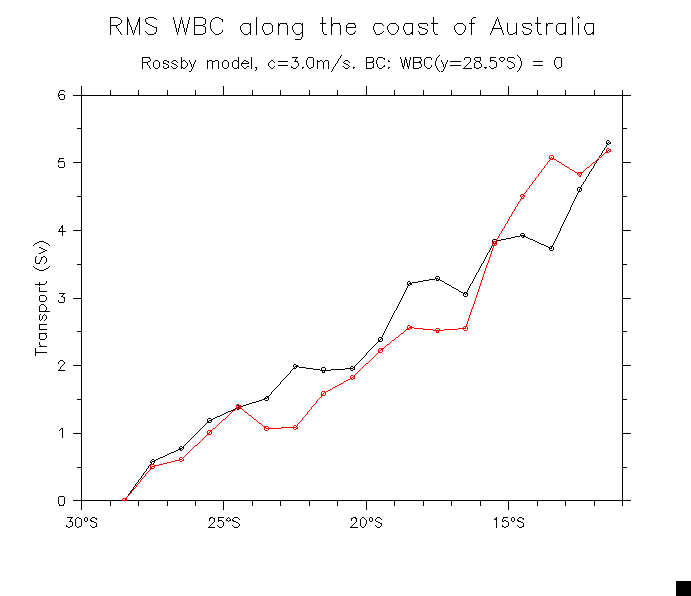
- Coast of Australia (simple Rossby mass balance with zero BC at 29°S):
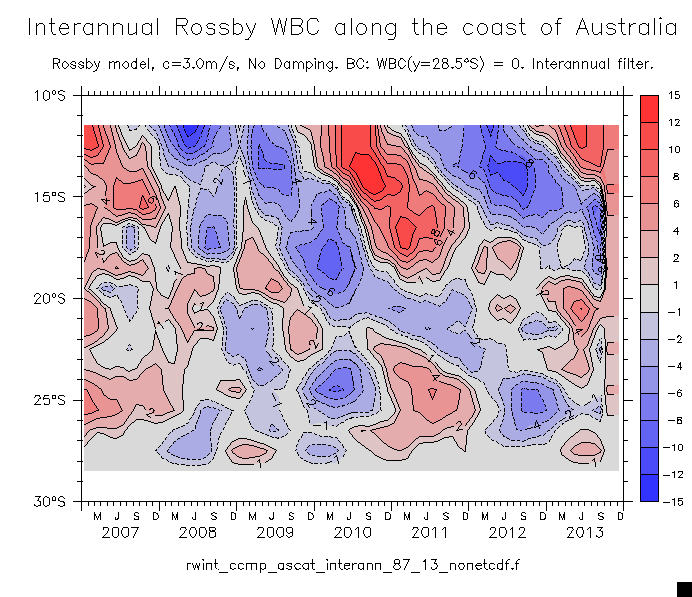
- WBC interannual anomalies Combined u_rw and WBC
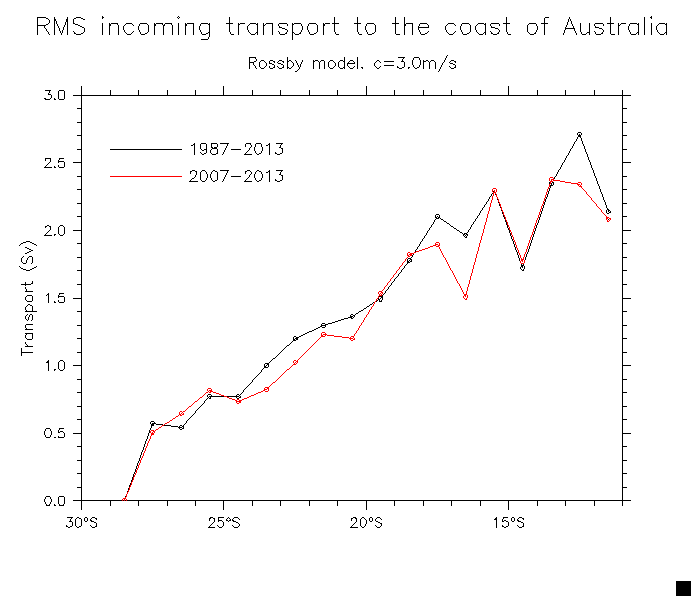
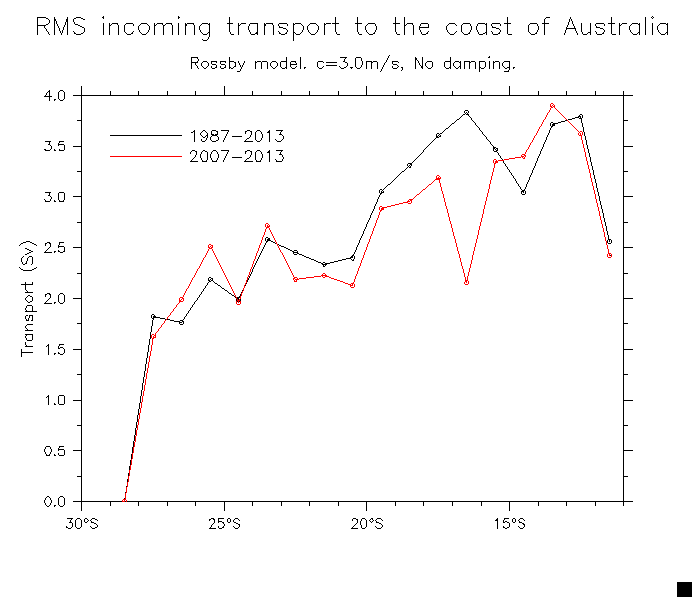
- RMS transport: Incoming transport WBC
No-damping comparisons: Incoming WBC
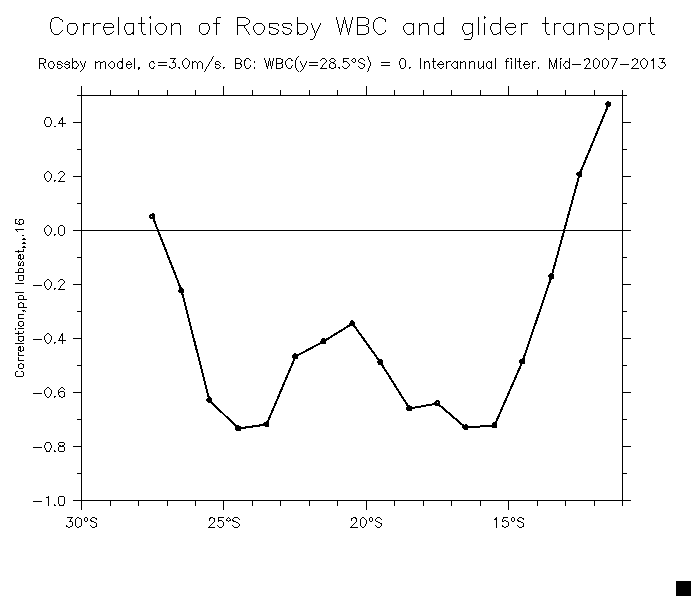
- Correlation of Australia coast WBC with glider transport
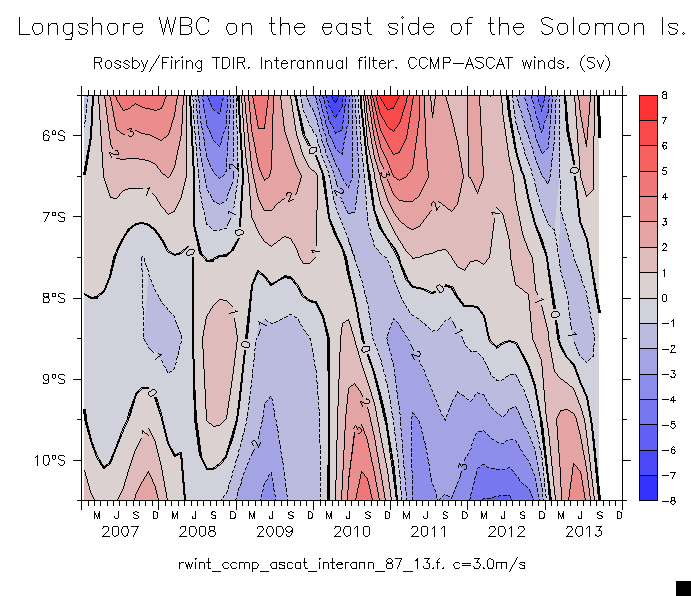
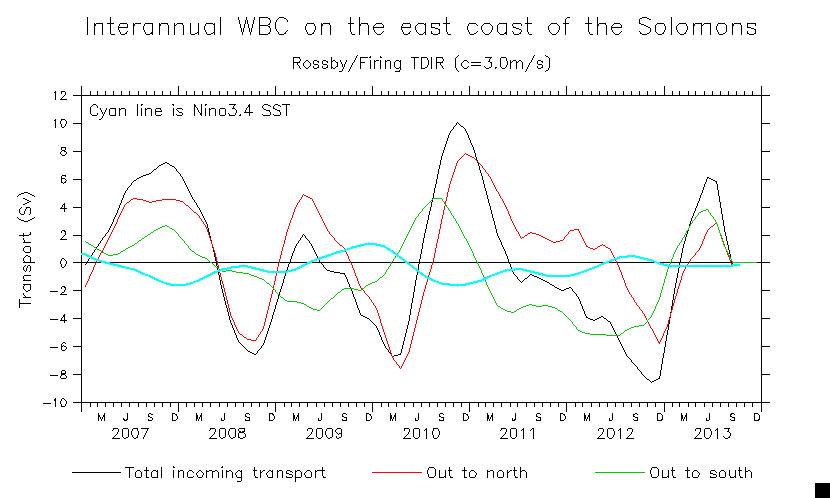
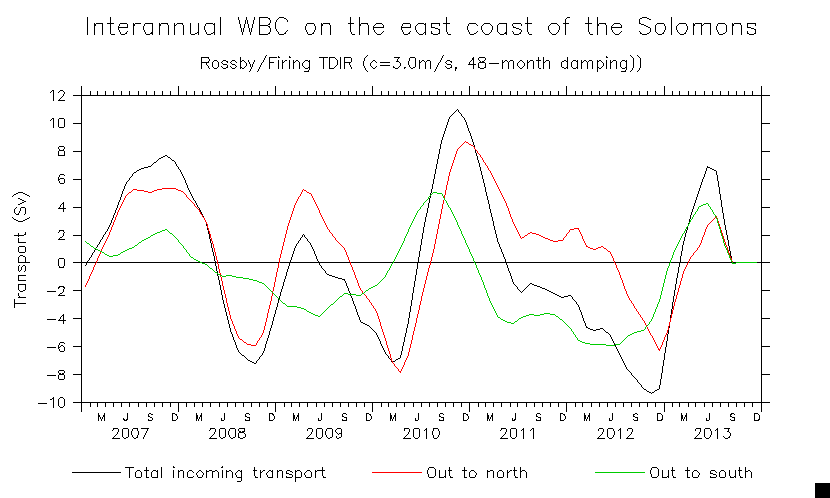
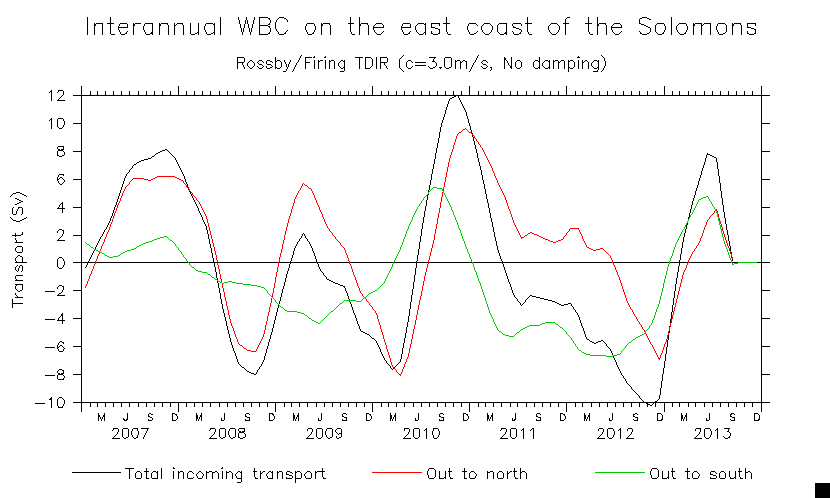
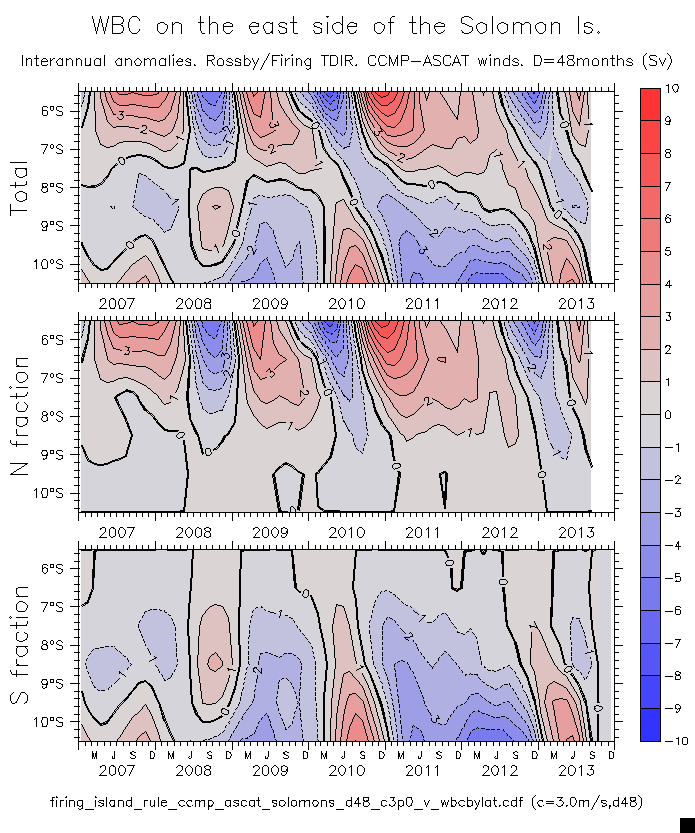
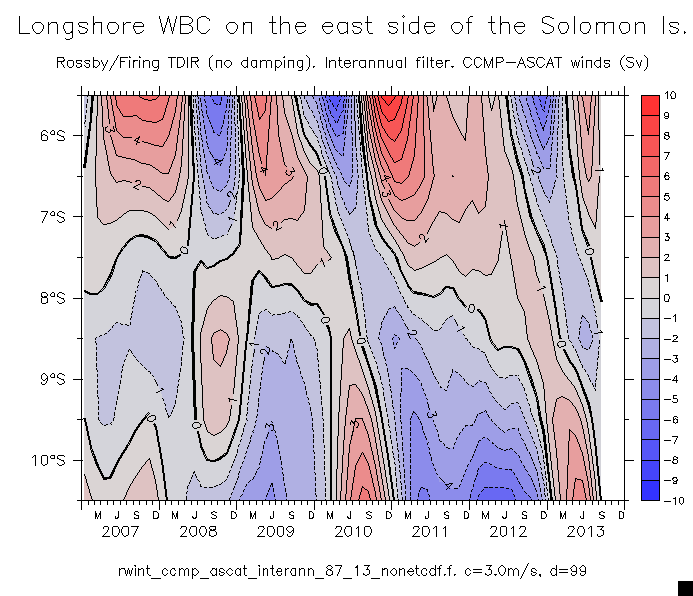
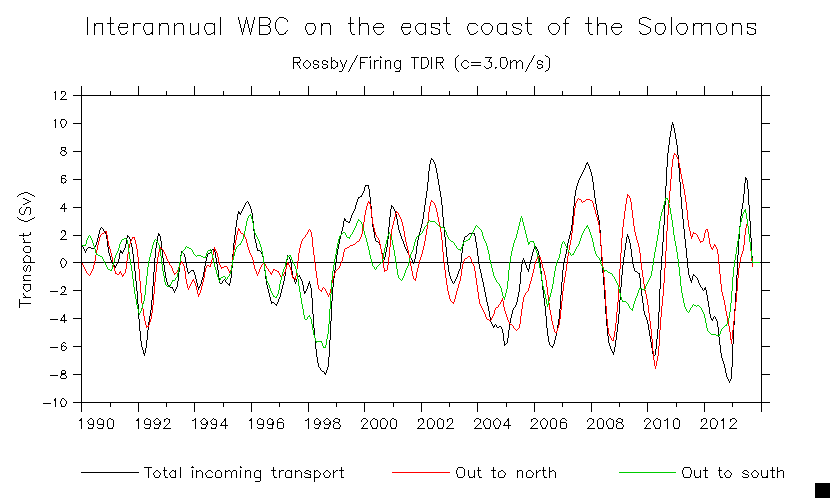
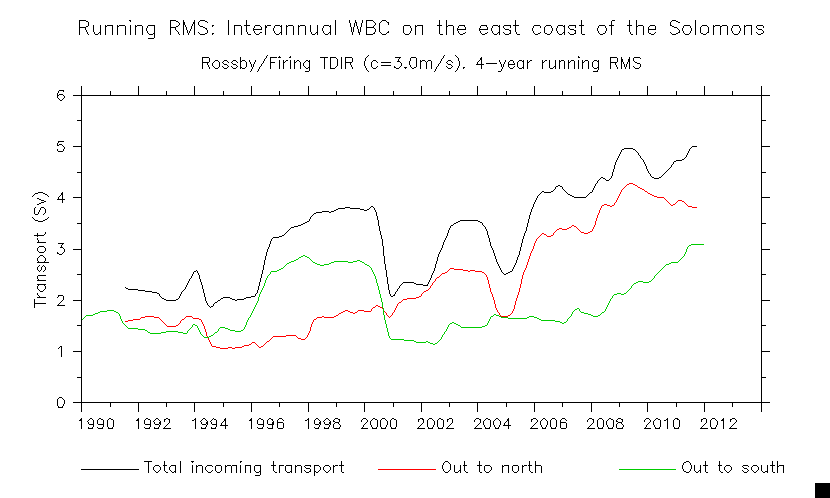
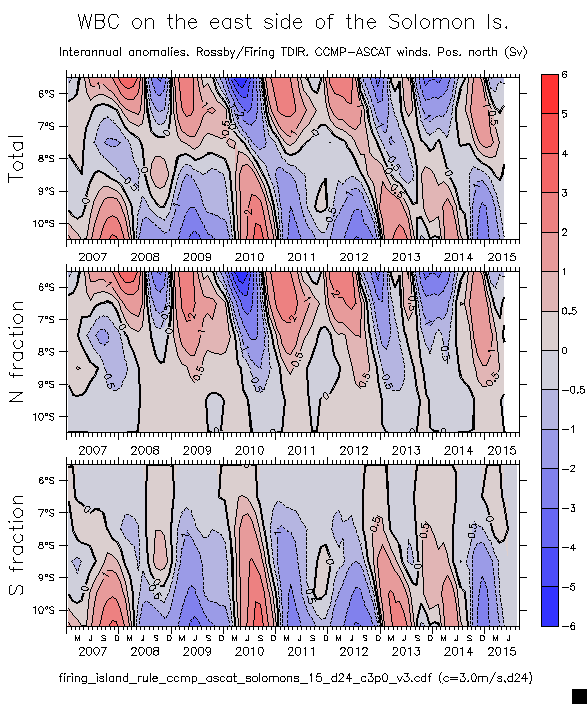
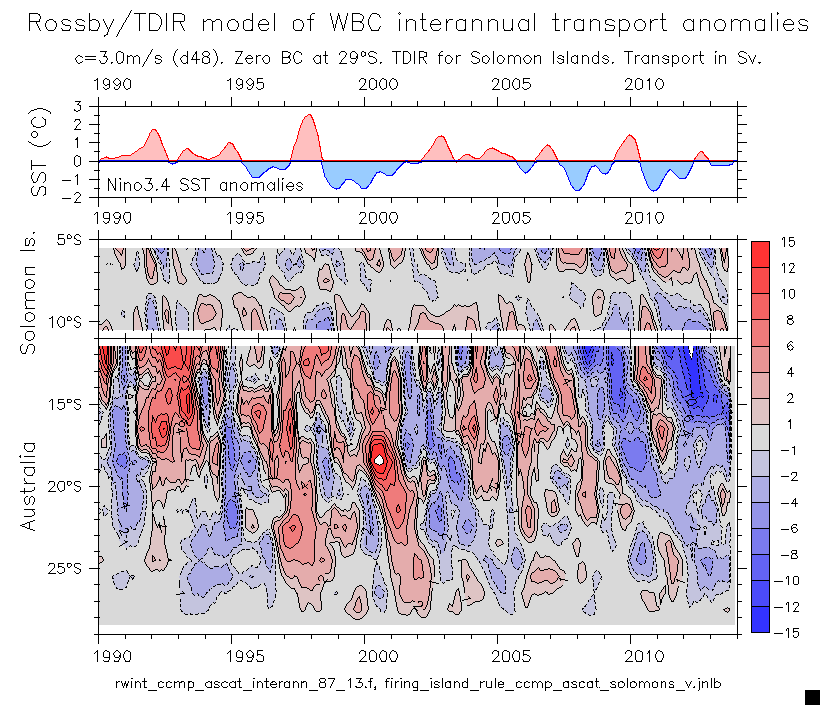
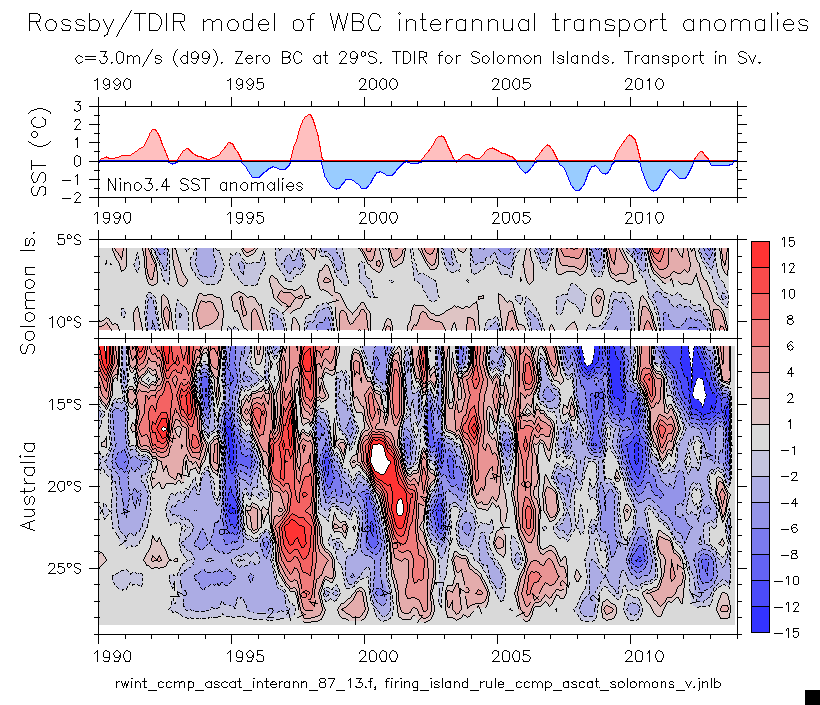
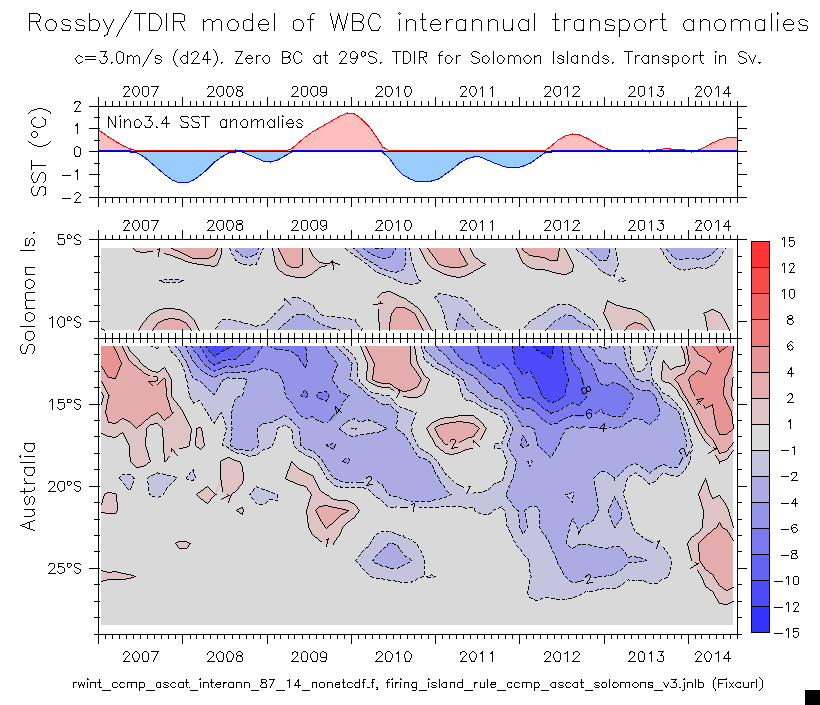
- WBC on the east coast of Solomons (TDIR):
- WBC interannual anomalies
- Details: Show N,Sbound split (y,t) Incoming and split transport totals Overlay Nino3.4
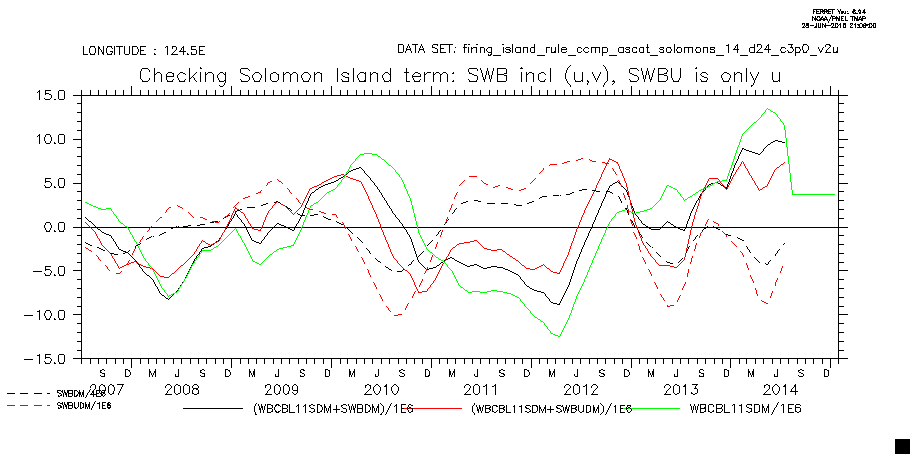
Checking using full cross/alongshore terms
- Damping comparison:
- Incoming and split totals: 48-month damping No damping
- S,Nbound split (y,t): 48-month No damping
- Extend back to 1990: Incoming and split transport Overlay Nino3.4 WBC(y,t)
Low-frequency: 25-month running mean Overlay Nino3.4 4-year running RMS
- SI WBC extended to mid-2015
- WBC on outer coasts of both Australia and the Solomon Islands (TDIR):
- Early run to 2013: WBC 1990-2013, include Nino3.4
- Damping comparisons: 48-month damping No damping
- Incoming URW: 1990-2014 2007-14
- WBC 2007-2014 (FC)
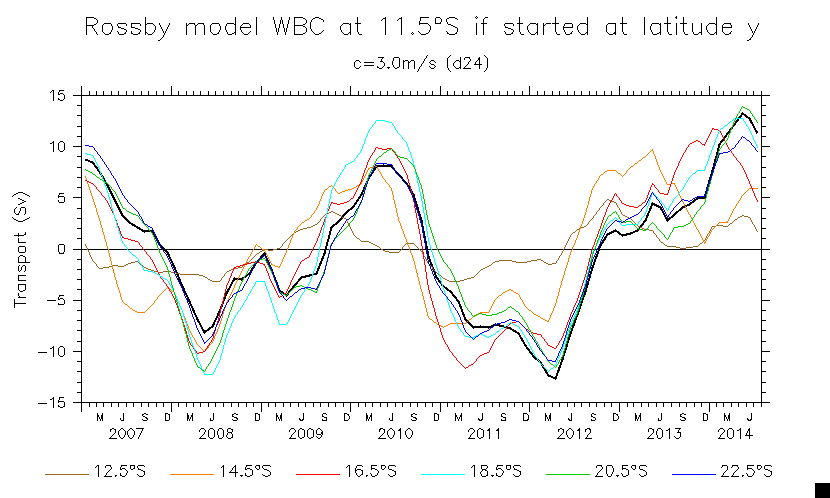
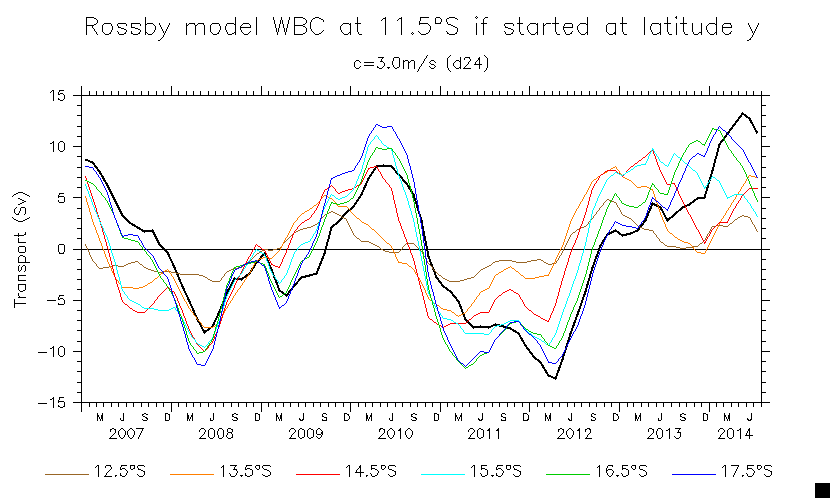
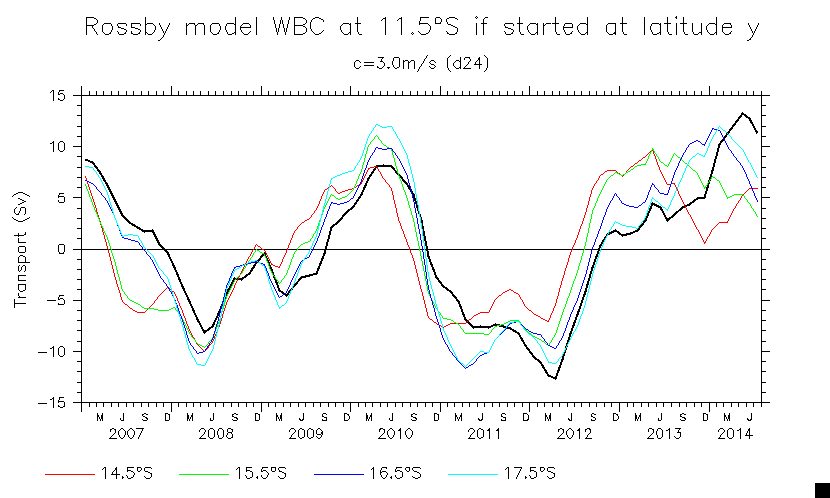
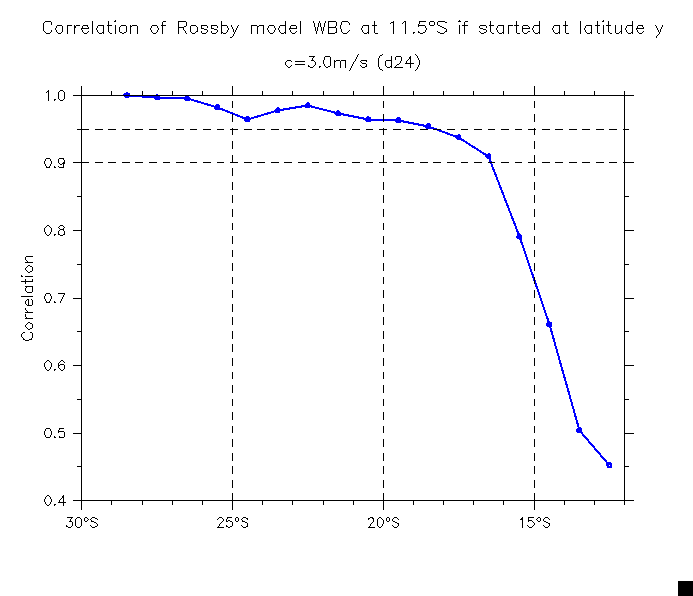
- What if the WBC integration started at latitude y?
- Time series overlaid: 12.5-22.5°S by 2° 12.5-17.5°S by 1° 14.5-17.5°S by 1° (most relevant)
- Correlation (of WBC with itself starting at 28.5°S, I think)
Correlation of TDIR solution with obs for different starting lats
- Solutions for latitude/c/damping choices compared to observations
Add 3 realtime missions through 153042
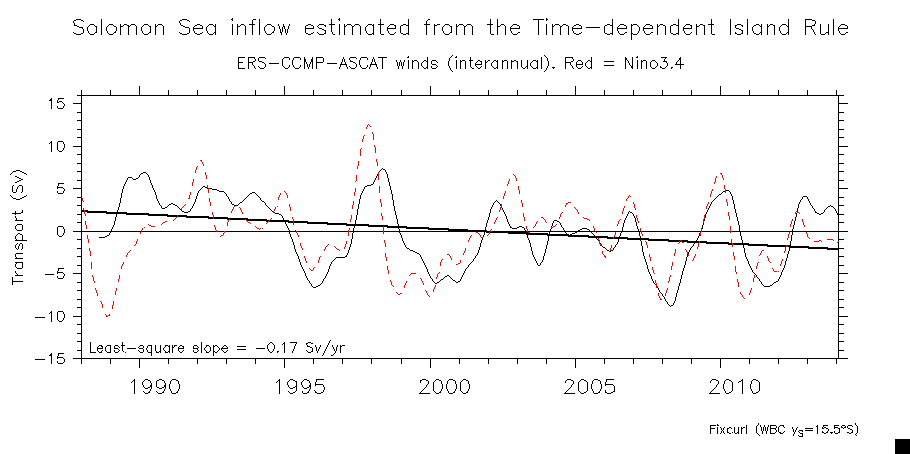
- Solutions for y_s=15.5°S (overall best):
c=3.0m/s, D=24 c=3.5m/s, D=24 c=3.0m/s, D=48 c=3.5m/s, D=99
- Update for realtime through 153042. Also include Vrw contribution at Sol Sea mouth:
- Interannual
- Annual cycle
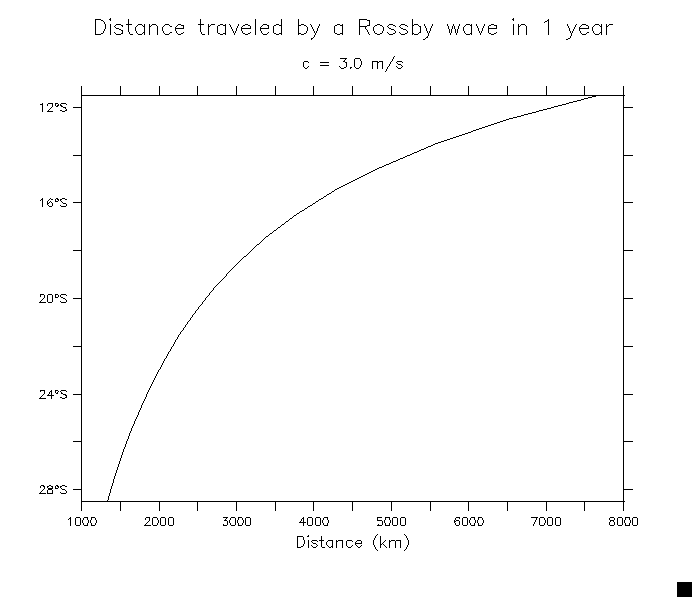
- Distance traveled by a Rossby wave in 1 year
- TDIR Solomon Sea inflow back to 1987
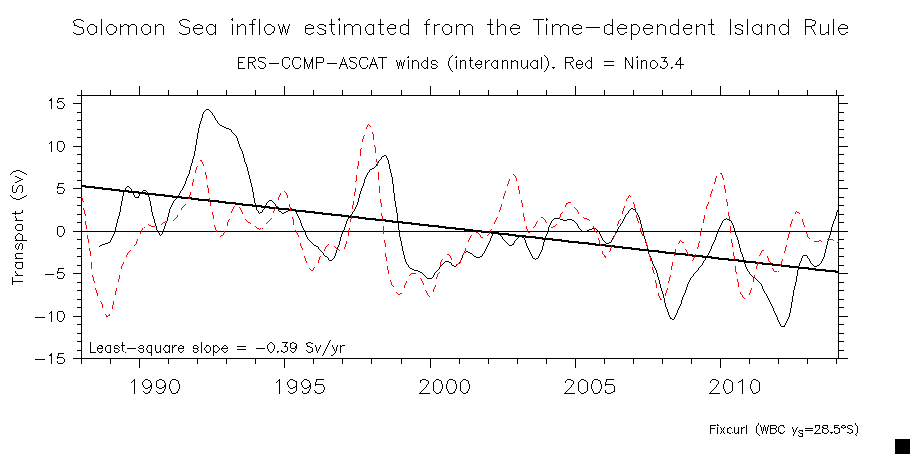
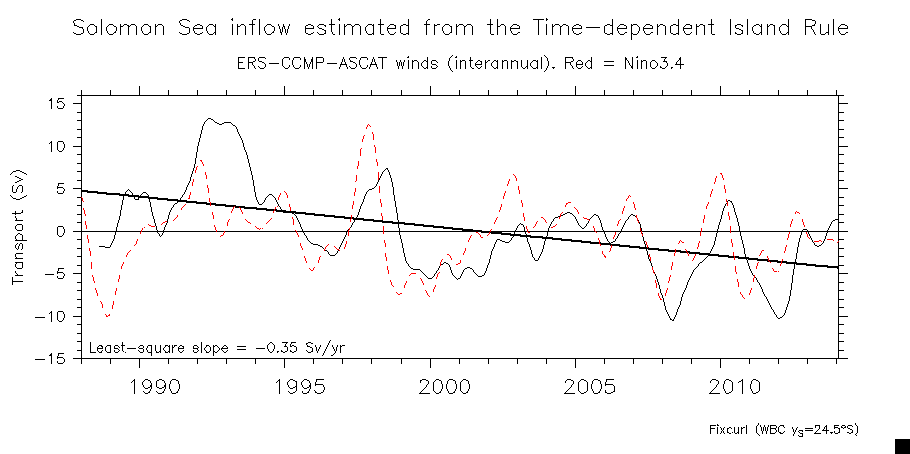
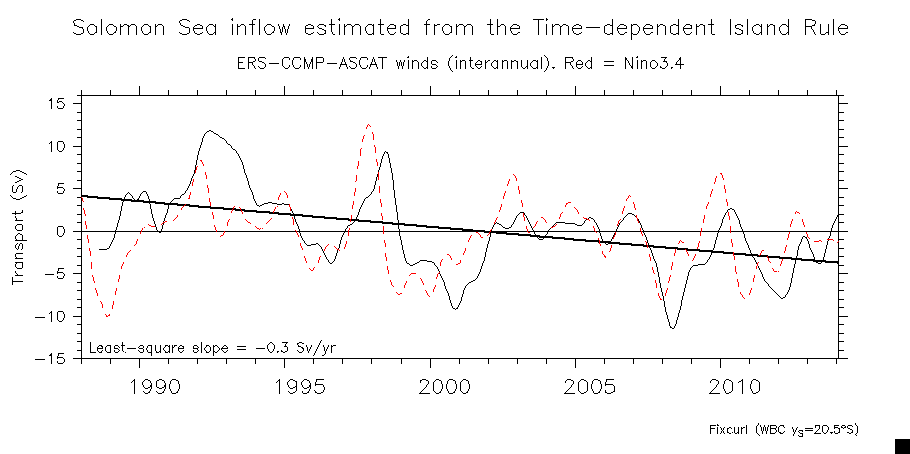
- Time series for different southern BC choices (FC):
28.5°S 24.5°S 20.5°S 18.5°S 15.5°S
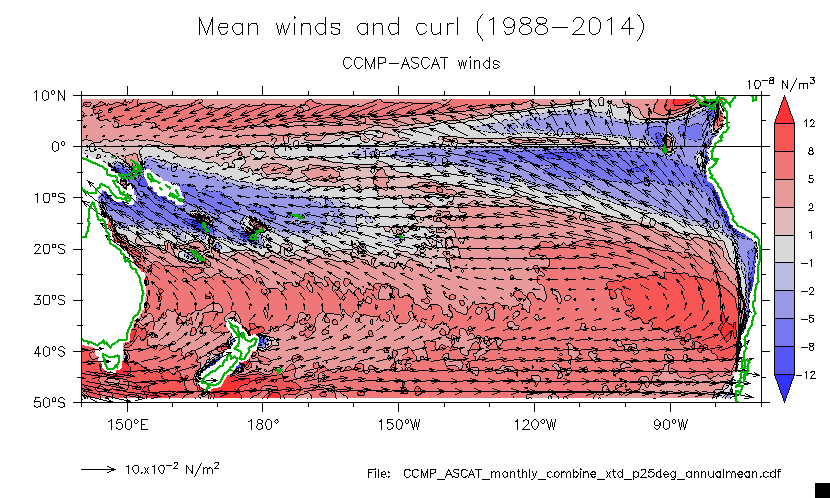
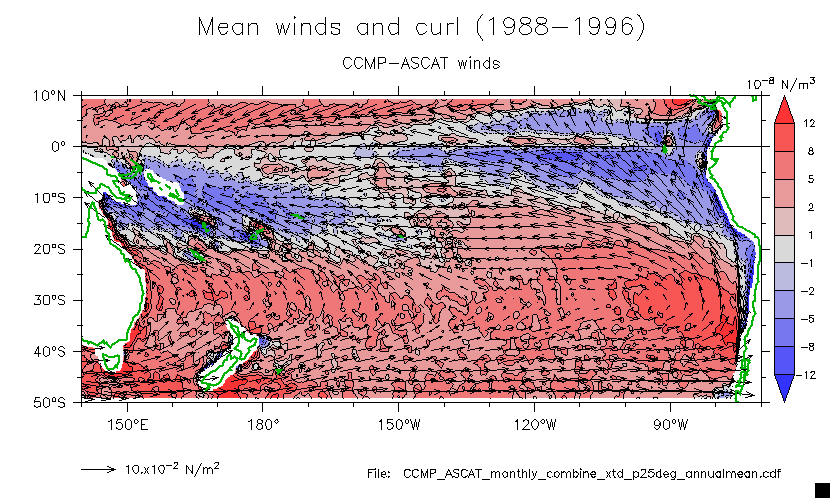
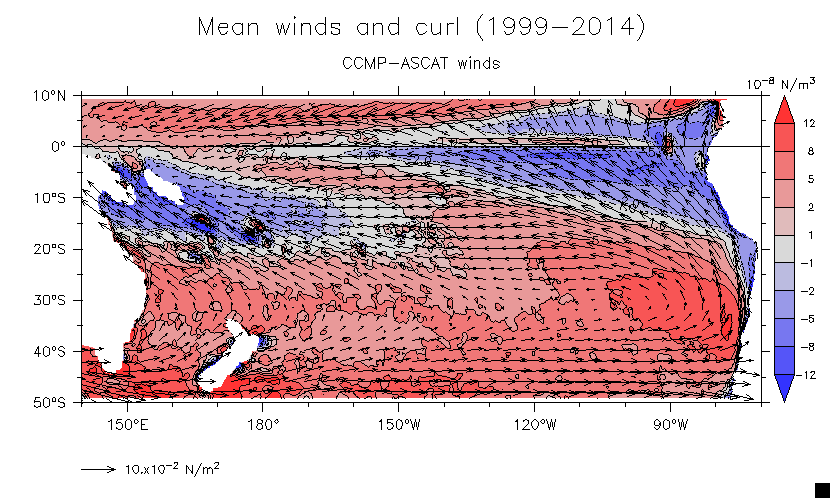
- Wind/curl era-mean maps:
1988-2014 1988-1996 1999-2014 Difference
- Another way to look at it:
Time-dependent IR soln: Au-S.A. / NZ-S.A. / S.I.-S.A. / Au-S.I. /tdir AU-NZ
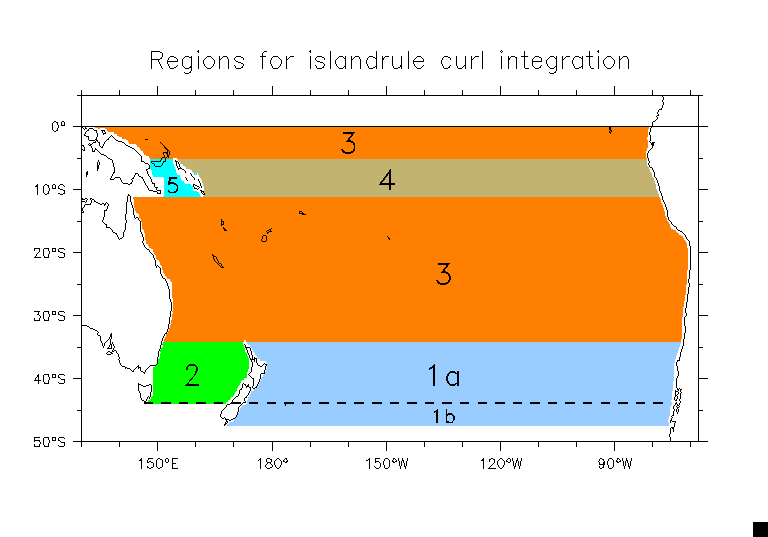
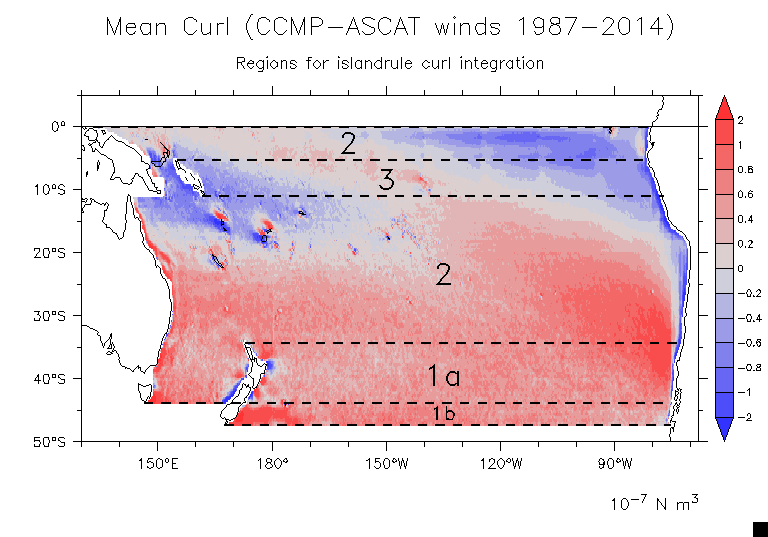
- Mean currents from these winds (Island Rule):
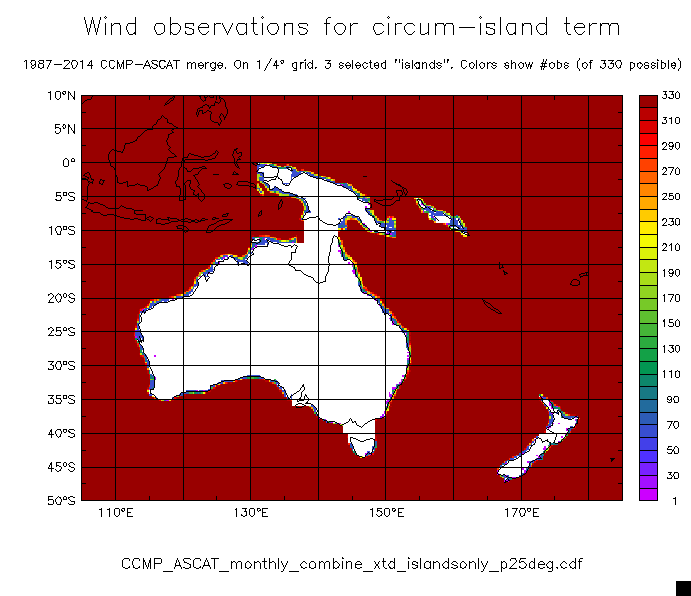
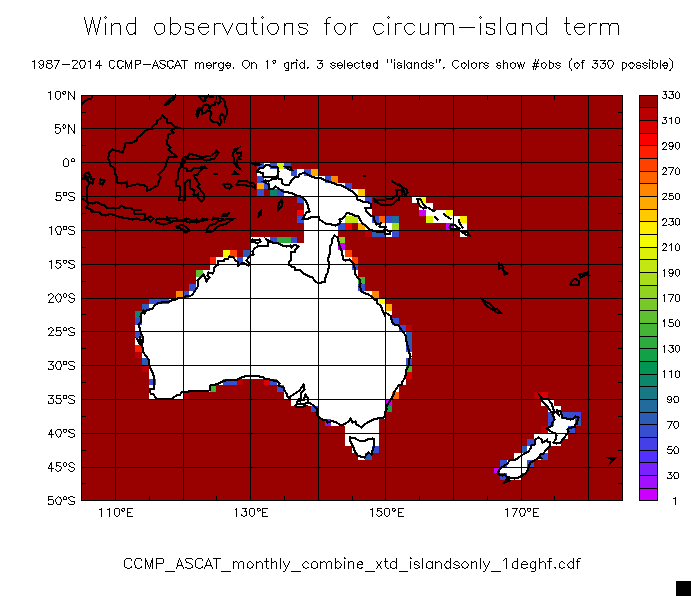
- Island Rule calculation details (circumisland term):
- Winds observations if gridded ... Original (1/4°) On 1° grid
- Relevant regions: Block colors Lines over mean curl
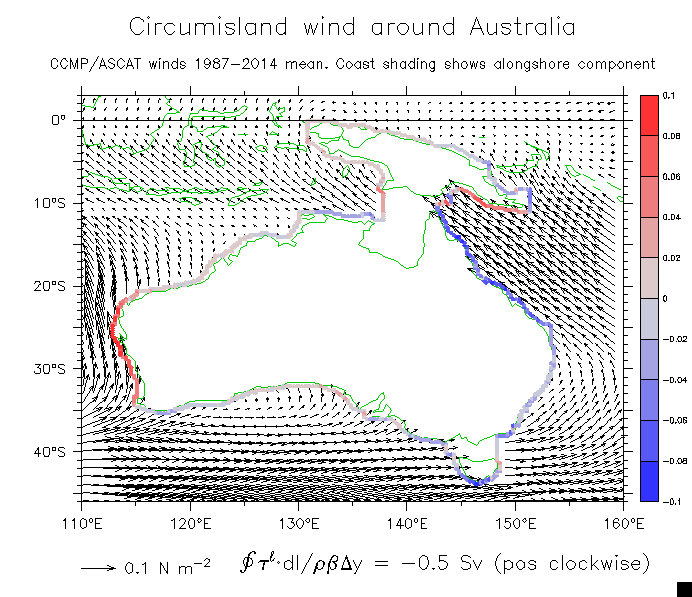
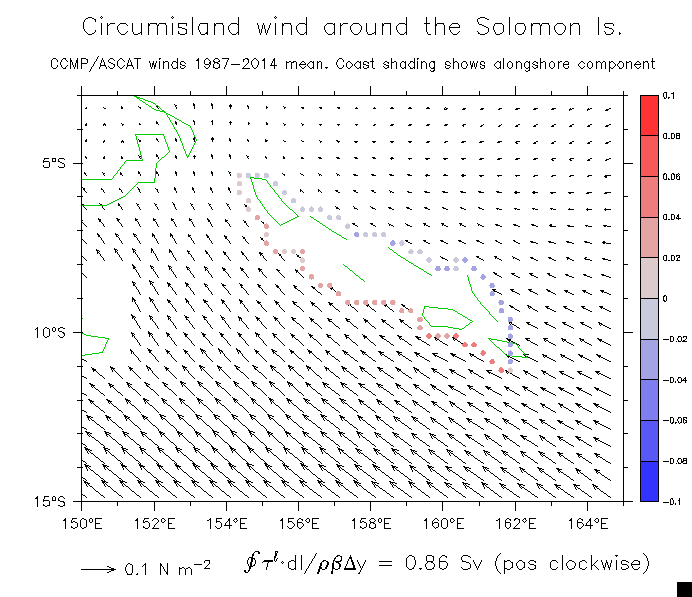
- Circum-island wind terms: NZ Australia Solomon Islands
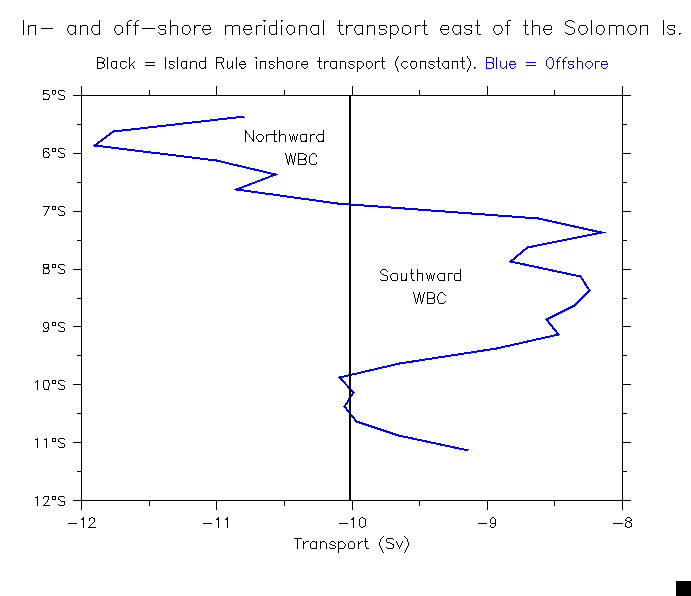
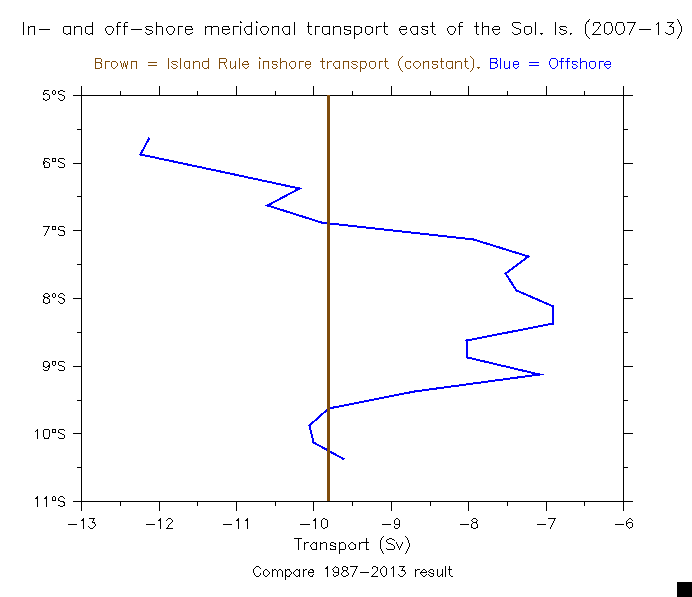
- Mean WBC along the east coast of the Solomons (Result for 2007-13 winds)
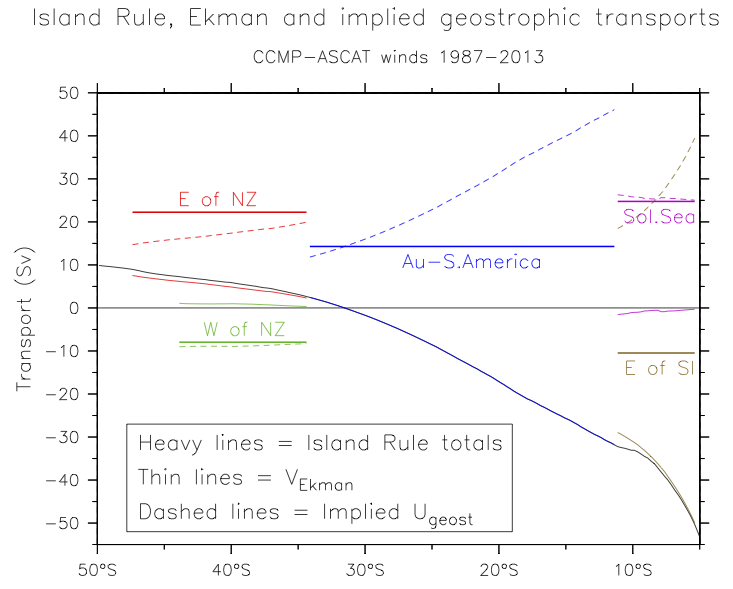
- Results (Transport relative to S. America (Sv)):
| Region | Circum-Is. term | Curl term | Total | Direction |
| NZ | –0.18 | 22.43 | 22.25 | Northward |
| Solomons | –0.86 | –9.61 | –10.47 | Southward |
| Australia | 0.50 | 13.79 | 14.29 | Northward |
| Au if no NZ | 0.50 | 11.78 | 12.28 | Northward |
Notes:
14.29 – 22.25 = –7.96 (southward) between NZ and Australia
14.29 – (–10.47) = 24.76 (northward) between Solomons and Australia
ITF = 14.29 Sv
Interior transport inside Solomon Sea ~ –2Sv (southward)
- Find the Ekman and implied geostrophic currents: V_g = V_IR – V_ek
(Ekman from the same winds as the Island Rule in j.1,2,3 above.)
- I.R, Ekman and implied Vg (transport integrals)
Sol. Sea Vek (hence Vg) is nearly constant with latitude because wind strength decreases to the north in the Sea, at almost the rate of f.
- At 7.5°S the coast-to-coast integrals are:
| Region | I.R. | V_Ekman | V_geost |
| E of S.I. | –10.47 | –38.62 | +28.15 |
| W of S.I. | +24.76 | –0.80 | +25.55 |
Note that at 7.5°S, V_g between S. America and the Solomons is nearly the same as that inside the Solomon Sea (the two are equal near 8.25°S).
About 48% of the geostrophic transport from the S. Pacific to the equator flows through the Solomon Sea.
- Figures from Qingdao and UW talks (Oct and Dec 2015)
- OFES comparisons: Full-depth OFES OFES to 700m
- Obs transport and TDIR solution: Interannual Annual cycle (pdfs)
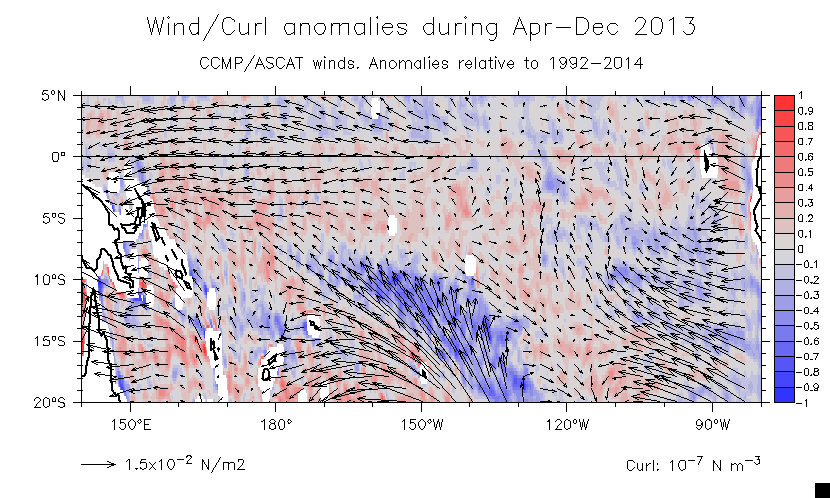
- Winds and curl in late 2013