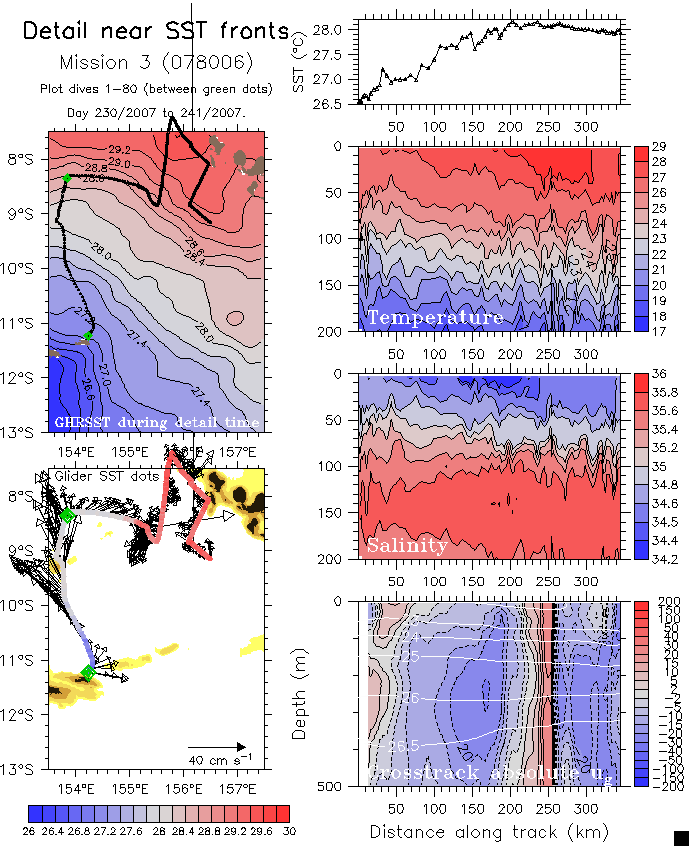
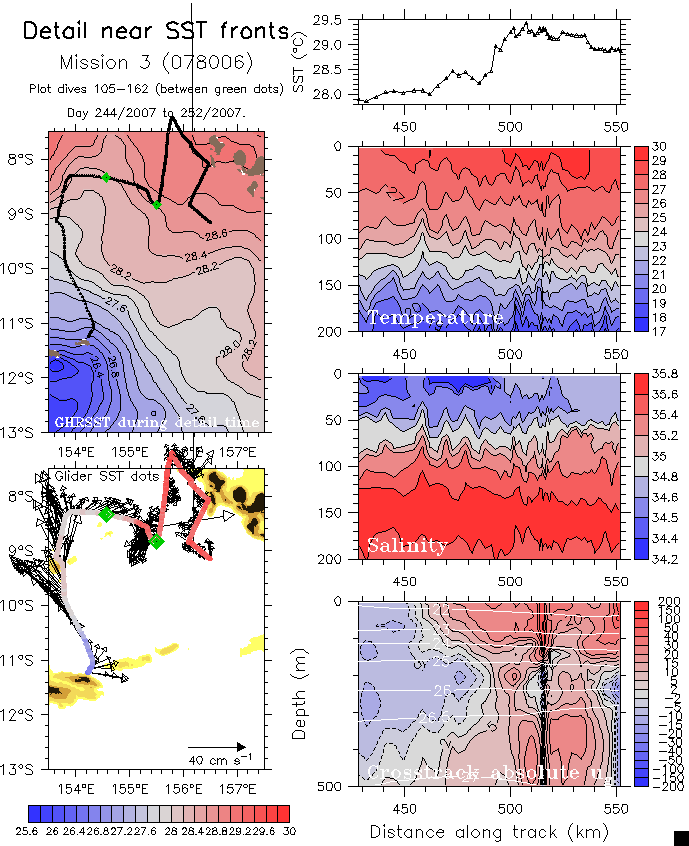
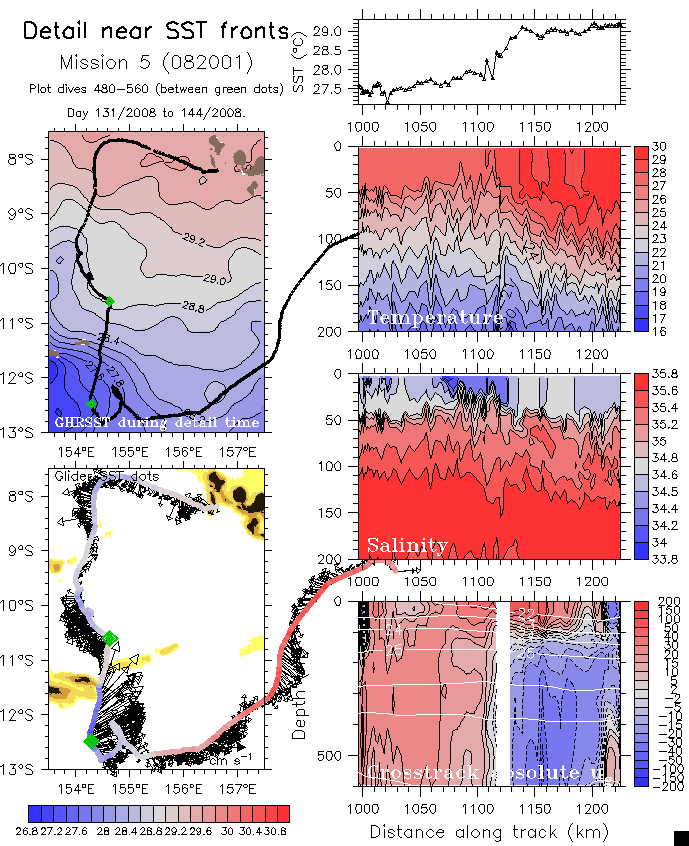
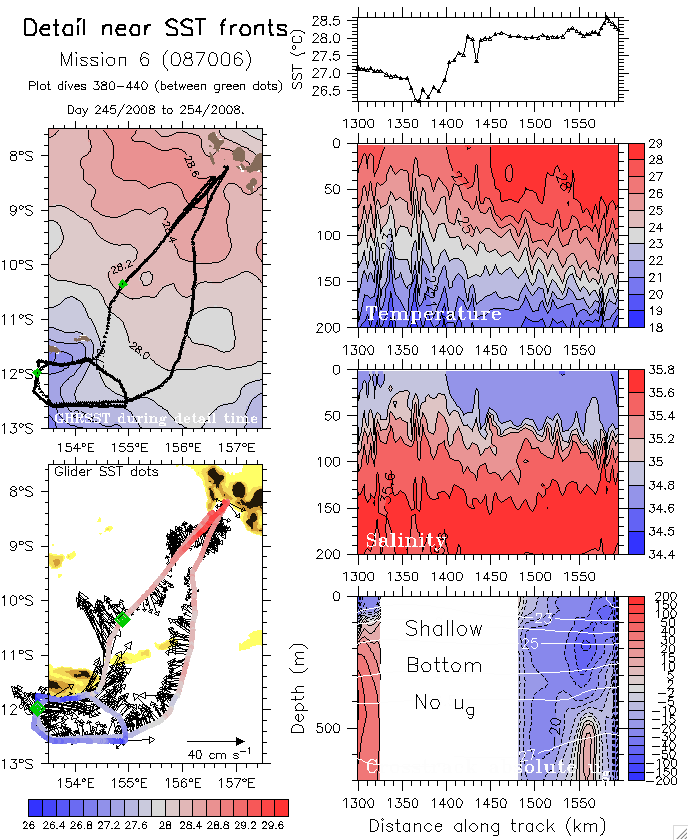
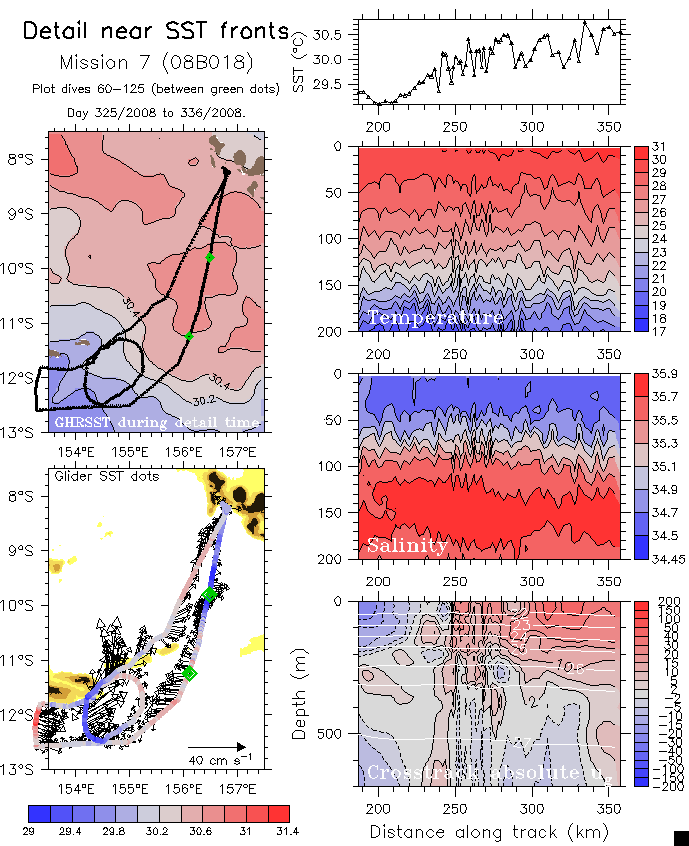
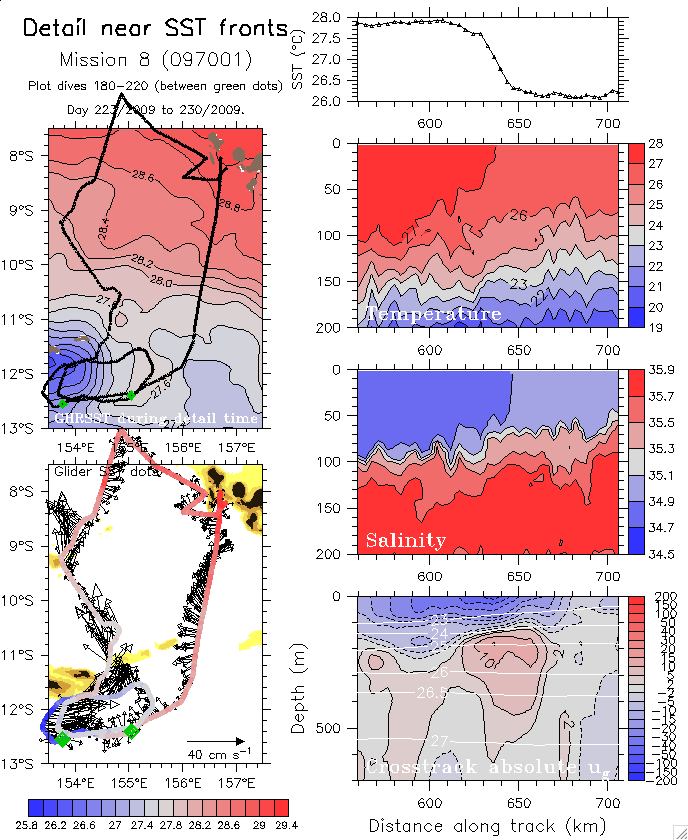
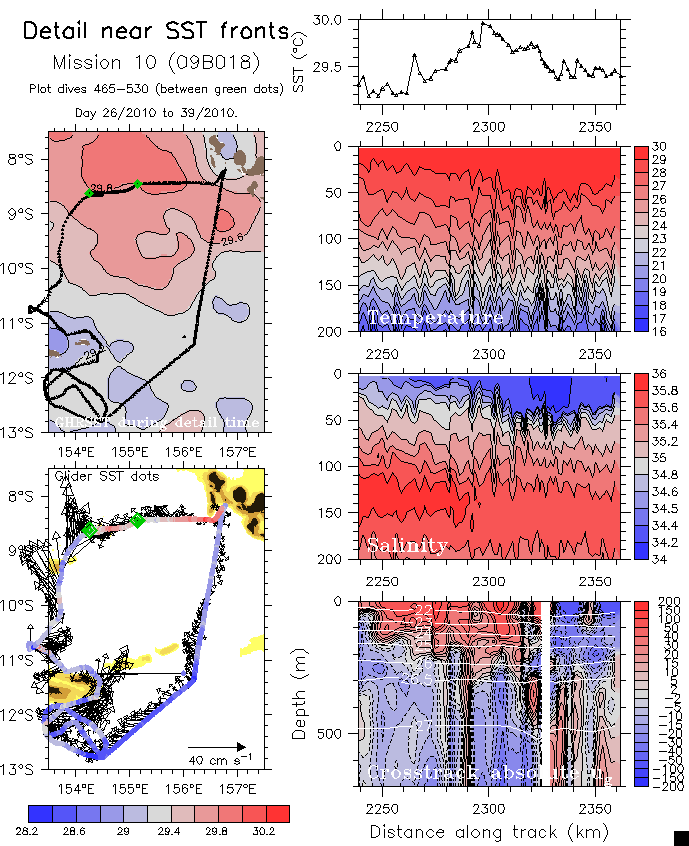
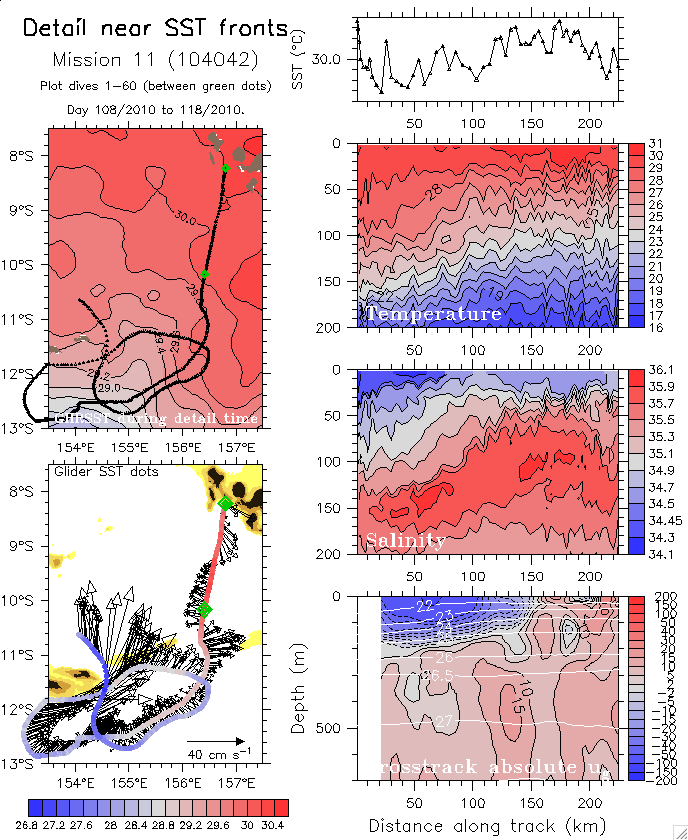
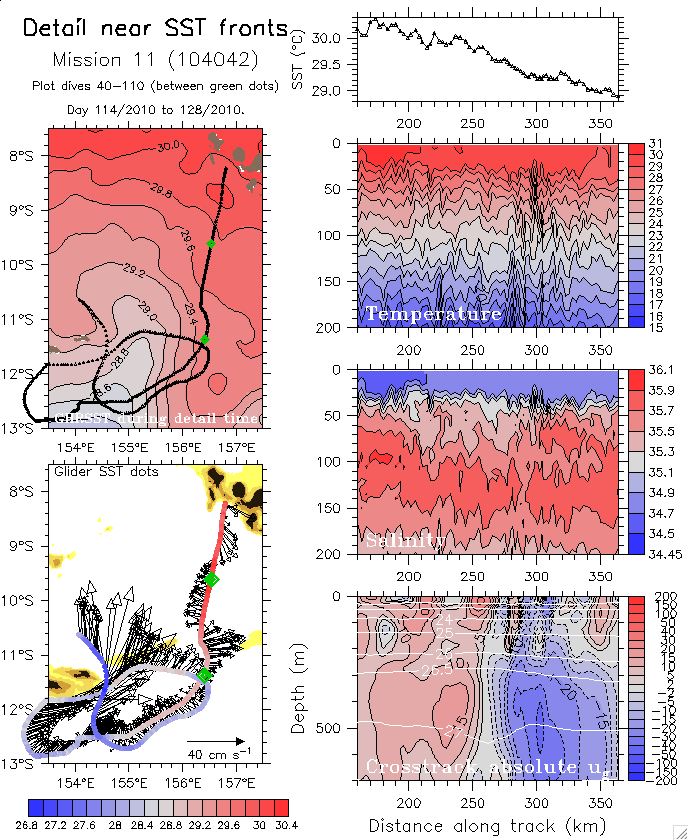
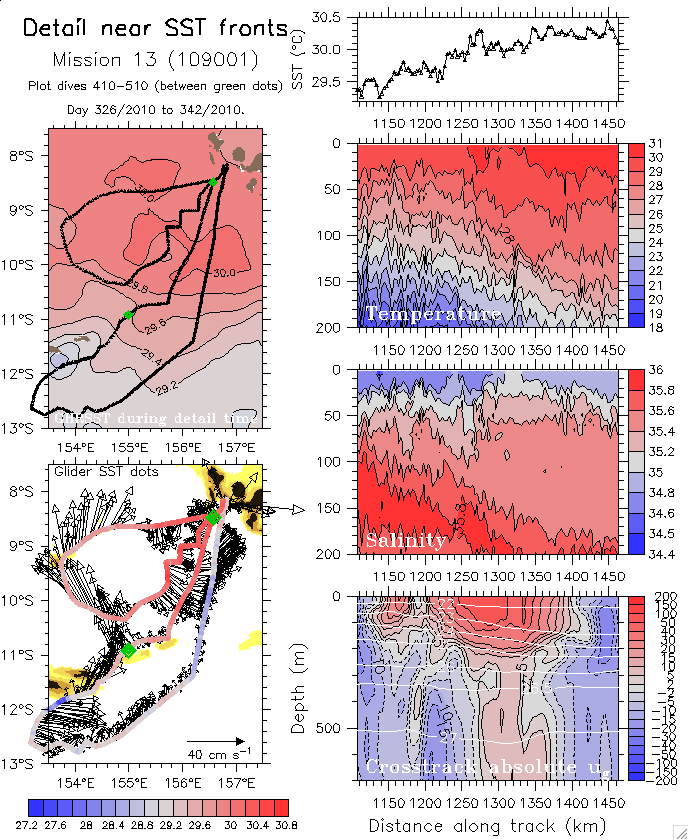
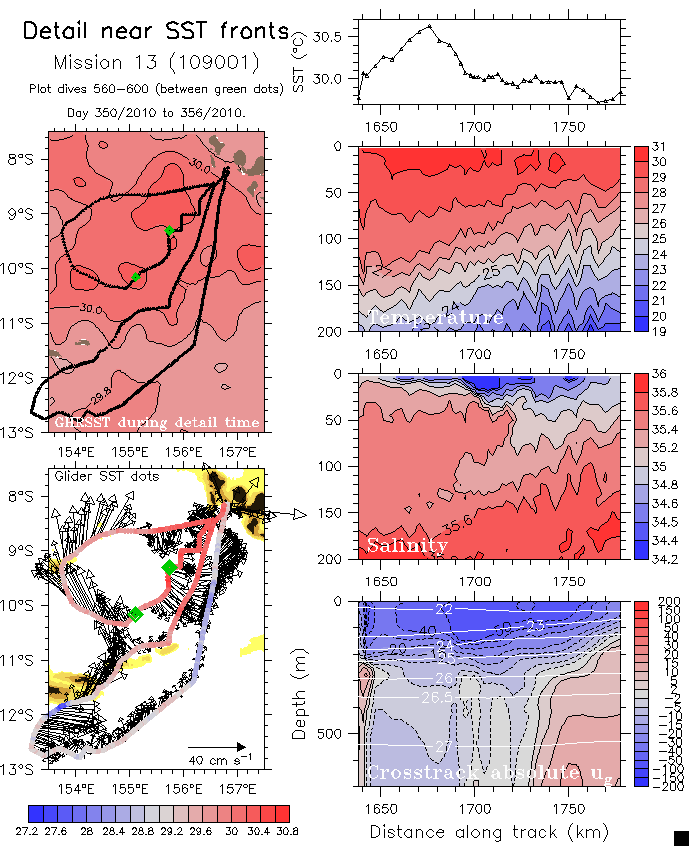
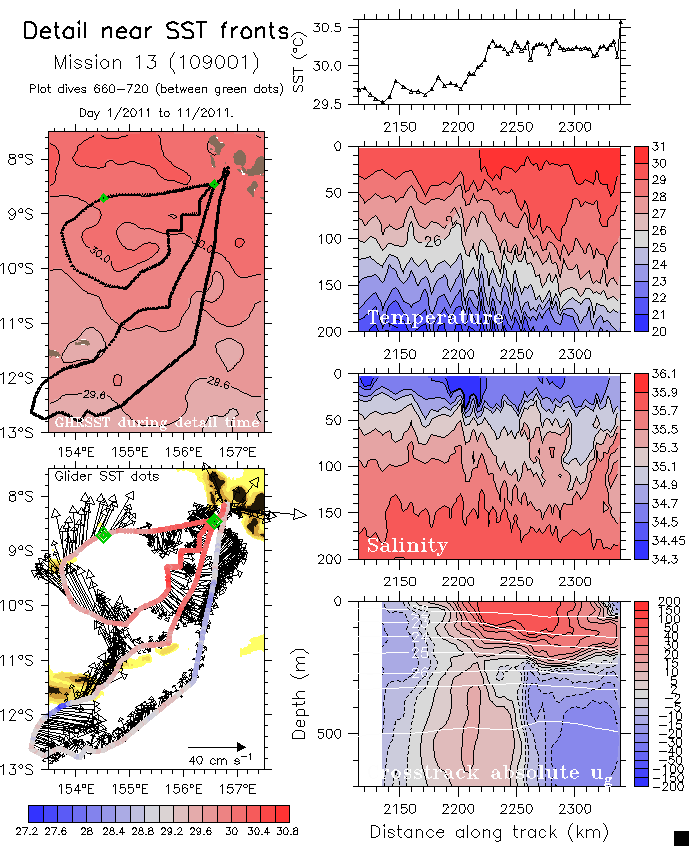
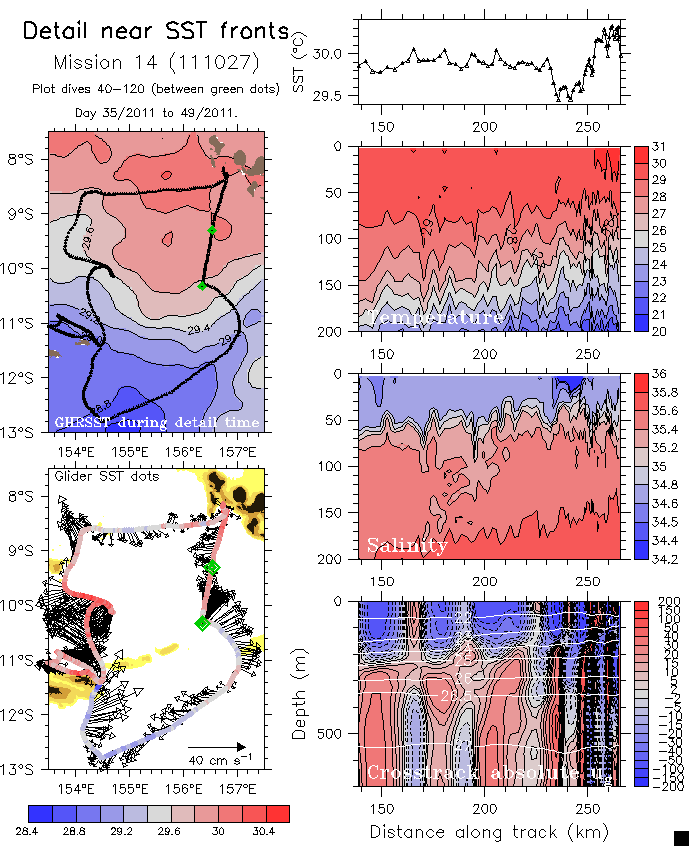
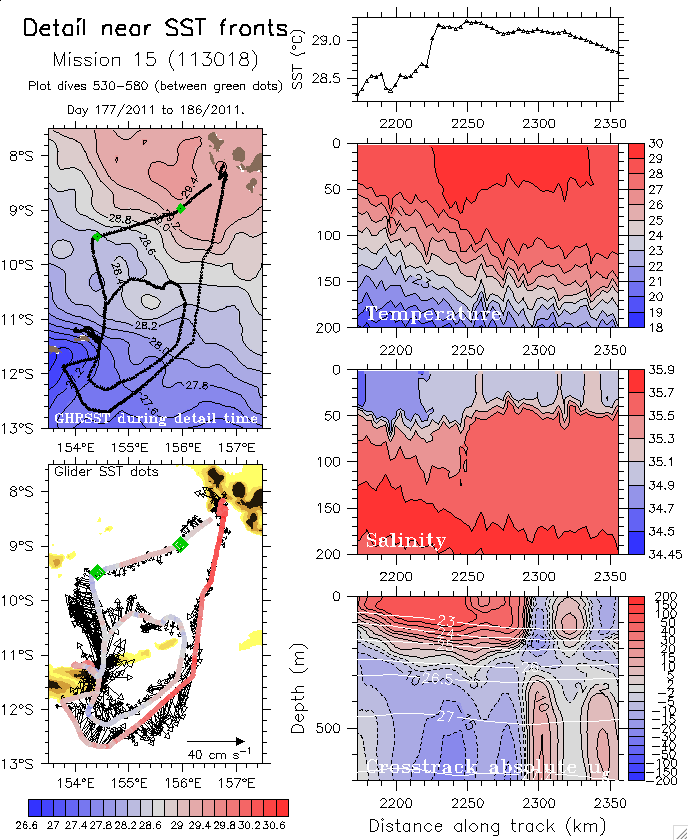
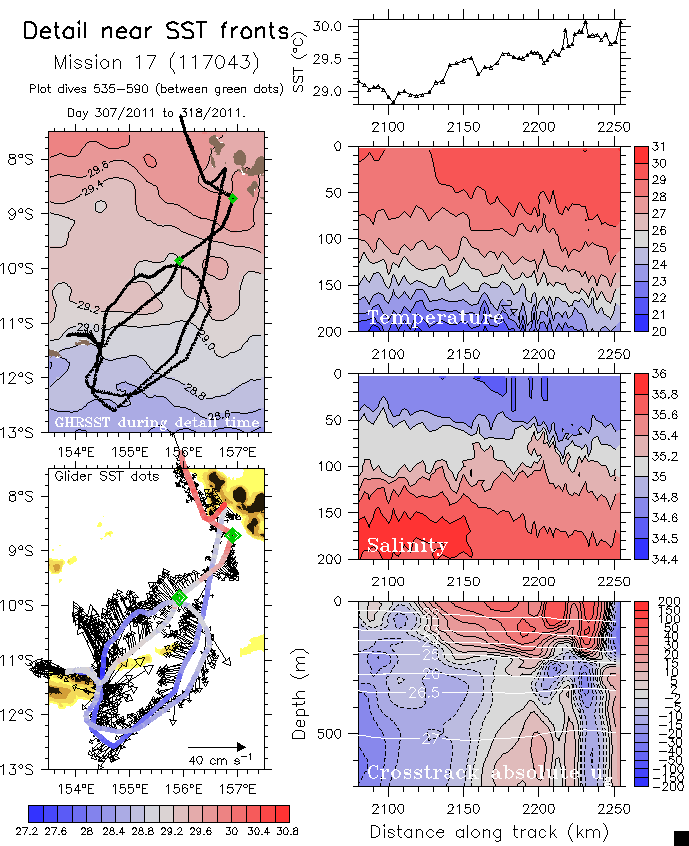
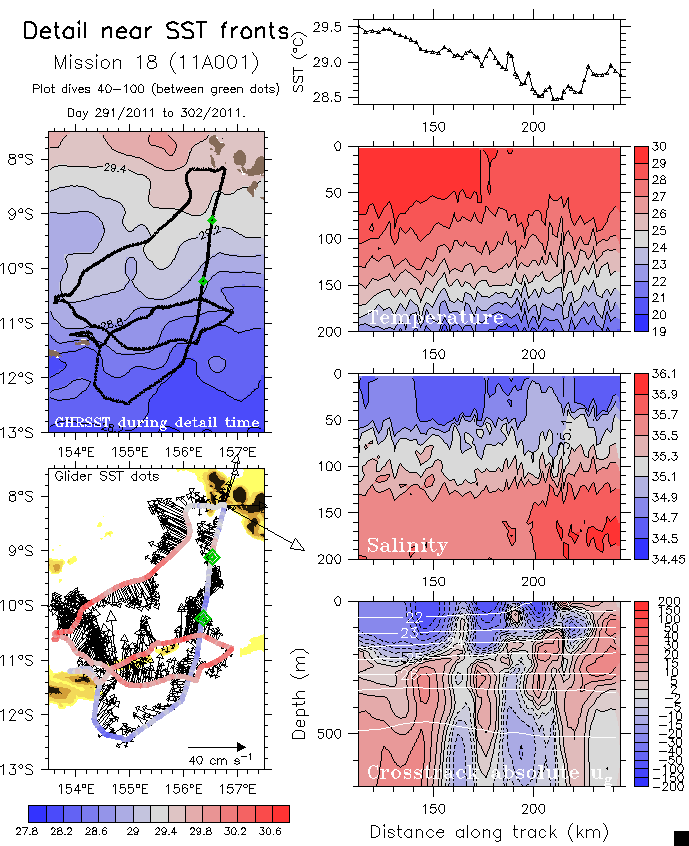
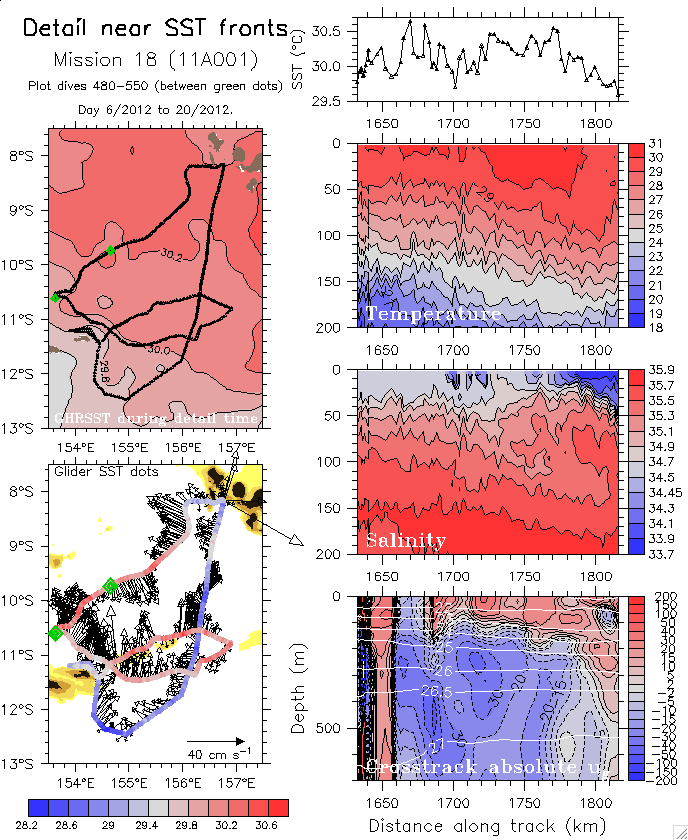
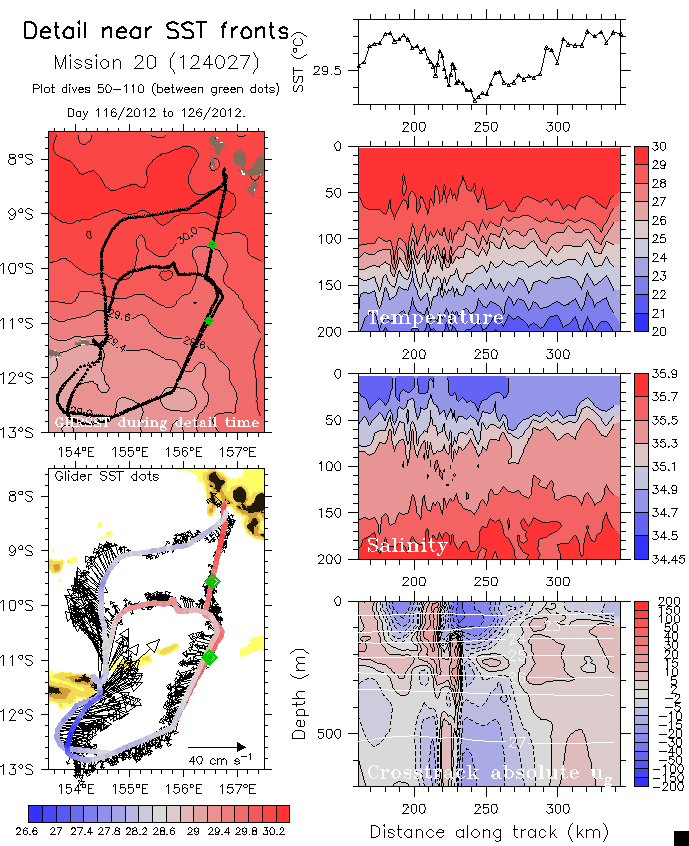
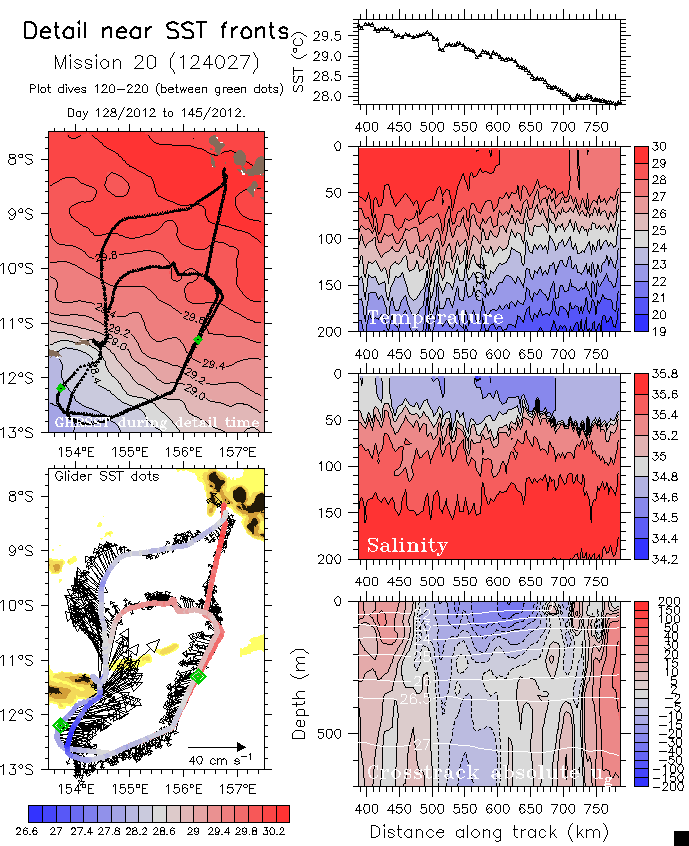
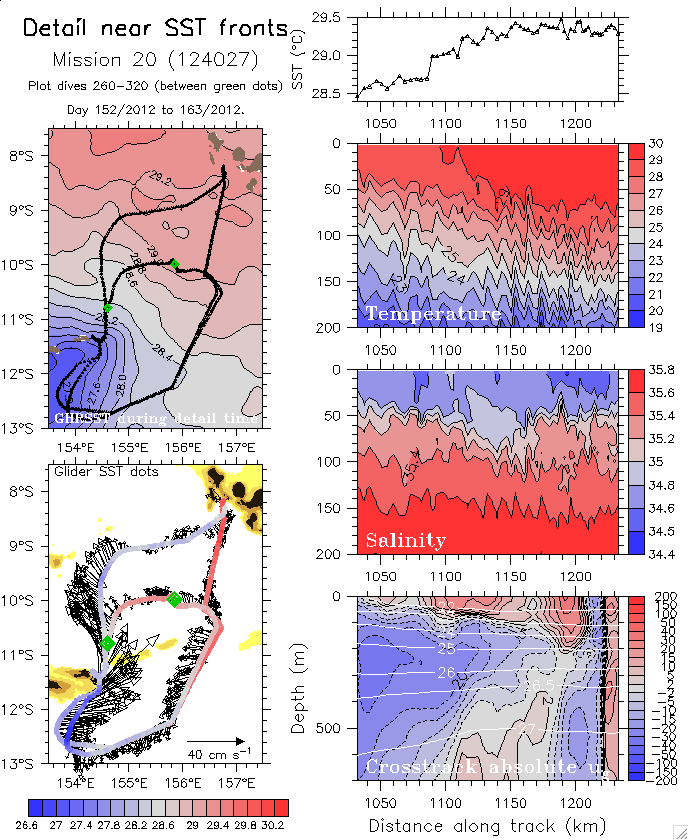
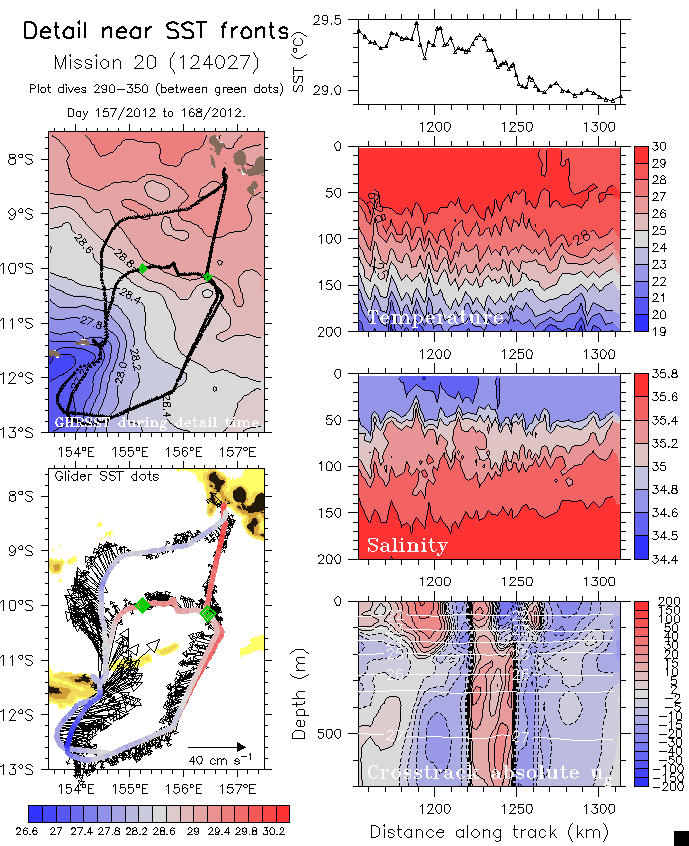
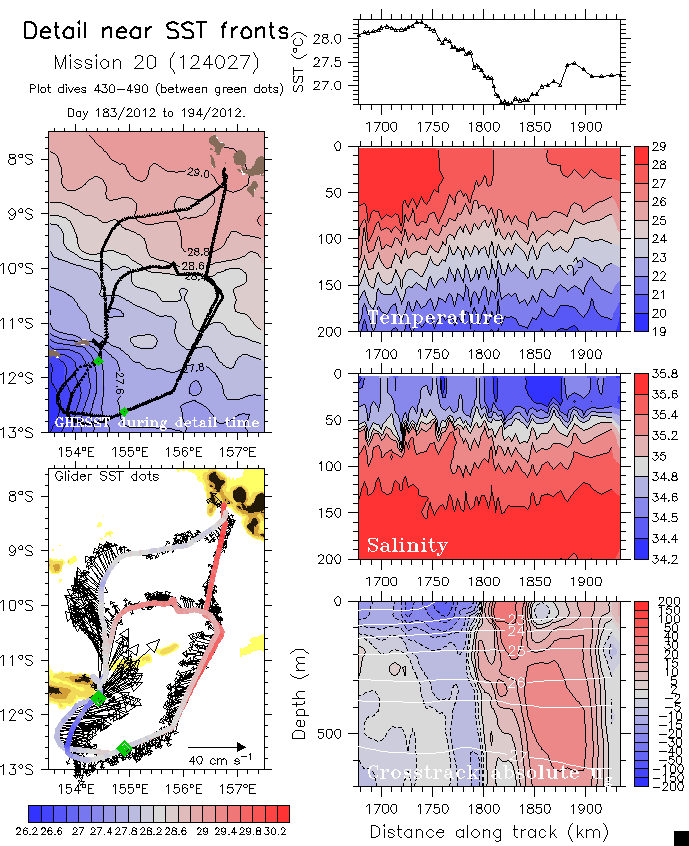
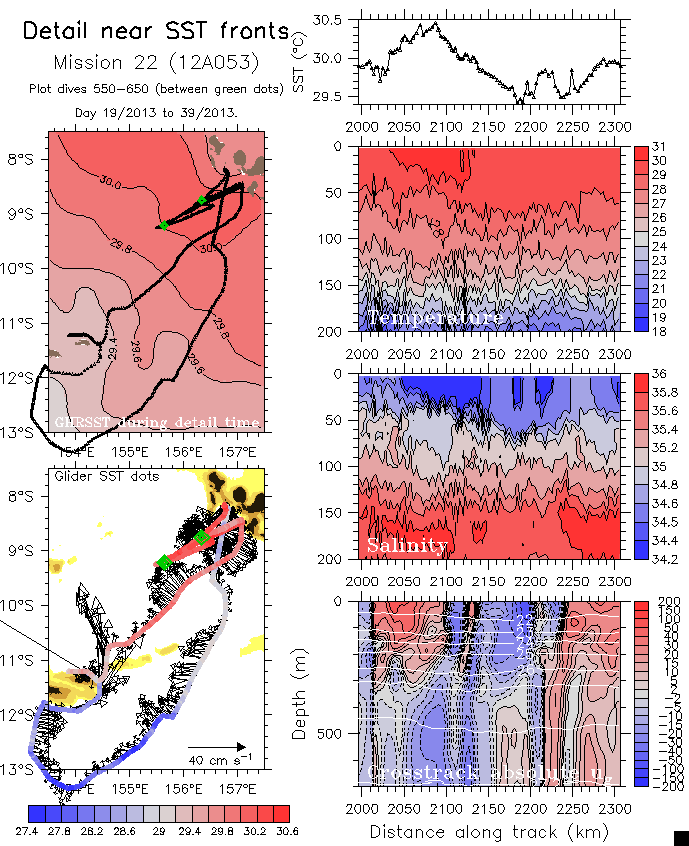
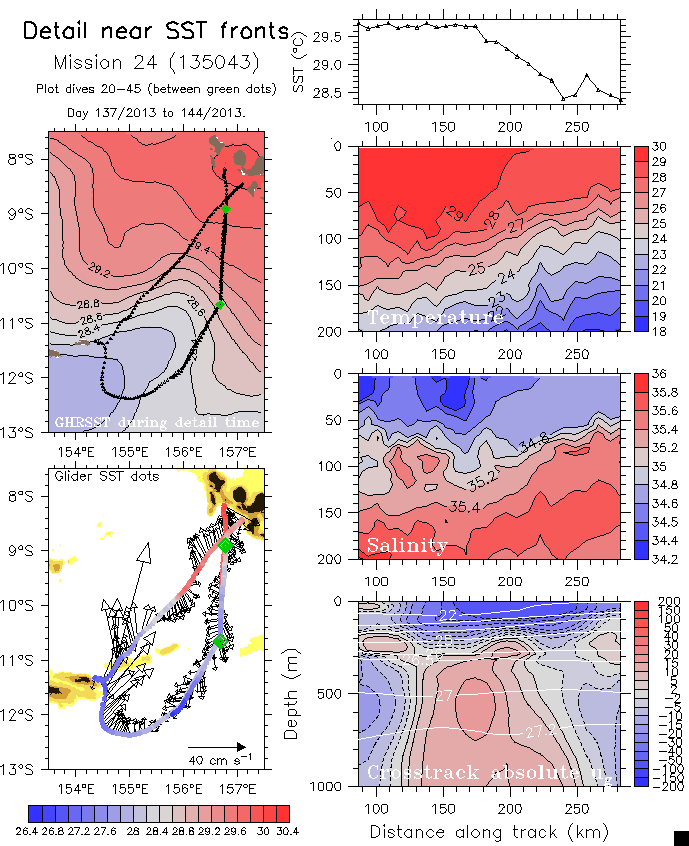
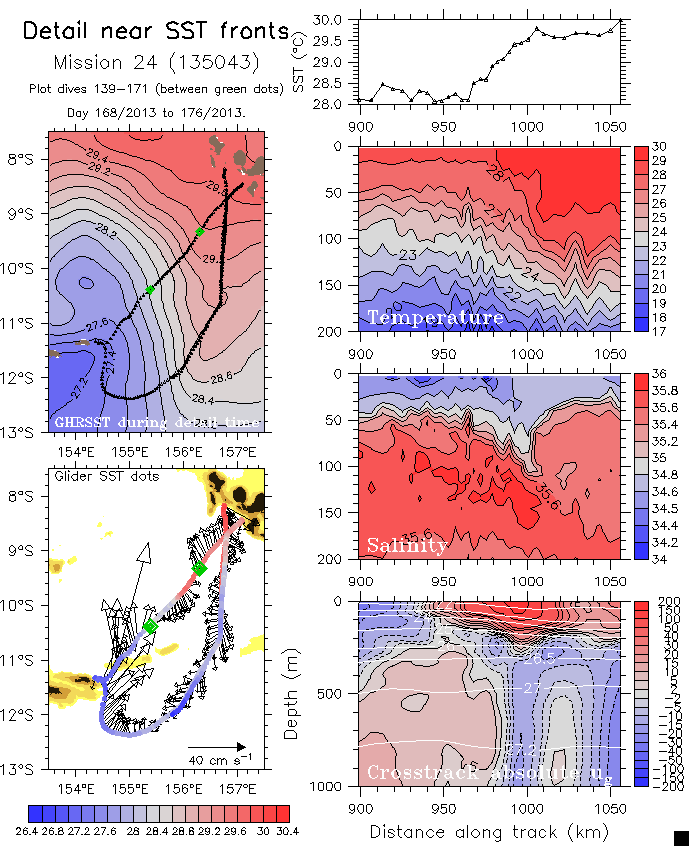
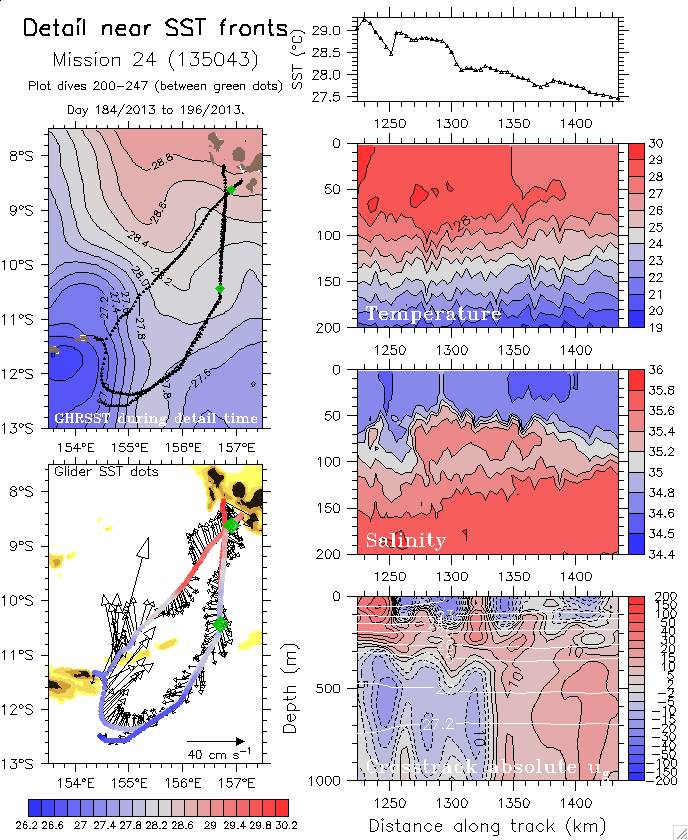
Manual zooming in on SST and near-surface fronts suggested by sections in SST sections, or T(100m) sections
Based on a lot of visual inspection, there are all the occurrences of large (.gt.1°C) SST fronts (up to about 100km)
Also zoomed on obvious "squirts" seen in the vertical-average absolute velocity (see plots in the first set of this section)
nearsfc:
- adds maps of GHR SST during the period of glider data focus (usually about 10 days) to show the regional situation
- color-fills T and S only in the upper 200m to better see fronts.
(crosstrack ug is still shown full-depth)
See a later version based on fully-corrected (sixcharmi) data. T and S are the same but the velocities are corrected. There is some overlap, but the new ones include more recent missions.
