Projects
- Addressing management questions using the analysis of multivariate population data
- Development of statistical tools for multivariate stochastic time-series data
- Estimation of community models using time-series data
- Forecasting population extinction and trends using time-series modeling and diffusion approximations
- Analysis of demographic changes in large charismatic marine mammals
- Science collaboration tools
Addressing management questions using the analysis of multivariate population data (back up)
Collaborators: Eric Ward, NOAA/NWFSC; Mark Scheuerell, NOAA/NWFSC
Status (5/2013): on-going (scroll down for a list of past and current NOAA applications)
One of the fundamental questions to be asked as a first step in a recovery planning effort or status evaluation is: How well are populations doing and what are they likely to do in the near future? Answering this question can determine whether a population needs improvement, how likely recovery goals are to be met, may help provide advice for harvest levels of commercially valuable species, and can serve as a tool to prioritize future research efforts. While quantifying a population's risk seems simple, it is an enormously difficult problem in fisheries because our data is much more poorly behaved than in other fields such as finance, engineering, social sciences. Many fish biologists are familiar with John Shepherd's quote "Counting fish is like counting trees, except they're invisible and they move". With large populations that are poorly sampled, our counts are always uncertain and our data is typically 'gappy'-depending on survey designs or research funding, entire years may be missed. Natural populations are also affected by external forcing-large environmental drivers (e.g. sea surface temperature) may have positive or negative impacts on population abundance, and disentangling these patterns from biased counts is difficult. Similar drivers may affect the spatial distribution of populations, which can also lead to biased abundance estimates if unnoticed. Accounting for this observation error and the various environmental drivers when analyzing fisheries data is a difficult statistical problem.The types of models used when analyzing noisy population data generally fall into the class of models called "multivariate autoregressive state-space" (MARSS) time-series models because we often have multiple datastreams ("multivariate"), we try to attribute some of the total variance to observation error and some to process variance ("state-space"), and the current population size has information about the population size in the immediate future ("autoregressive"). Many of our fisheries models, such as stock assessments, or hierarchical models, can be cast in MARSS form. Fitting these types of models is not straightforward, however, and specialized statistical algorithms are required to fit them to noisy and gappy fisheries data. In 1982, an "Expectation-Maximization" (EM) algorithm was developed for this class of model (Shumway and Stoffer 1982), and this algorithm is especially useful for analyzing fisheries data because it is robust when working with multivariate data with many missing values. But prior to the work by Holmes and Ward, this algorithm was not available in any statistical package, and thus out of reach for many fisheries biologists.
Over the last 8 years, we have worked to develop faster, more robust algorithms for fitting MARSS models and to make these algorithms widely available in free software (R). In 2004, we started working on univariate time-series models for data with high observation error and started distributing software in workshops taught at the Ecological Society Meetings and meetings of the Marine Mammal Society. In 2005-2006, we (with Steven Viscido) helped to develop a software package for multivariate time-series models (LAMBDA), but this package did not incorporate observation error. In 2008, we received funding from CAMEO-NOAA to support development of an R-package for fitting multivariate time-series data with observation error and to develop extensive documentation and training. The goal was to develop a package to fit very general MARSS models using a constrained EM algorithm (Holmes 2012). This algorithm allowed them to fit a much broader class of MARSS models than the original 1982 Shumway and Stoffer algorithm allowed. This package is targeted towards scientists from all fields who use MARSS models (economics, finance, engineering, image analysis, social sciences, and environmental sciences). The first iteration of the MARSS package was submitted to the R CRAN repository on June 2010 and continues to be updated (current version is 3.4). Based on download statistics, it is the most commonly accessed R package for fitting these models via maximum-likelihood (dlm is the other big MARSS package but is Bayesian-focused). The MARSS package is used by researchers across many different scientific fields. In Winter 2012-2013, we (Holmes, Ward and Scheuerell from NWFSC) taught a course on analysis of fisheries time-series data at the University of Washington that relied heavily on the MARSS package.
Applications resulting from this work have resulted in numerous publications (complete list below) and have provided advice to managers for species ranging from rockfish to salmon to killer whales. This work has demonstrated the utility of MARSS models for multiple types of data; in using MARSS models to evaluate hypotheses about synchrony between killer whale populations, they used raw counts; in evaluating metapopulation structure of Chinook salmon on the Columbia River, they used genetic (allele frequency) data; in evaluating rockfish status in Puget Sound, they used catch per unit effort (CPUE) data; and in examining linkages between salmon productivity and environmental drivers, they used time series of recruits per spawner (R/S). They are currently consulting with a number of MARSS related applications at the Northwest Fisheries Science Center, and other NOAA offices (Southwest, Southeast, Northeast Science Centers). Below we list most of the current and past NOAA applications. Non-NOAA applications are also increasing - recent examples include using the MARSS package to assess conservation status of terrestrial mammals in the Serengeti and willow flycatchers in Arizona.
Applications of MARSS modeling to assist fisheries management decisions
- Ward, E.J. 2012. Estimating carrying capacity and population interactions for Southern and Northern Resident Killer Whales. Presentation to bilateral scientific panel, Vancouver BC.
- Jorgensen, J., E.J. Ward and M.D. Scheuerell . 2012. Spatial covariance of interior Columbia River spring/summer Chinook salmon from abundance data. In Life Cycle Modeling of Salmon Populations, Chapter 8: Quantifying Spatial Structure of Interior Columbia Basin Salmon Populations.
- Ward, E.J., R.S. Waples, M.D. Scheuerell , J. Jorgensen, D. Van Doornik, and M.J. Ford. 2012. Using time series of allele frequency data to evaluate support for population correlation. In Life Cycle Modeling of Salmon Populations, Chapter 8: Quantifying Spatial Structure of Interior Columbia Basin Salmon Populations.
- NMFS. 2012. River Herring Extinction Risk Analysis Working Group Report. Report to the National Marine Fisheries Service, Northeast Regional Office. August 13, 2012. 40 pp.
- Hilborn, R., S.P. Cox, F.M.D. Gulland, D.G. Hankin, N.T. Hobbs, D.E. Schindler, and A.W. Trites. 2012. The Effects of Salmon Fisheries on Southern Resident Killer Whales: Final Report of the Independent Science Panel. Prepared with the assistance of D.R. Marmorek and A.W. Hall, ESSA Technologies Ltd., Vancouver, B.C. for National Marine Fisheries Service (Seattle. WA) and Fisheries and Oceans Canada (Vancouver. BC).
- Drake, J., E. A. Berntson, J. M. Cope, R. G. Gustafson, E. E. Holmes, P. S. Levin, N. Tolimieri, R. S. Waples, S. Sogard, G. D. Williams. 2010. Status review of five rockfish species in Puget Sound, Washington: Bocaccio (Sebastes paucispinis), canary rockfish (S. pinniger), yelloweye rockfish (S. ruberrimus), greenstriped rockfish (S. elongatus), and redstripe rockfish (S. proriger). U.S. Dept. of Commerce, NOAA Tech. Memo., NMFS-NWFSC-108.
- Pattengill-Semmens, C.V., B.X. Semmens, E.E. Holmes, E.J. Ward, B.I. Ruttenberg. 2010. Integrating Time-series of Community Monitoring Data. In: Proceedings of the Sixty Three Annual Gulf and Caribbean Fisheries Institute.-- San Juan Puerto Rico.-- Pp.214-216.
- Gustafson,R. G., J. Drake, M. J. Ford, J. M. Myers, E. E. Holmes, and R. S. Waples. 2006. Status Review of Cherry Point Pacific Herring (Clupea pallasii) and Update of the Status Review of the Georgia Basin Distinct Population Segment of Pacific Herring Under the U.S. Endangered Species Act. U.S. Dept. Commer., NOAA Tech. Memo.NMFS-NWFSC-76, 182pp.
- Holmes, E.E., W.F. Fagan, J.J. Rango, A. Folarin, J.A., Sorensen, J.E. Lippe, and N.E. McIntyre. 2005. Cross validation of quasi-extinction risks from real time series: an examination of diffusion approximation methods. U.S. Dept. Commer., NOAA Tech. Memo. NMFS-NWFSC-67, 37 p.
- Ellner, S. P. and E. E. Holmes. 2008. Commentary on Holmes et al. (2007), "A statistical approach to quasi-extinction forecasting". Ecology Letters 11: E1-E5.
- Holmes, E. E. 2004. Beyond theory to application and evaluation: diffusion approximations for population viability analysis. Ecological Applications 14: 1272-1293.
- Levin, P., E. E. Holmes, K. Piner and C. Harvey. 2006. Shifts in a Pacific Ocean fish assemblage: the potential influence of exploitation. Conservation Biology 20: 1181-1190.
- McClure, M. M., E. E. Holmes, B. L. Sanderson, and C. E. Jordan. 2003. A large-scale, multi-species risk assessment: anadromous salmonids in the Columbia River Basin. Ecological Applications 13(4):964-989.
Applications: Inferring spatial structure, and evaluating hypotheses about causal mechanisms
- Hinrichsen, R. A. and E. E. Holmes. 2009. Using multivariate state-space models to study spatial structure and dynamics. In Spatial Ecology (editors Robert Stephen Cantrell, Chris Cosner, Shigui Ruan). CRC/Chapman Hall.
- Ward, E.J. , H. Chirrakal, M. González-Suárez, D. Aurioles-Gamboa, E.E. Holmes, L. Gerber. 2010. Applying Multivariate-state-space Models to Detect Spatial clustering of California sea lions in the Gulf of California, Mexico. Journal of Applied Ecology, 47:47-56.
Applications: Analysis of community structure
- Hampton, S.E., E.E. Holmes, D.E. Pendleton, L.P. Scheef, M.D. Scheuerell, and E.J. Ward. In review. Inferring ecosystem dynamics with multivariate autoregressive (MAR) models: past applications and new directions.
- Scheef, L.P., D.E. Pendleton, S.E. Hampton, S.L. Katz, E.E. Holmes, M.D. Scheuerell, and D.G. Johns. 2012. Assessing marine plankton community structure from long-term monitoring data with multivariate autoregressive (MAR) models: a comparison of fixed station vs. spatially distributed sampling data. Limnology & Oceanography: Methods 10: 54-64.
Development of statistical tools for multivariate stochastic time series data (back up)
Collaborators: Eric Ward, NWFSC; Brian Dennis, Idaho State Univ; Mark Scheuerell, NWFSC
Status (5/2013): on-going
Much of my time since mid 2008 has been devoted to this project which has lead to the MARSS R package. The motivation was development of methods and model selection algorithms to deal with messy multivariate ecological time-series data. Economists have been working with these kinds of models (they call them VAR models) for 30+ years, but their algorithms don't always work for ecological data since we have lots of missing values and short time series. So we need different types of algorithms and different types of inference since model uncertainty is a big issue.The MARSS package is just a small piece of this work as the package is about 1-2 years behind our research. Some of our other recent work in this area involves the following:
- Derivation of an EM algroithm for unconstrained multivariate autoregressive state-space models (manuscript on my publication page)
- Development of the Bayesian version of MARSS(), i.e. addition of method="bayes". Eric Ward has the basic code done but is working on final testing to make sure it plays nice with the rest of the package (that'll be MARSS 2.0). Research code for covariates, non-gaussian errors, hierarchical errors is also developed but incorporating that into the R package is on the back-burner as we put out papers (analyses) using the methods.
- Derivation of REML algroithms for unconstrained multivariate autoregressive state-space models with missing values. Brian Dennis worked out the math and we will be working on some collaborative analyses over the next year.
- Research on estimation of interactions from time-series data (this is the B matrix in our lingo, X(t)=BX(t-1)+E(t)). Our new methods (which are robust to missing values and use spatial replication) are allowing us to study a wider variety of marine plankton datasets. It's still an open question as to what the B matrix really means, but finally our statistical tools are allowing us to ask that question with more datasets.
- Research on time-series models with autocorrelated errors. Economists use these a lot, and we are starting to explore the use of these with ecological data versus other more typical approaches where you use some autocorrelated covariate (say temperature) in the model.
Forecasting population extinction and trends using time-series modeling and diffusion approximations (back up)
Collaborators: Eric Ward, NWFSC; John Sabo, ASU; Bill Fagan, UMaryland
Status (5/2013): on-going
Real population processes are stochastic. Thus any analysis of population data must deal with this characteristic in some fashion. The pre-2000 approach was to interpret population data via models attributing variability within the data to either measurement error or process error alone. However, population data almost always contain multiple sources of variability: process error, measurement error, non-linear feedbacks, etc. Mis-attributing the sources of variability has multiple consequences ranging from misestimation of the population behavior to misestimation of the level of uncertainty associated with the data analysis. My research is focused on development of practical approaches for dealing with noisy data. The motivation behind this work is to try to understand how complex a model we need to predict passage probabilities (i.e. quasi-extinction). It has been know for some time that often a simple random walk will fit observed population time series just as well as a more complex model would fit the data. Some days, I think about this as meaning that stochastic population processes can be written as linear component (the random walk) with non-linear components of higher and higher order added (like a Taylor series). The random walk (perhaps with drift) represents the first order term. Other days, I think about it as dominant and sub-dominant eigenvalues. My research focuses on trying to estimate that random walk component and then testing, with large databases, the idea that this random walk can describe the bulk of the quasi-extinction behavior.Publications
- Holmes, E. E. 2010. Derivation of the EM algorithm for constrained and unconstrained multivariate autoregressive state-space (MARSS) models. Technical report. PDF
- Ward, E. J., Chirakkal, H., González-Suárez, M., Aurioles-Gamboa, D., Holmes, E. E. and Gerber, L. 2009. Inferring spatial structure from time-series data: using multivariate state-space models to detect metapopulation structure of California sea lions in the Gulf of California, Mexico. Journal of Applied Ecology 47:47-56. Abstract
- Hinrichsen, R. A. and E. E. Holmes. 2009. Using multivariate state-space models to study spatial structure and dynamics. In Spatial Ecology (editors Robert Stephen Cantrell, Chris Cosner, Shigui Ruan). CRC/Chapman Hall. Link to book PDF of text
- Ellner, S. P. and E. E. Holmes. 2008. Commentary on Holmes et al. (2007), "A statistical approach to quasi-extinction forecasting". Ecology Letters 11: E1-E5.
- Hinrichsen, R. A. and E. E. Holmes. 2008. Using multivariate state-space models to study spatial structure and dynamics. In Spatial Ecology (editors Robert Stephen Cantrell, Chris Cosner, Shigui Ruan). CRC/Chapman Hall.
- Holmes, E. E., J. L. Sabo, S. V. Viscido, and W. Fagan. 2007. A statistical approach to quasi-extinction forecasting. Ecology Letters 10:11821198 Open Access PDF
- Fagan, W. F and E. E. Holmes. 2005. Quantifying the extinction vortex. Ecology Letters 9:51-60.PDF
- Holmes, E.E., W.F. Fagan, J.J. Rango, A. Folarin, J.A., Sorensen, J.E. Lippe, and N.E. McIntyre. 2005. Cross validation of quasi-extinction risks from real time series: an examination of diffusion approximation methods. U.S. Dept. Commer., NOAA Tech. Memo. NMFS-NWFSC-67, 37 p. PDF
- Holmes, E. E. 2004. Beyond theory to application and evaluation: diffusion approximations for population viability analysis. Ecological Applications 14: 1272-1293. PDF
- Holmes, E. E. and B. Semmens. 2004. Population viability analysis for metapopulations: a diffusion approximation approach. Pp. 565-598 in Ecology, Genetics, and Evolution of Metapopulations, editors Illka Hanski and Oscar E. Gaggiotti. Elsevier Press. [Galleys (has eqn typos)] [Text with corrections]
- Sabo, J. L., E. E. Holmes, and P. Kareiva. 2004. The efficacy of simple viability models in ecological risk assessment: Does density dependence matter? Ecology 85: 328-341. PDF
- Holmes, E. E. and W. F. Fagan. 2002. Validating population viability analysis for corrupted data sets. Ecology 83: 2379-2386. PDF
- Holmes, E. E. 2001. Estimating risks in declining populations with poor data. Proceedings of the National Academy of Science 98: 5072-5077. PDF
Workshops
- See my workshops page for on-line workshops given on this topic.
- As of March 2010, I am part of a NCEAS working group on development of "Red Flag" criteria for at-risk populations (leaders by Robin Waples and Jeff Hutchings)
Analysis of demographic changes in large charismatic marine mammals (back up)
Collaborators: Lowell Fritz, NMML; Anne York, York Data Analysis, Eric Ward, NWFSC, Ken Balcomb, CWR
Status (5/2013): on-going depending on what's happening with recovery...
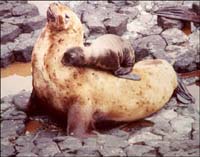 From the mid-1970s through 2000, the western stock of Steller sea lion (Eumetopias jubatus) declined by over 80%. This fish- and squid-eating predator, the largest eared seal (Otariidae), is distributed across the North Pacific Ocean. The western stock breeds on rookeries west of 144°W in Alaska and Russia and the eastern stock breeds to the east and south to the Channel Islands off California. In 1997, the western stock of Steller sea lion was listed as endangered under the U.S. Endangered Species Act, which created new challenges for managers of Alaskas groundfish fishery, the most productive in the United States. Since 2000, over $120 million, the largest budget for a U.S. endangered species, has been devoted to reducing uncertainty about the factors negatively affecting the population: food limitation, killer whale predation, disease, and direct or indirect impacts from fishing. But despite well-funded and large-scale coordinated research, the complexity, indirectness and cumulative effects of these factors have made it difficult to determine which were responsible for the decline and which are primary threats to recovery. This project is focused on using population models combined with data on the numbers and age distribution of Steller sea lions in the central Gulf of Alaska to estimate the historical changes in survivorship and fecundity that drove the decline.
Publications
- Mongillo, T. M., E. E. Holmes, D. P. Noren, G. R. VanBlaricom, A. E. Punt, S. M. O'Neill, G. M. Ylitalo, M. B. Hanson, P. S. Ross. 2012. Predicted polybrominated diphenyl ether (PBDE) and polychlorinated biphenyl (PCB) accumulation in southern resident killer whales. Marine Ecology Progress Series 453:263-277.
- Ward, E., Semmens, B., Holmes, E., and K. Balcomb. 2010. Effects of multiple levels of social organization on survival and abundance. Conservation Biology 25:350-355.
- Ward, E., Parsons, K., Holmes, E., K. Balcomb, and J. Ford. 2009. The role of menopause and reproductive senescence in a long-lived social mammal. Frontiers in Zoology 6:4 Open Access PDF
- Ward, E. J., E. E. Holmes, and K. C. Balcomb. 2009. Quantifying the effects of prey abundance on killer whale reproduction. Journal of Applied Ecology 46:632-640 Abstract
- Holmes, E. E. and A. E. York. 2003. Using age structure to detect impacts on threatened populations: a case study using Steller Sea Lions. Conservation Biology 17:1794-1806.
- Holmes, E. E., L. Fritz, A. York and K. Sweeney. 2007. Age-structured modeling reveals long-term declines in the natality of western Steller sea lions. Ecological Applications 17:22142232. PDF Appendices In earlier versions of this paper, we had longer appendices which discussed why we feel that sightability and sex-ratios have not changed sufficiently to explain the dropping pup to nonpup ratio. This was cut during the 2nd revision process. Earlier appendices
Presentations
- EE Holmes, LW Fritz, AE York, & K Sweeney. Evidence of continuing declines in fecundity of Steller sea lions. Marine Mammal Society Meetings. San Diego, CA. December 2005. PDF of poster.
- EE Holmes & AE York. Cooperative Fish and Wildlife Research Unit, WA Dept. of Fish and Wildlife, Invited speaker: Monitoring the effect of management on long-lived species. Olympia, WA. December 2004. PDF
- EE Holmes & AE York. Society for Conservation Biology Annual Meeting, Invited speaker for Symposium on Designing Marine Reserves for Marine Mammals, Using age-structure to monitor long-lived marine mammals Hawaii. June 2001.
Estimation of community models using time-series data (back up)
Collaborators: Steven Viscido, Eric Ward, Mark Scheurell, Stephanie Hampton, Steve Katz, Kevin See
Status (5/2013): finishing up the last submissions
Current ecosystem models such as EcoSim build a model of the strengths of species interactions within a community primarily via diet information combined with generally an assumed linear or non-linear function to describe how diet changes with changes in the density of individuals. This approach views the community interactions as deterministic and the data (such as diet data and population sizes) as observations, with error, of this deterministic process. Another approach views the community dynamics as stochastic and the data as one possible realization of this stochastic process. This approach has recently been proposed by Ives et al. 2003. This alternative approach uses in particular time series data of population estimates of the species within the community to statistically estimate a community model. Ives et al. use a particular type of stochastic process: a first-order multivariate (or vector) autoregressive process, abbreviated MAR(1). The first-order process implies that enough information can be obtained about a community at a single point in time to predict the immediate changes in species abundances. MAR(1) processes assume that the interactions among species, and between species and environmental variables, are linear (at after suitably transformed). Previous research (Ives 1995a, b) has demonstrated that MAR(1) models provide relatively simple approximations to nonlinear, non-first-order processes and therefore can be used to describe the general stochastic properties of complex communities. The advantages of this approach is that it provides a statistical framework for estimating a community model, and thus provides a statistical framework for comparing different possible models that might conceivably have produced the observed data. Diet data can still be used to help constrain the model but this is added as a constraint or as a prior in the estimation process. This approach may also provide a statistically rigorous procedure for estimating community models using the type of data typically available in a fisheries management setting, e.g. stock assessments and regular stock survey data. The risk, of course, is that there simply is not enough information in count data to infer a community model. Then the question is how to use the information available to constrain the problem -- there are different philosophical approaches to that.Publications
- Holmes, E. E. and P. M. Kareiva. 2000. Using single-species measurements to anticipate community level effects of environmental contaminants. In Environmental Contaminants and Terrestrial Vertebrates: Effects on Populations, Communities, and Ecosystems, P.H. Albers, G.H. Heinz, and H.M. Ohlendorf, editors. Published by the Society of Environmental Toxicology and Chemistry (SETAC), 315 pp.
- Lots in prep, one in revision....
Presentations
- Steven Viscido and Eli Holmes. Estimating population interactions and community stability from long-term datasets. Ecological Society Meetings, Montreal, Canada. August 2005.
Products
- L.A.M.B.D.A. Long-term Assemblage MAR(1)-Based Data Analysis. LAMBDA is a MatLab toolkit designed to do MAR-1 based data analysis on long-term datasets (i.e., time series). LAMBDA website
- MARSS R packages. R code and package (MARSS) for MAR-1 state-space models. MARSS package. Click on workshops in the left nav bar to see the workshops that we have given.
Grants
- CAMEO NSF/NOAA grant: 2009, 2 years
Science web tools (back up)
Status (5/2013): this project is now finished and is maintained FishBox
Interactive web-based content collaboration and workshop tools The Iugo-Cafe Project. These are the tools that came out of that project:- Minnow: Web-based content discussion tools for real-time discussion of scientific content, particularly PDF and PowerPoint files. Though we stopped development on Minnow, it was the genesis for our other tools, Chinook and Sculpin.
- Chinook: Simple web-based workshop development tools for interactive workshops and symposia. This is the platform that provides access to my on-line version of (non-UW) workshops.
- Sculpin: Streamlined project sharing and code versioning platform. This is the content manager platform behind FishBox