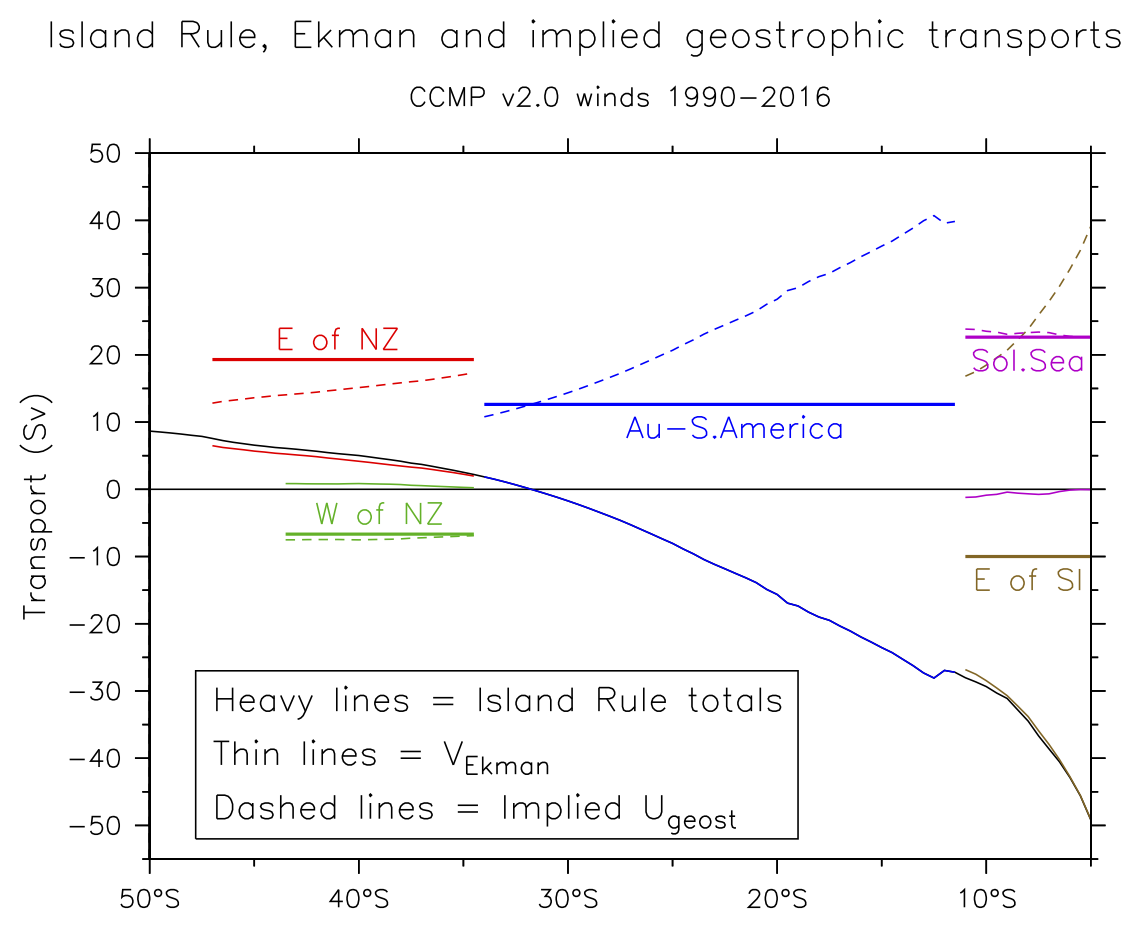
Ekman and Rossby calculations on the Solomon Sea (from Feb 2017: CCMP v2.0)

Related pages:


This page studies the new CCMP v2.0 winds (1987-May 2016). This page shows calculations from Jan 1990-May 2017 (early data very sparse). Note that there are no gaps in the CCMP product: All times/locations without satellite data (including land) are filled with ERA-Interim. This is much of the data in the early years. See description (pdf) and the satellite timeline.

  1. CCMP checking and preparation:
    1. Compare previous CCMP version (including recent ASCAT winds):   Taux (maps)     Taux overlay: Eq and 45°S     Tau and Curl difference maps
    2. Masking and blanking:
      1. Sampling and blanking: Longterm mean daily samples    
        Example sections:   165°W (monthly data)     165°W (5-day data)     12°S (monthly data)
      2. CCMP masking for RW integration (mask for Pacific only)
      3. Easternmost points each latitude (remove large curl at coast transition to ERS-Interim)

  2. Solomon Sea local winds
    1. Annual cycle variance ellipses
    2. Rotate winds to along- and cross-Sea components: Sample along 45° line (6.5°S,152.5°E)-(13°S,159°E)
      1. Annual cycle:   Along-Sea   &nsp; Cross-Sea
      2. Interannual:   Along-Sea     Cross-Sea     Vectors     Glider period
      3. With Niño 3.4:   1990-2016     Glider period     Overlay y-average winds and Niñ0 3.4

  3. Rossby/TDIR model results:
    1. Urw arriving at Australia
    2. TDIR WBC anomalies (y,t) and Nino3.4     RMS(y)
    3. Compare Firing IR and observed Sol Sea transport for D=24 months and c=3.0m/s (12 images for WBC starting latitudes)
      (For c=3.5m/s)
    4. WBC east of the Solomons:
      1. TDIR time series (y,t) and N,S end totals
      2. Sverdrup/I.R. SI WBC calculation (mean):  
        Terms for calculation (fT0, Int(Taux*dx), P_inshore, P_offshore)     WBC profile (also checking effect of near-Peru gridpoint)

  4. CCMP v2.0 winds and Niño3.4 comparisons:
    1. Correlations of Curl and Niño 3.4:  1990-2016     1990-1999     2000-2016     2000-2013     2014-2015    
    2. El Niño/La Niña composite Tau and curl:  1990-2016     1990-1999     2000-2016     2000-2013

  5. Island Rule (mean) transports with the CCMP v2.0 winds:

    1. Transport relative to S. America (Sv):
      Region  Circum-Is. term Curl term  Total  Direction
      NZ –0.18 19.82   19.66  Northward
      Solomons –0.86 –8.51  –9.37 Southward
      Australia 0.50 12.82   13.32 Northward
      Au if no NZ 0.50 10.90   11.40 Northward

      Notes:
      Old circum-island values retained (too much work, too little benefit)
      13.32 – 19.82 = –6.50 Sv (southward) between NZ and Au
      13.32 – (–9.37) = 22.69 Sv (northward) between SI and Au
      ITF = 13.32 Sv
      Interior (Sverdrup) transport inside the Solomon Sea = –1.88 Sv

    2. Mean V_Sv, V_Ek, and implied V_g (integrals from east):
      9.5°N    7.5°N    7.5°S    9.5°S
    3. Meridional profiles of I.R., Ekman and Sverdrup transports along NZ, Australia, Solomon Islands
    4. Island Rule, Ekman and implied geostrophic transport (integrated across basin)   (compare previous calculation) (Legend labels should be V_g not U_g)
      V: IR, Ekman, Sv (CCMP/ASCAT winds)
    5. Western Boundary Currents implied by the Island Rule     (Compare old combined winds)

  6. Ekman-geostrophic mass balance calculations
    1. Checking Argo vs full CCMP period for 7.5°S and 9.5°N:  1992-2016     2004-2016
      Compare annual cycles and means:  Ekman transport     Ekman outflow     Compare 7.5°S/N and 9.5°S/N
      Interannual
      Compare CCMP v2.0 with previous combined winds
    2. Mass balance (HGH):  Ekman+geostrophic above 700m
    3. Arnold Gordon Makassar St time series
    4. Surface mass flux: precip and evaporation