EAC (Rossby model) page
This page now includes figures that used to appear on the ORCA page. There is now enough work that they should be on their own page.
Most of this work is based on a Rossby wave model forced by FSU/ERS/Quikscat winds during 1961-2004.
What causes the EAC to vary interannually? Some investigation of a few possibilities ....
- Tide-gauge sea level around Australia (Hunter dataset):
- Station location map
- All data: Monthly Filled 181-day running mean
- Short periods: 1991-92 1997-98 1987-88
- Exclude Tasmania: 1991-92 1997-98
- 1997-98, anomalies from 181d RM
- Lag correlations vs stations 1-5 (Cape York-Wyndham)
- Compare Tidegauges and Topex:
- Topex and Hunter points
- Topex and Hunter timeseries (all in sequence)
-
Quick-look time series Broome to Townsville
- Topex offshore sections at 30°S
- TOPEX SL and vg across the EAC (22°S) Anomalies from climatology ORCA EAC transport and TOPEX velocity
- TOPEX near-coastal points at 22°S: Coast point; various smoothing 3 nearest offshore Topex gridpoints
- Topex interannual anomalies along 22°S (basinwide) (RW speed lines)
- Winds and curl and TOPEX
- Hofmuller diagram of ERS Curl and Topex SSh along 22°S Overlay
- Sequence of seasonal maps of ERS Tau, Curl and Topex SSH
- Using a Rossby model to interpret ORCA (and TOPEX)
The model uses merged ERS winds (Aug 1991 - Jul 1999) and Quikscat winds (Aug 1999 - Nov 2004).
The model was initialized with FSU winds through July 1999.
- Checking the wind input:
- (x,t.Eq) sections of scat Taux and TAO u
Zonal-average time series, interannually-smoothed: (It makes a big difference over what period is used to demean!)
- Curl(Tau) (input to model)
- Scat Taux (model input winds, various demeaning as noted):
1961-04 mean 1961-04 mean (show back to 1985) By 1992-99 mean
- ERS winds alone (1992-99)
- TAO zonal component: Demean by 1992-04 mean By 92-99 mean
- RMS annual cycle of Taux time series: 20°S 10°S Eq 5°N 7°N 10°N 12°N 20°N
- Compare damping timscales (runs with c_k=3.5 m/s):
28.5°S 25.5°S 21.5°S 20.5°S 17.5°S 15.5°S 12.5°S 10.5°S 5.5°S 0.5°S
5.5°N 7.5°N 10.5°N 12.5°N 15.5°N 17.5°N 20.5°N 22.5°N 25.5°N 28.5°N
- Meridional section time series:
- 125°W 150°W 165°W 180° 165°E 155°E
Along the western boundary
- Compare Topex: 125°W 150°W 165°W 180° 165°E 155°E
- RW model and Topex: 125°W 150°W 165°W 180° 165°E 155°E
Southern hemisphere only: 125°W 150°W 165°W 180° 165°E 155°E
South of 10°S only: 125°W 150°W 165°W 180° 165°E 155°E
- Overlaid timeseries at equatorial points Overlay TAO DH Overlay TAO Z20 Topex-RW difference
Timeseries at 165°E, 20°-23°S
- Correlations and their significance:
Individual comparisons (c,damping timescale):
3.5/24 mon 3.0/24 mon 2.5/24 mon 3.5/12 mon 3.5/No damping
All runs overlaid
Significance of correlations: Integral timescale DoF Correlation and 95% confidence v2 (bars)
- Curl anomalies and ENSO:
- Taux and Curl during 1998
- Curl at 20°-25°S (x,t)
- Lag of best correlation between Curl and SOI: Positive r Negative r
(Conclude that the correlations are near-simultaneous)
- Winds in the region 160°E-160°W:
- Taux and Curl (x,t): Taux (y,t) Curl (y,t)
- Timeseries of Curl at 15°S-5°S vs 29°S-20°S Flip sign to overlay
- Timeseries of Winds at 29°S-20°S and the SOI: Taux Tauy Curl Curl 15°S-5°S
Wind differences across the region (Delta-Tau a la curl): –Delta Taux(y) Delta Tauy(x)
Note r(Curl,Delta-taux(y)=0.982, r(Curl,Delta-tauy(x)=0.390)
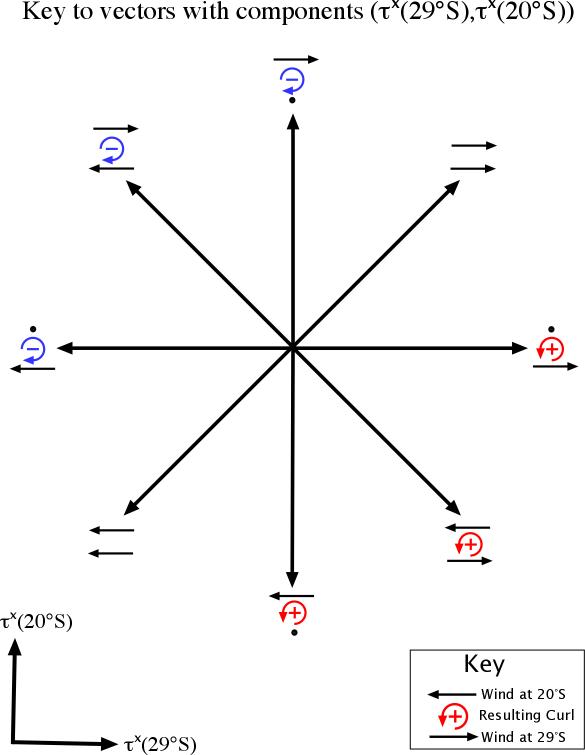
Curl and Taux(29°S) vs Taux(20°S) (x,t): 1960s 1970s 1980s 1990s 2000s Key to vector diagrams
- Correlation of SOI and Curl(y) Tau and DoF (for significance)
- Lag correlation of SOI and Curl(y) (1961-2004) (1980-2004)
- Figures comparing Lionel's ORCA work
- Transport between NC and the Solomons: Sampled along the XBT track Coast to coast
- Compare ORCA and Rossby model transport across 162°E
- RMS zonal transport along 161°E
- SEC, JNC, JNV anomalies: "SEC" JNC and JNV
- WBCs based on Firing's Island Rule (???): EAC and NGCC all lats
EAC time series: ORCA/RW overlay: 24m Damping No Damping NQC at 10°S
- Annual cycle Rossby model:
- Forcing (ERS annual climatology)
- Maps of Curl(Tau): Observations Anomalies
- Zonal average phase of the curl
- Winds at 165°E:
Taux (Overlay curl) Curl
- 1 cpy Phase and amplitude: Tau-x Tau-y Curl S Pacific detail
Chen-Qiu-04 Rossby phase lag for exp forcing
- Zonal-average curl (compare NEC bifurcation):
- (y,t) annual cycle plots: Tau-x Curl
- Mean and RMS zonal-average curl
- Maps of solution: h U U (extratropics)
- JNC and JNV at 160°E
- Solution along 165°E: h U
- Solution along the western boundary:
- h
- U
- 1 cpy harmonic: Amplitude (sbx5) Amplitude (spz5) Phase
- A composite El Niño: This has now been moved to its own page
Return to main page
Other pages: