Figures showing IFREMER XBT track calculations (Early data set)
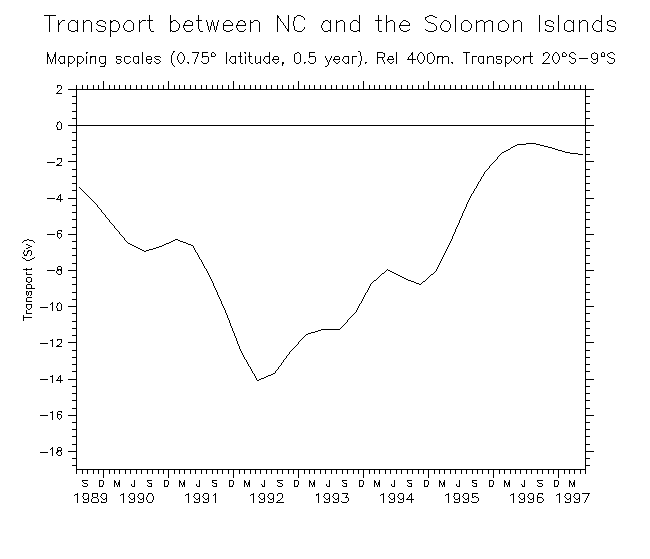
Use XBT sections passing just west of New Caledonia to study the variability of the SEC between NC and the Solomon islands.
These calculations are based on a data set that I downloaded from IFREMER in 1998, while thinking about the northern STCC, work that led to KJM02 and the STCC part was dropped.
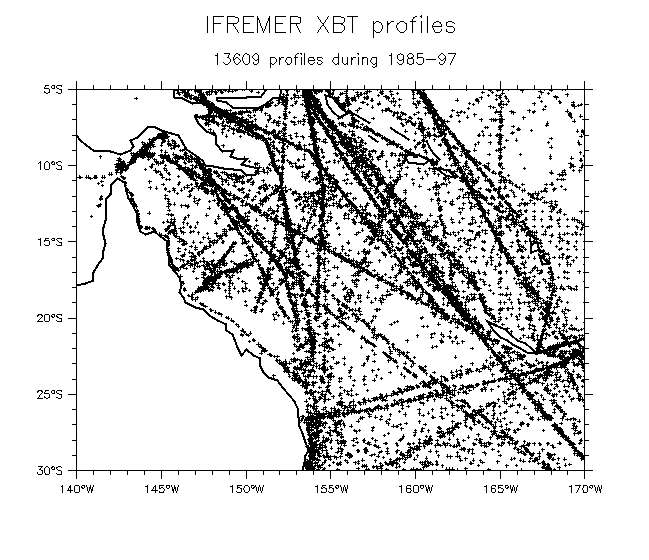
- Complete data set from IFREMER:
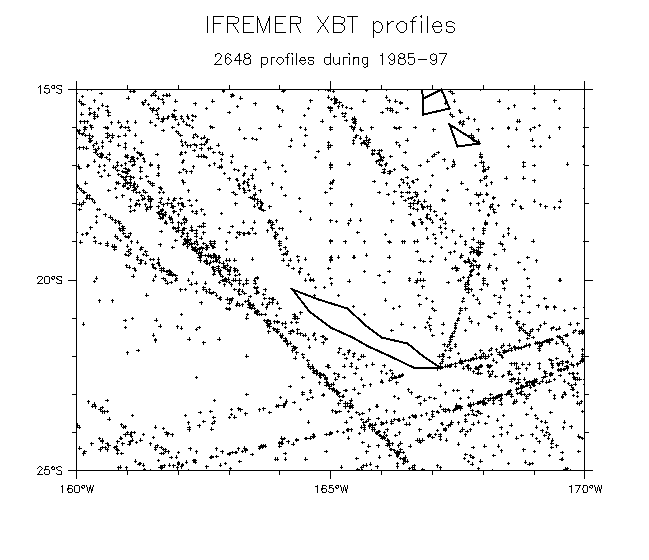
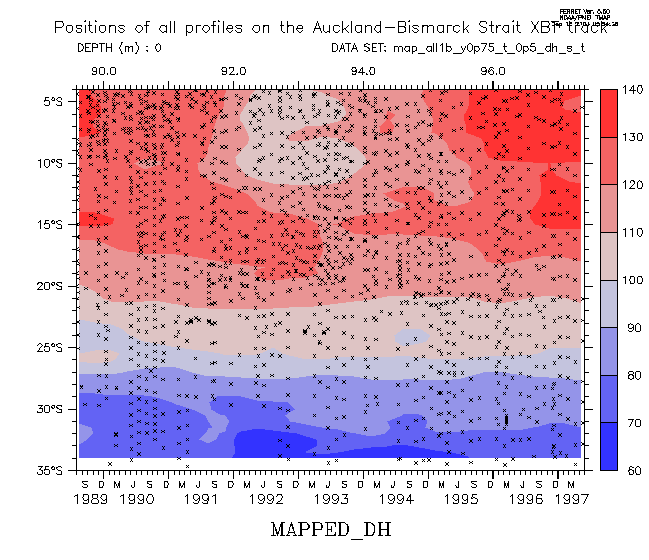
- Profile locations: Region NC detail
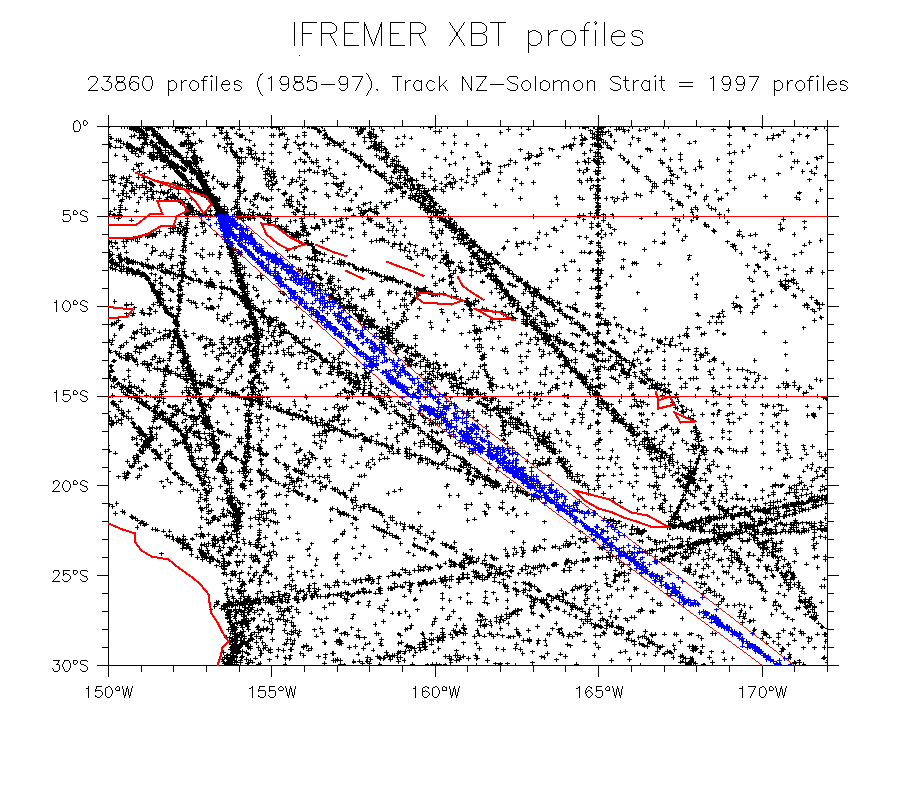
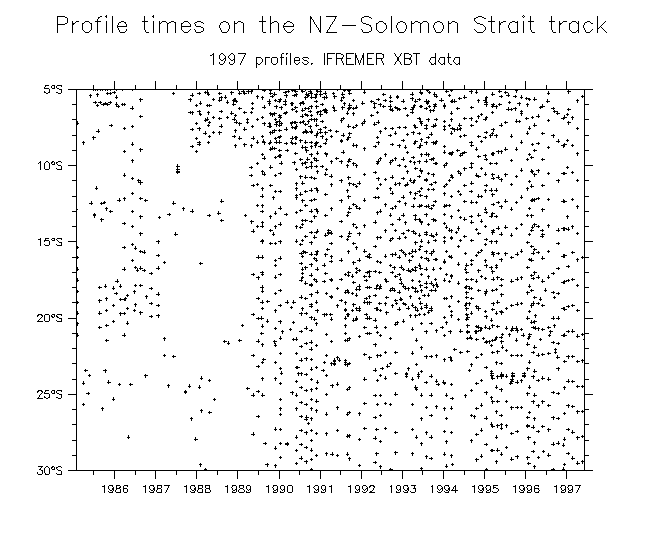
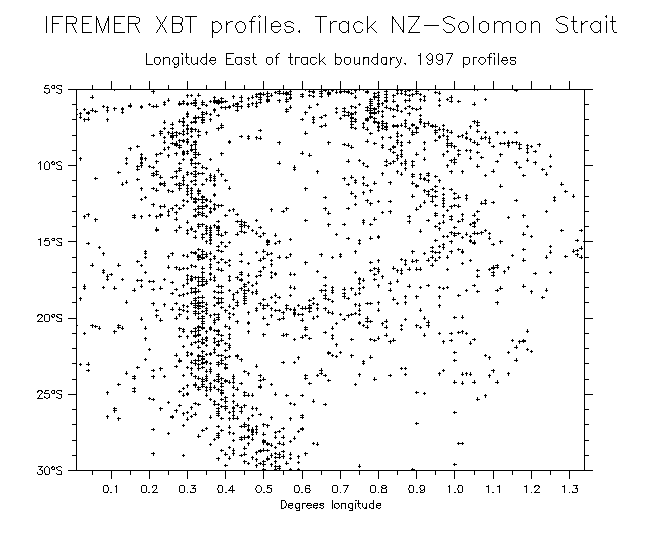
- Define a track W of NC: Track selection Time/lat of profiles on the track Longitudes wrt the track line (spread)
- Profile locations on the selected track:
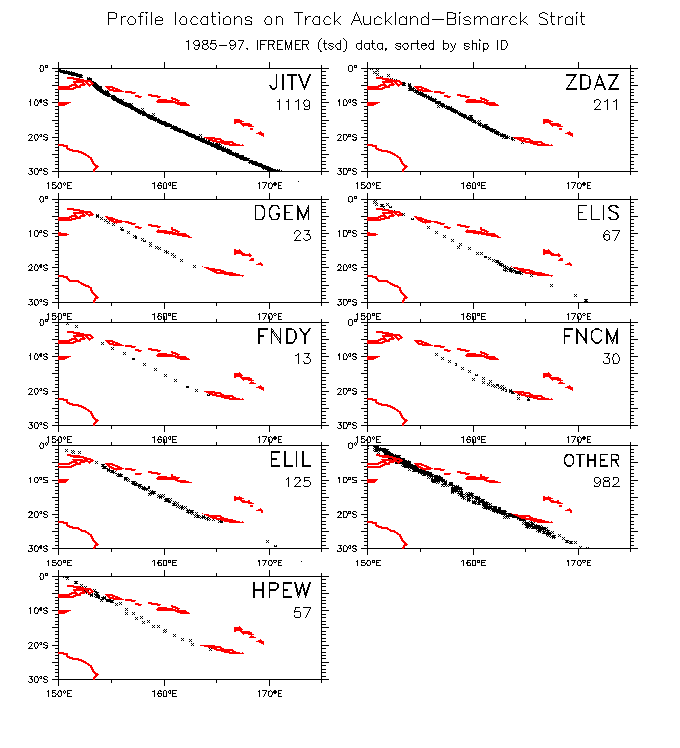
- Maps, sorted by shipname
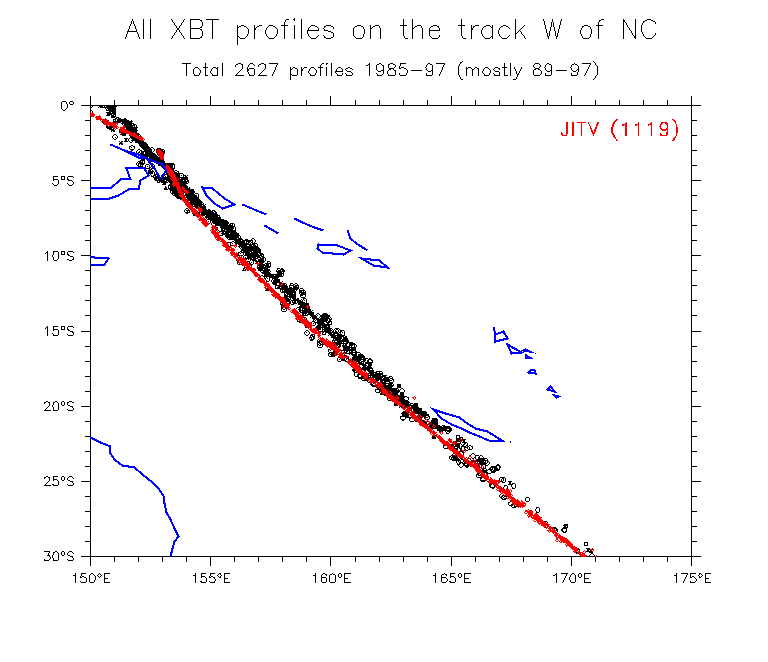
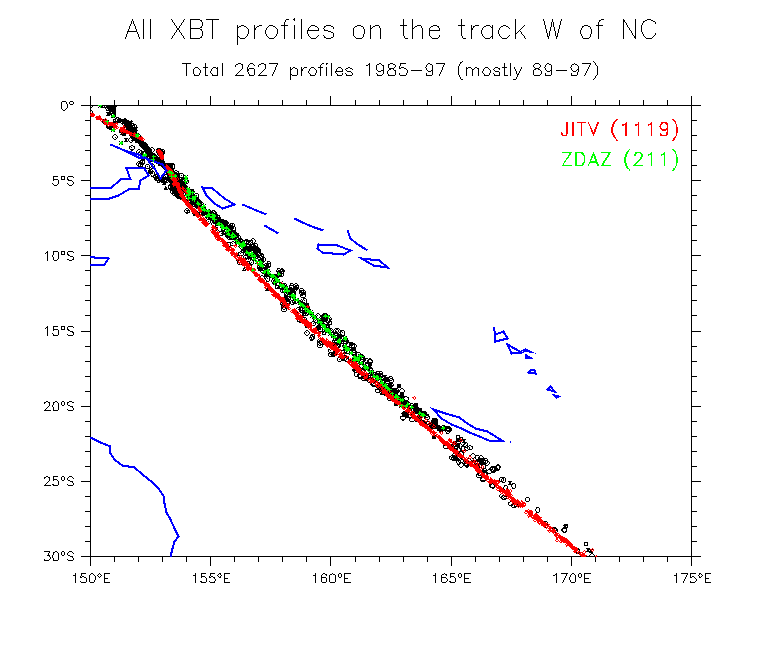
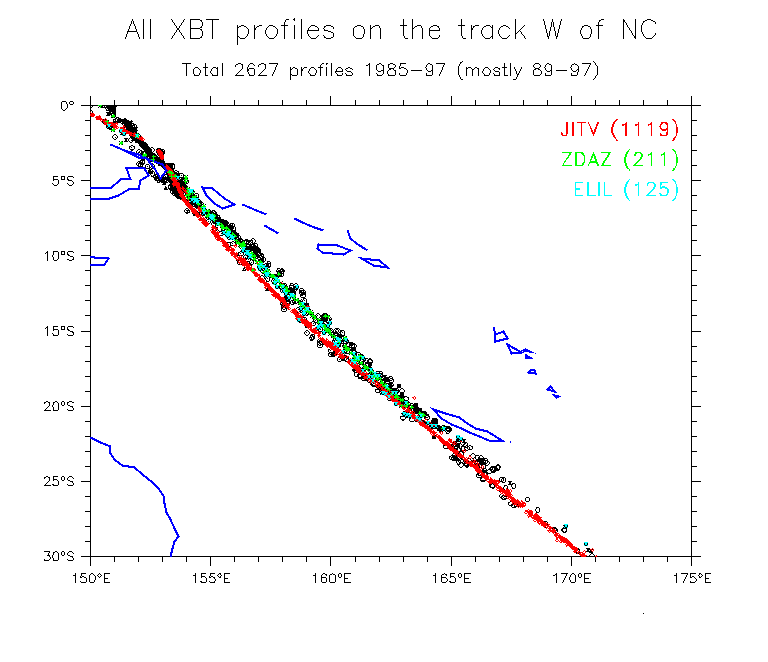
- Maps showing the 3 main ships' profiles: JITV JITV and ZDAZ JITV and ZDAZ and ELIL
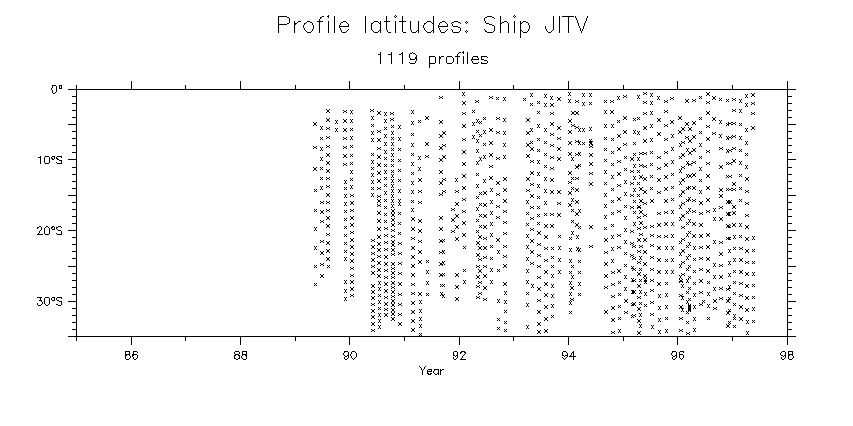
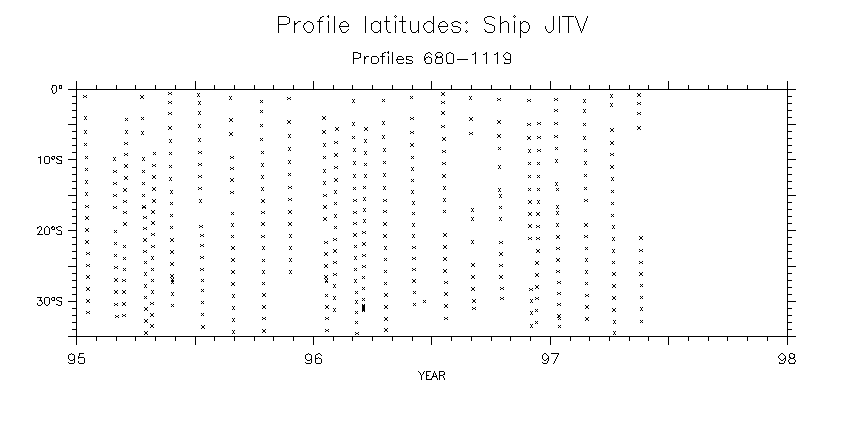
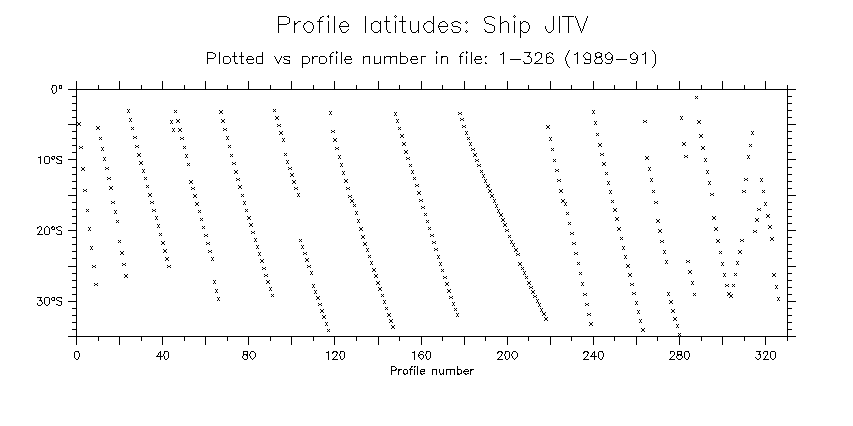
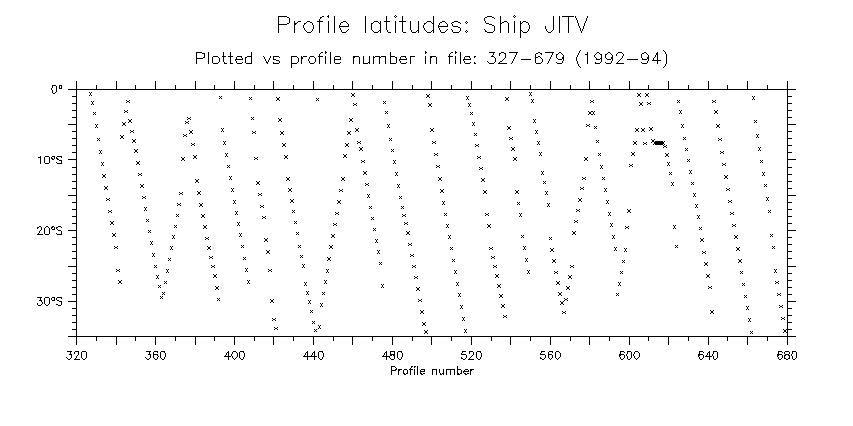
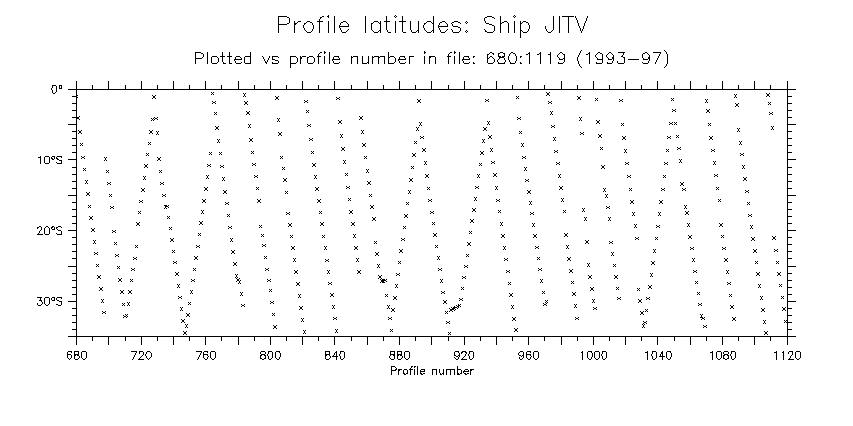
- JITV (all)
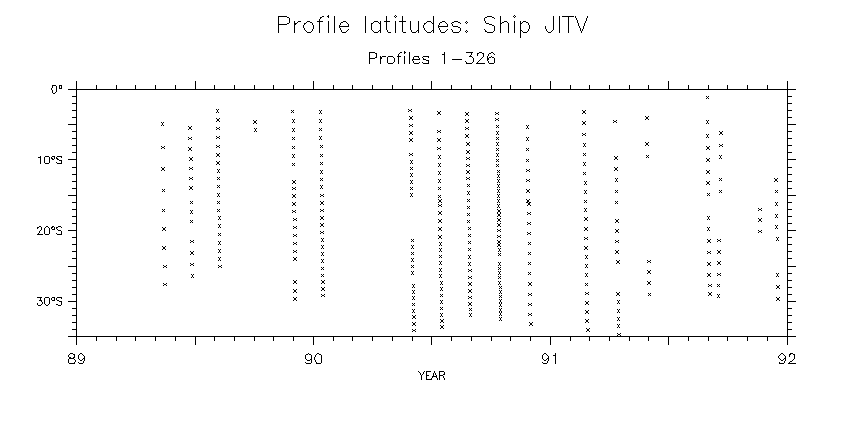
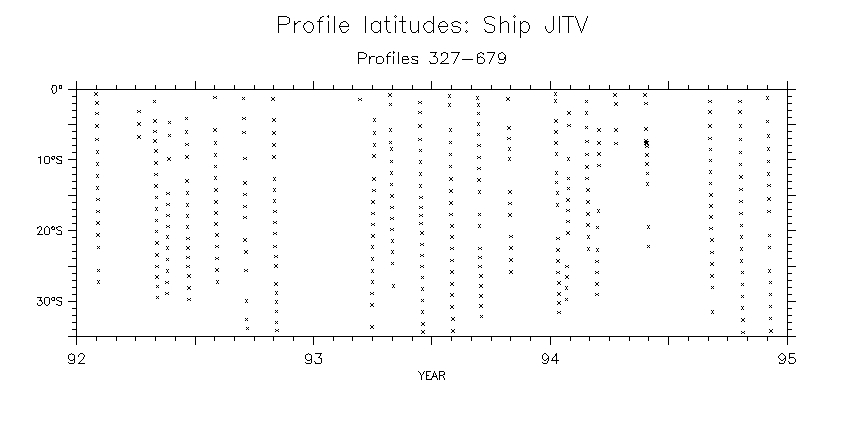
Details: 1989-91 1992-94 1995-97
Profile numbers: 1-326 327-679 680-1119
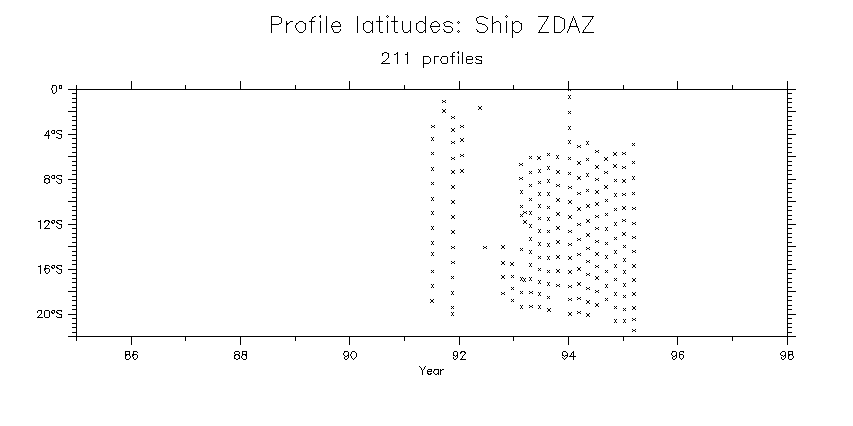
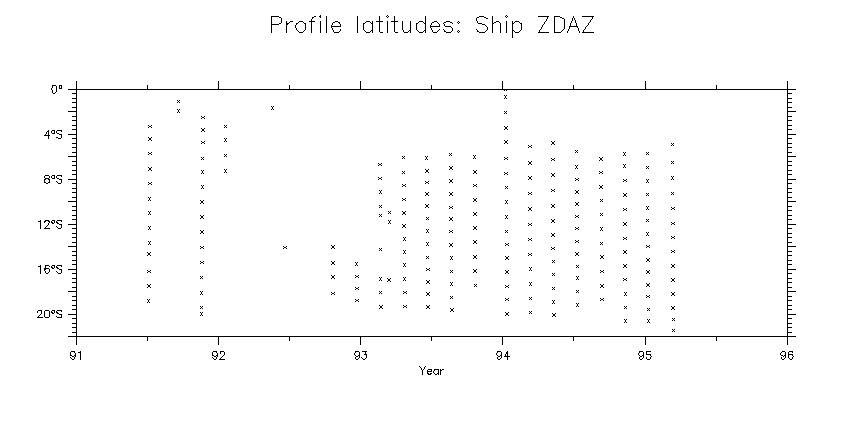
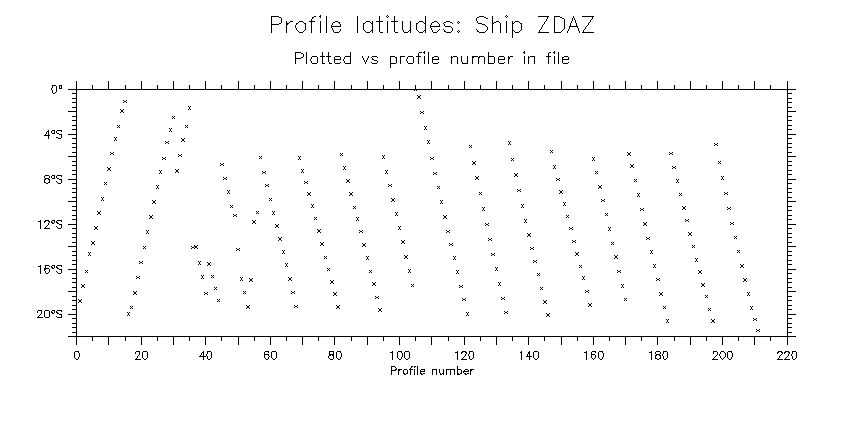
- ZDAZ (all)
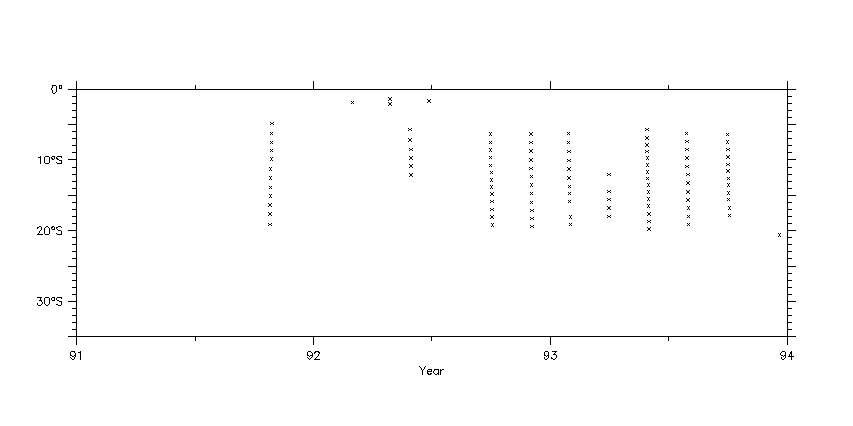
Details: 1991-95 Profile numbers
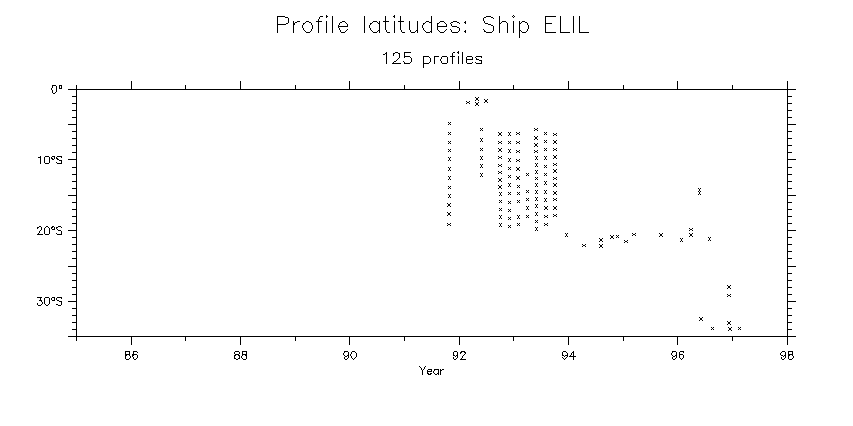
- ELIL (all)
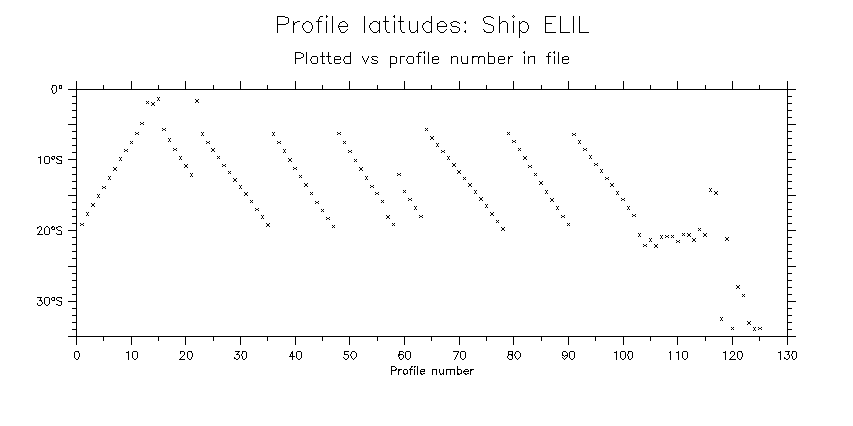
Details: 1991-94 Profile numbers
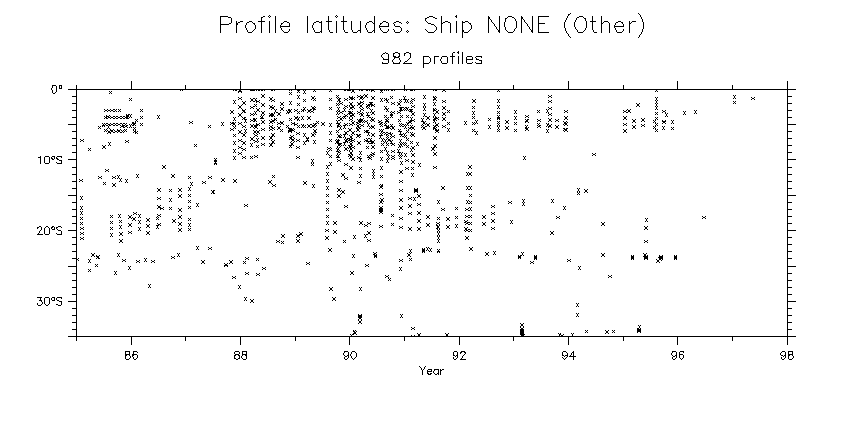
- NONE = Unclassified (not organized as tracks)
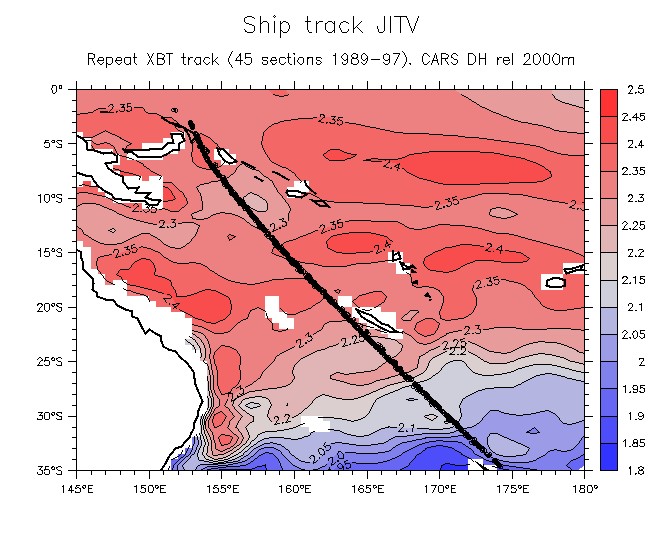
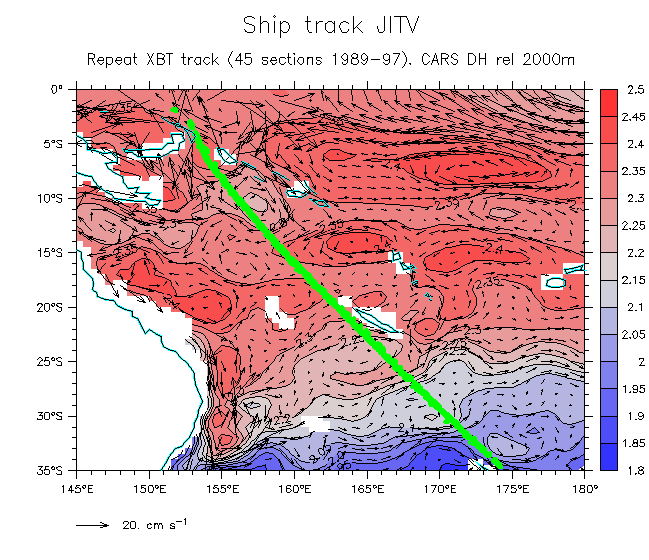
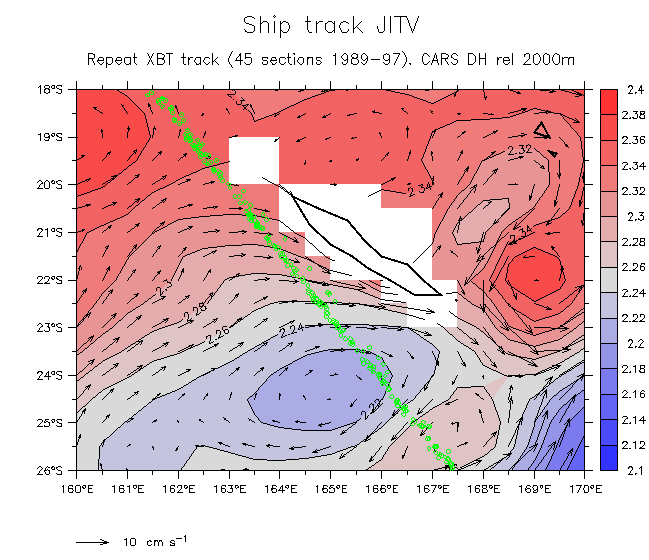
- JITV track: Over CARS DH And vectors NC detail
- Mean and RMS:
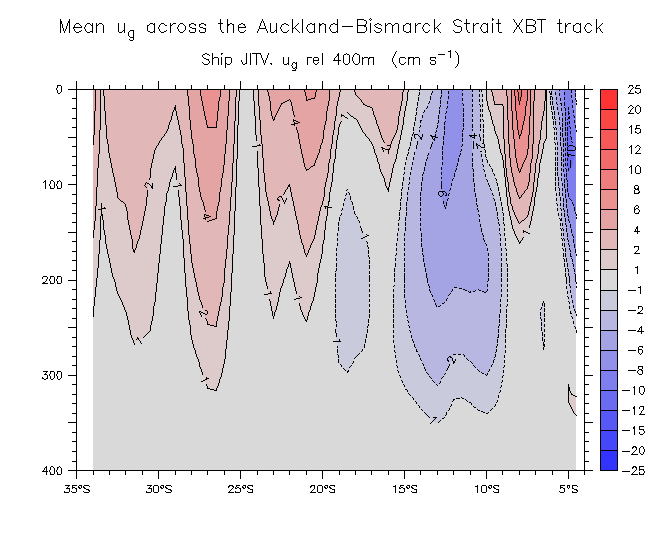
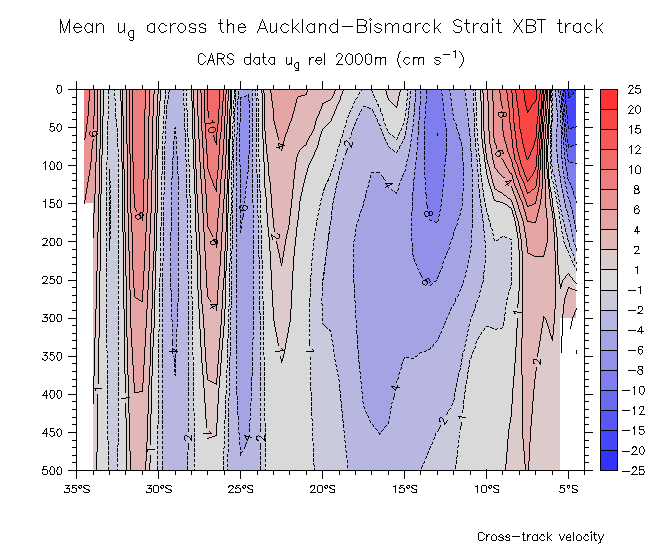
- ug mean
- ug RMS
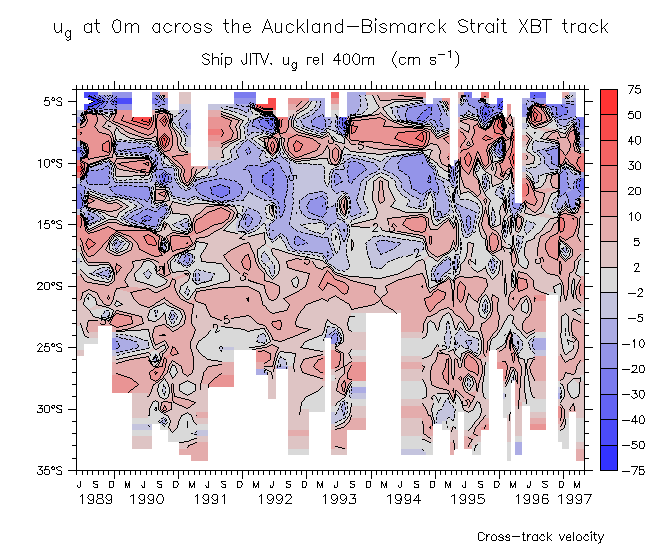
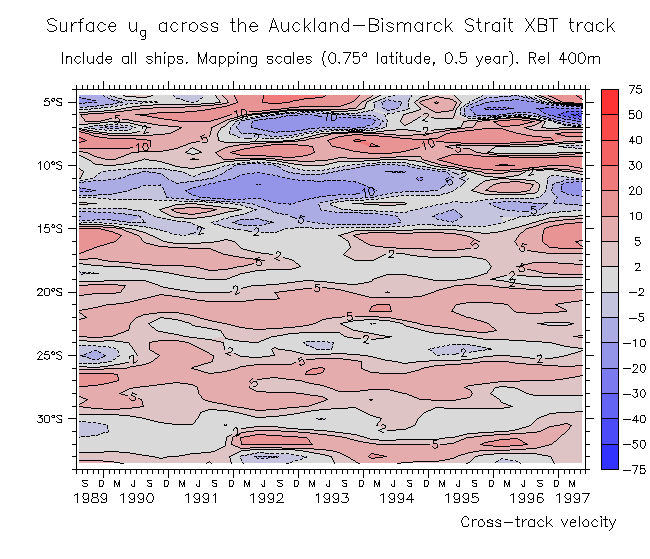
- u_g time series:
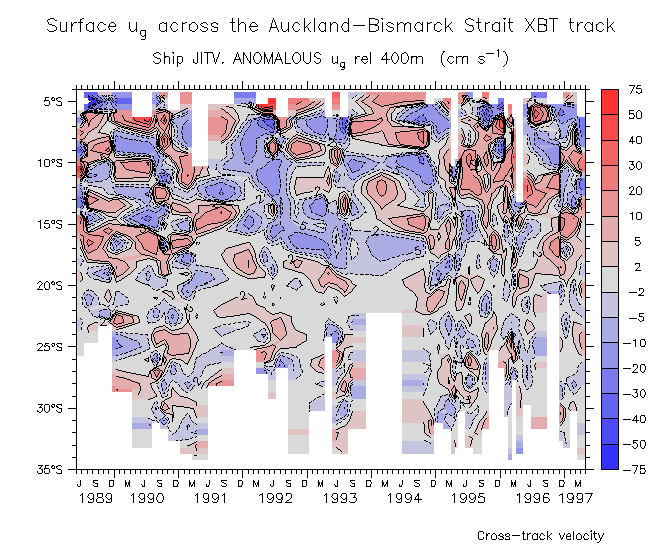
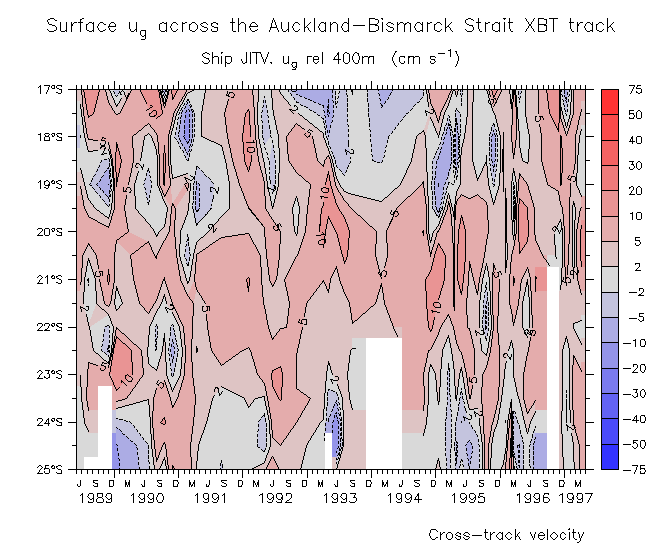
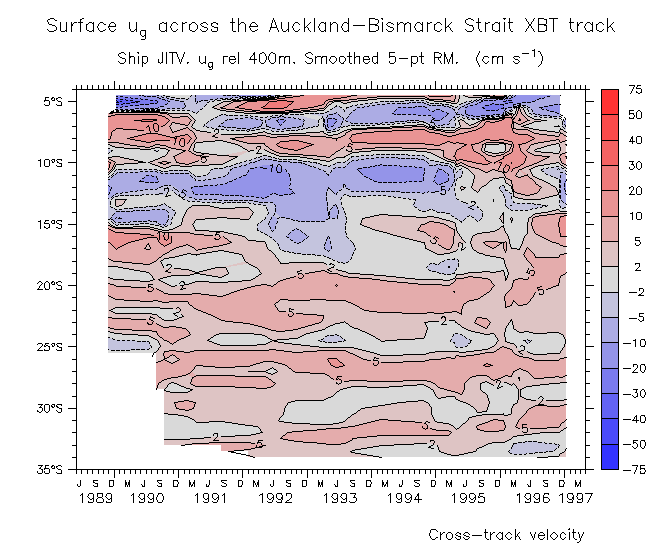
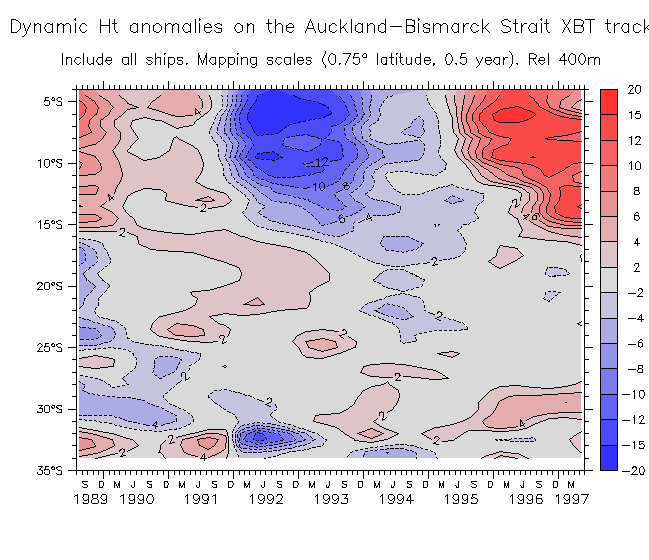
- Surface Anomalies Detail W of NC Smoothed
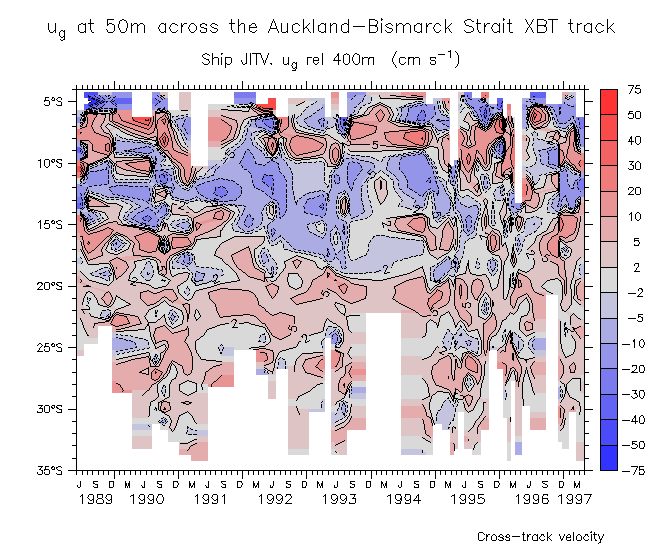
- 50m
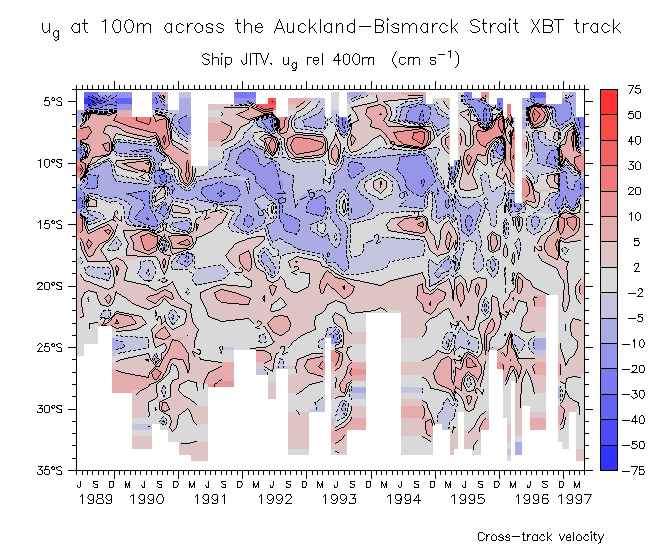
- 100m
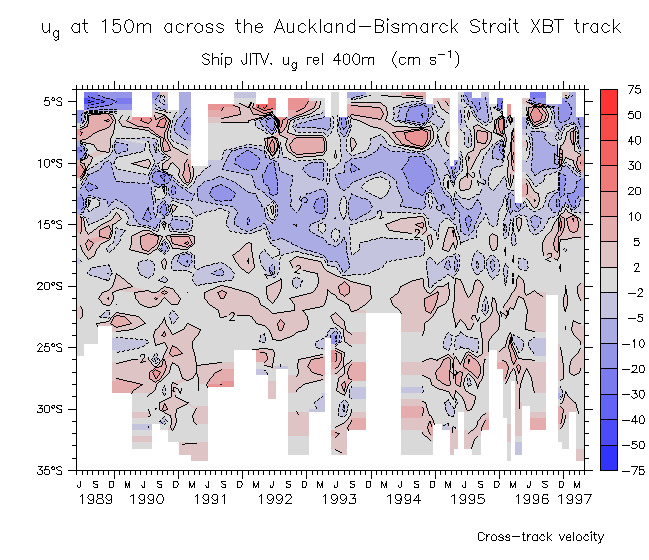
- 150m
- 200m
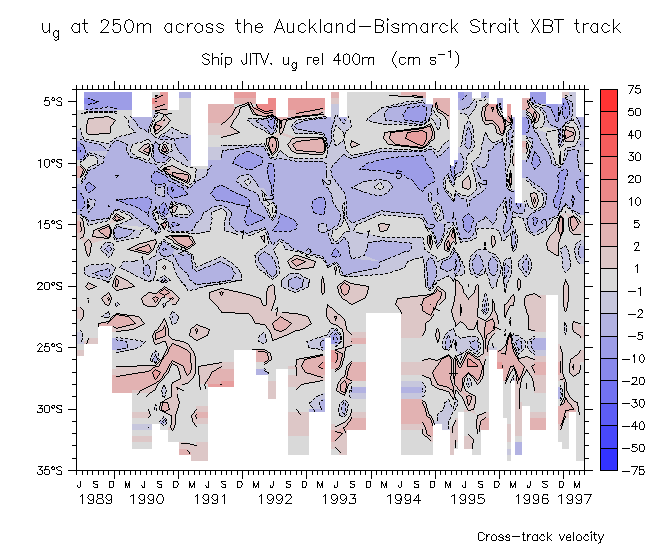
- 250m
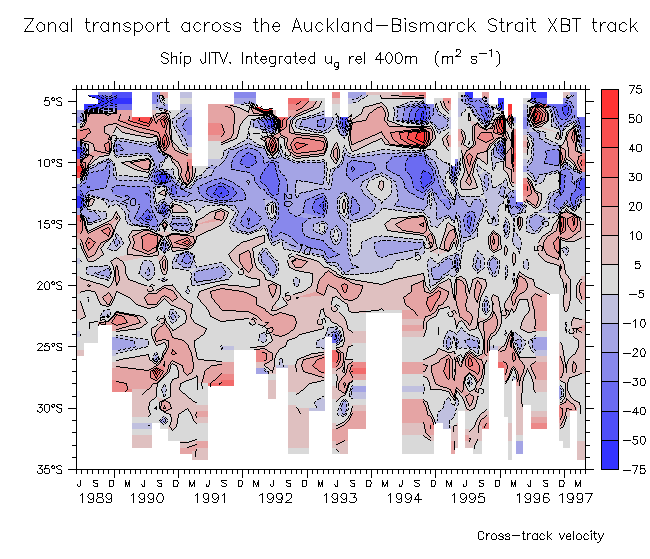
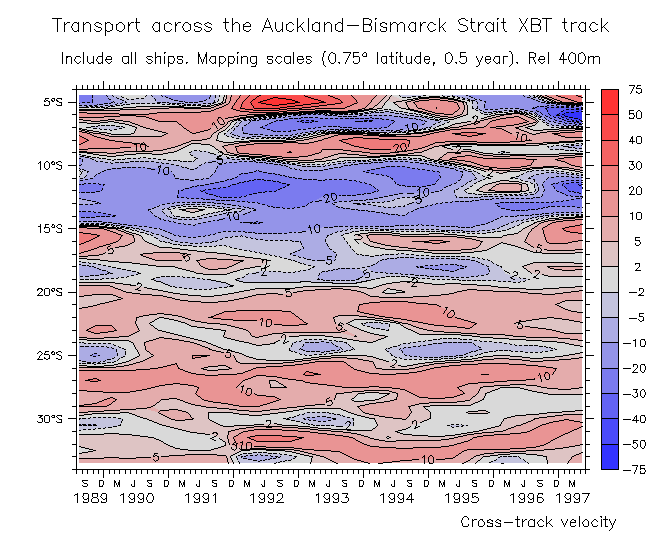
- 0-400m Transport
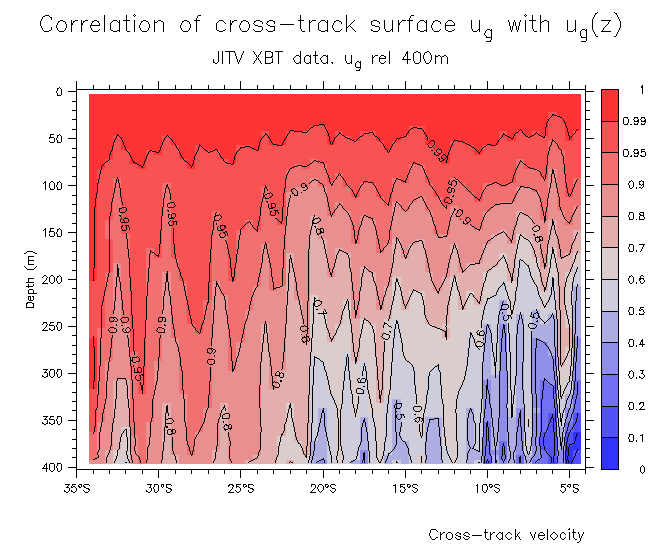
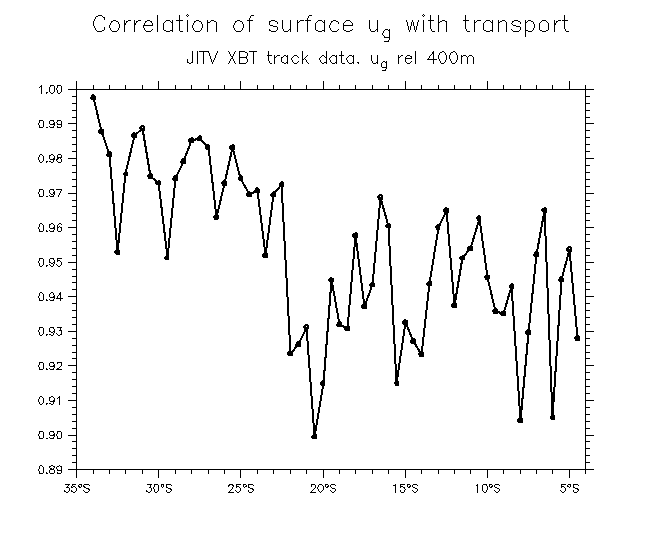
- Depth variability correlations: Surface vs all depths Surface vs transport
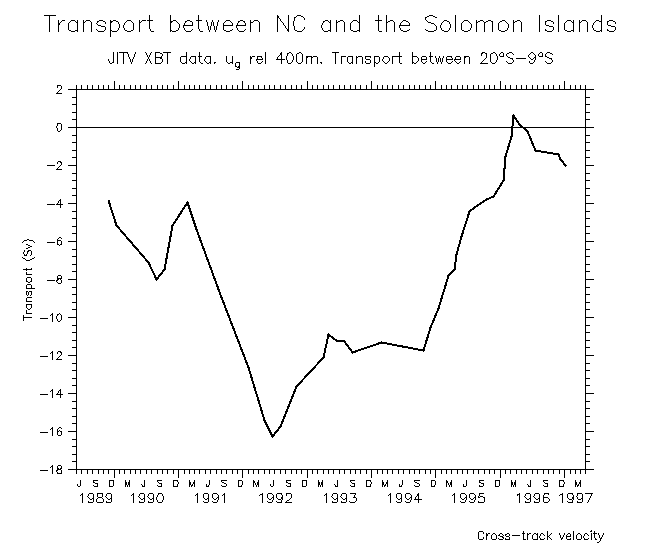
- Transport between NC and the Solomons
- Compare CARS
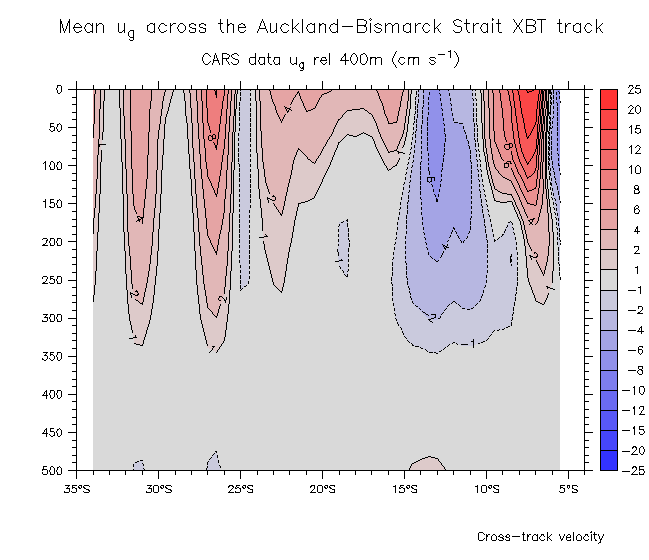
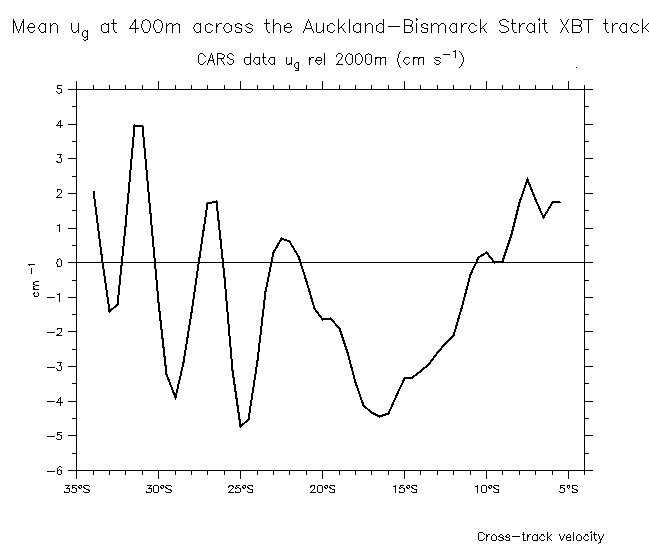
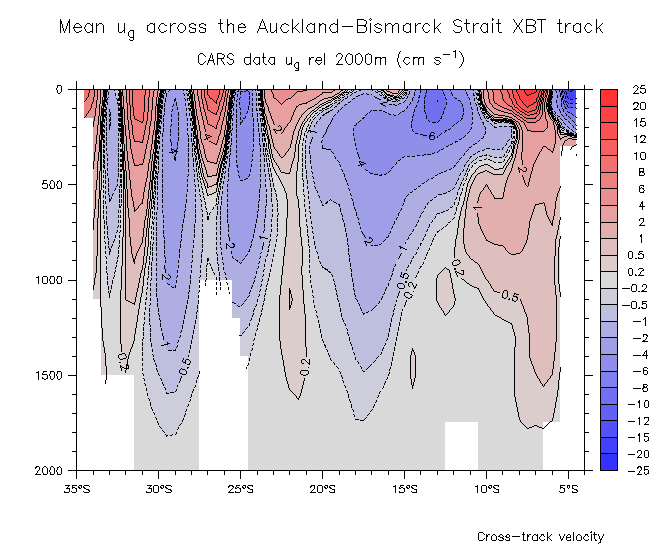
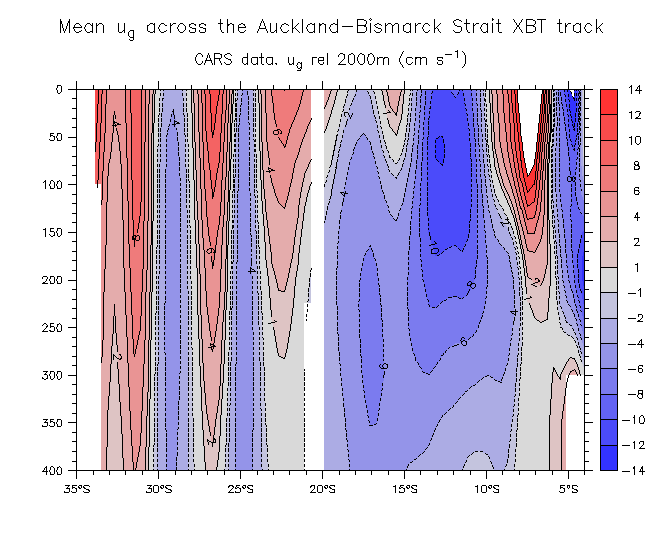
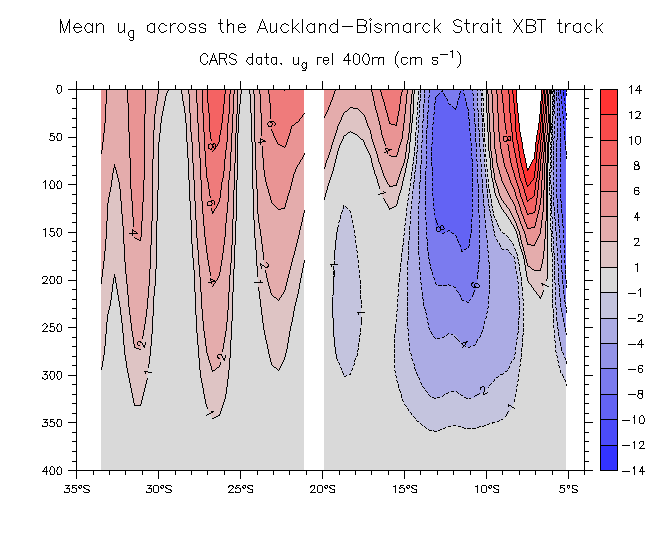
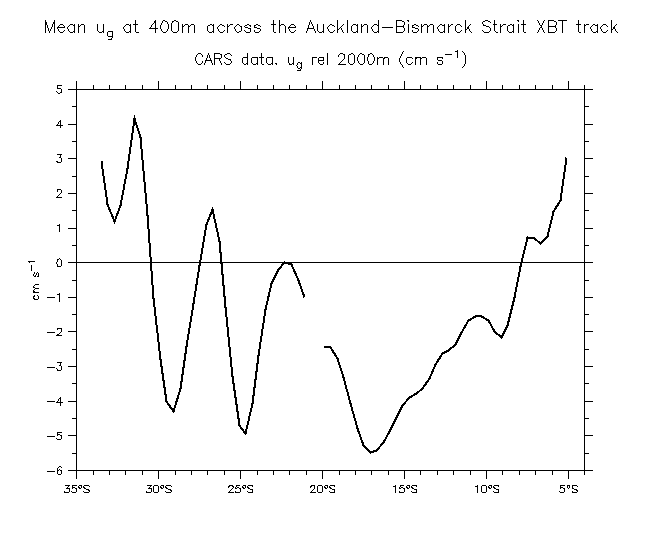
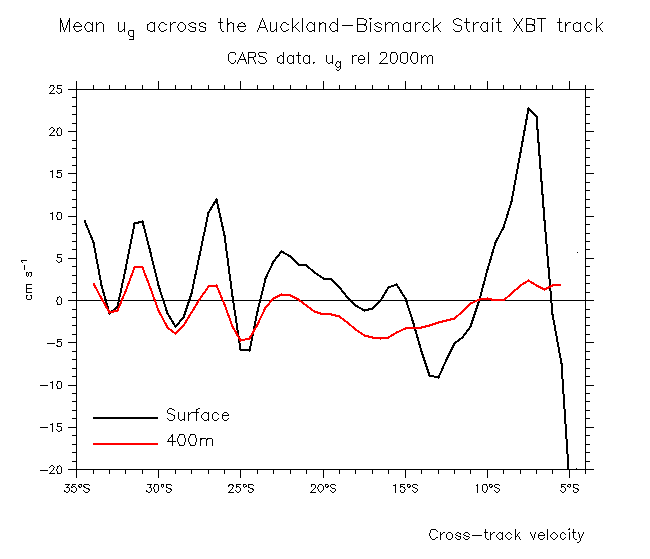
- CARS cross-track velocities: Rel 2000m Rel 400m u_g at 400m rel 2000m 0-2000m
Assume u-component only: Rel 2000m Rel 400m u_g at 400m rel 2000m
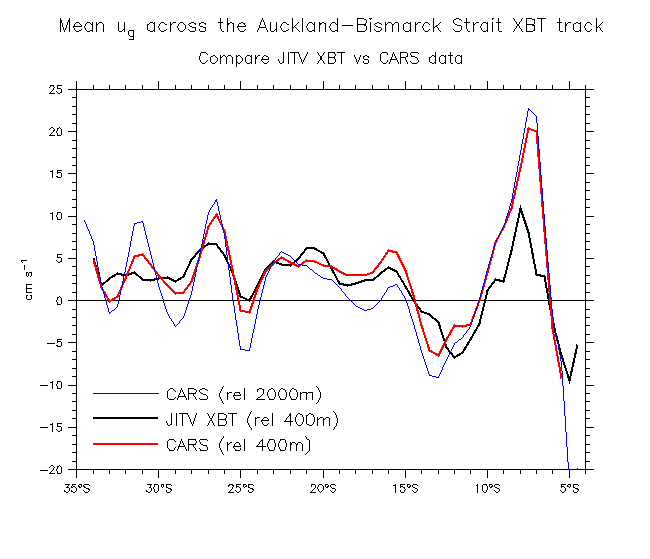
- CARS u_g at surface and at 400m CARS vs JITV mean u_g
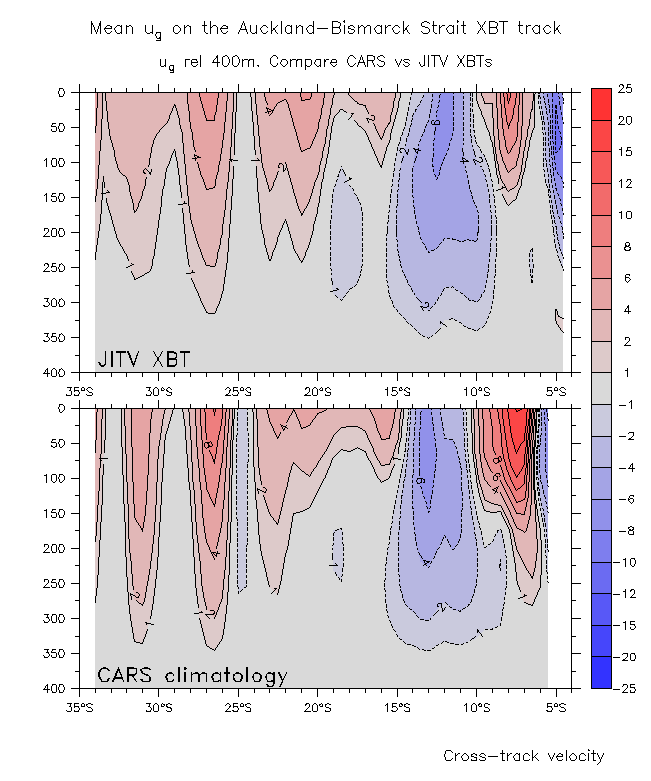
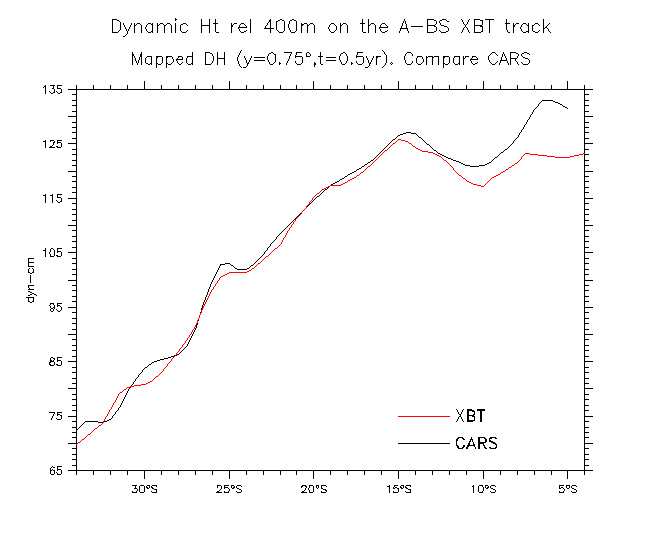
- Compare: ug rel 400
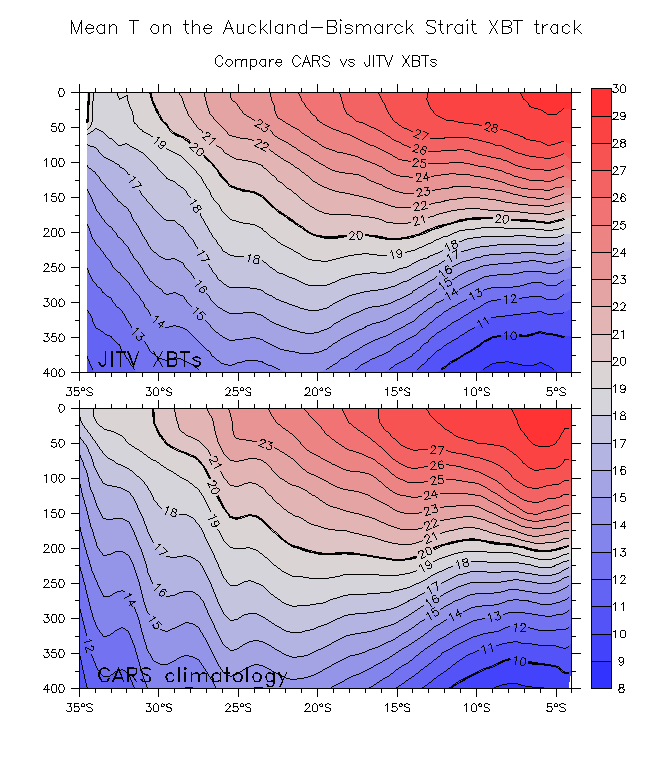
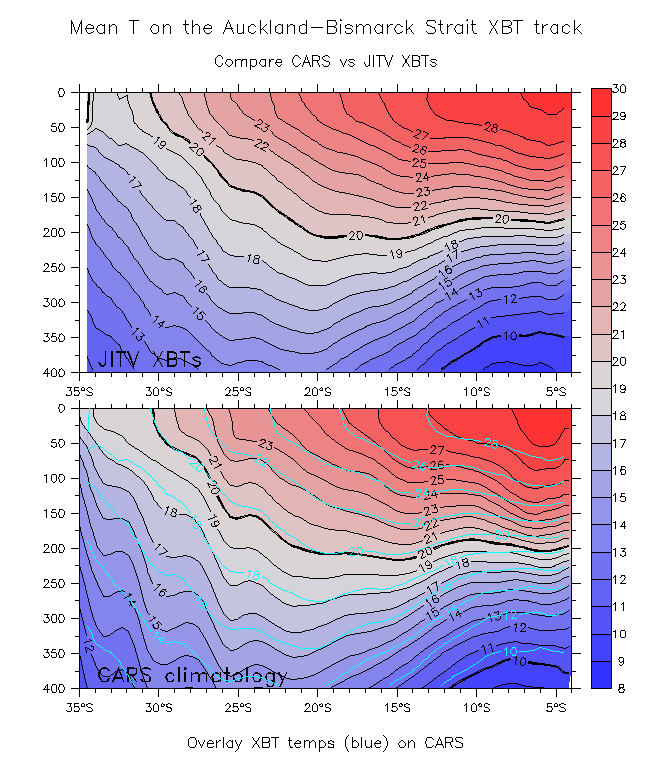
- Compare: Temperature Overlay contours
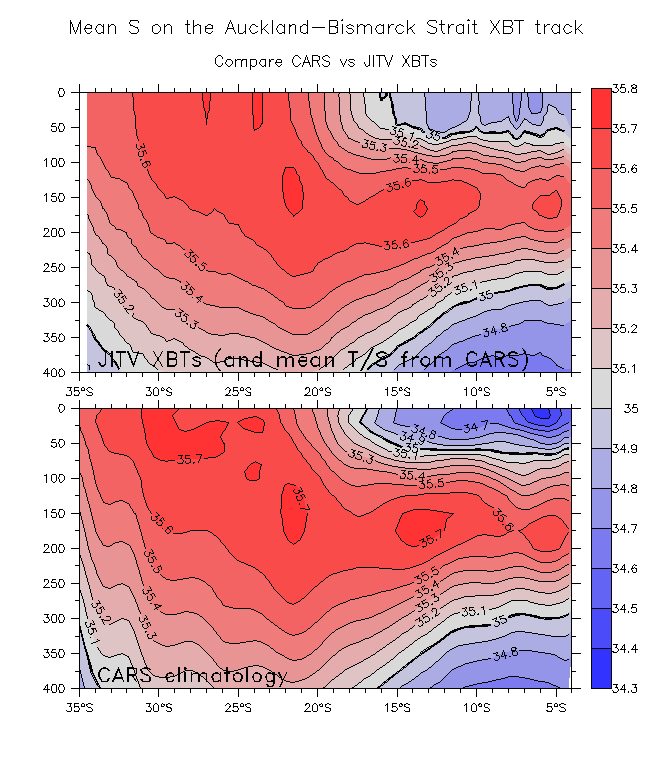
- Compare: Salinity Overlay contours
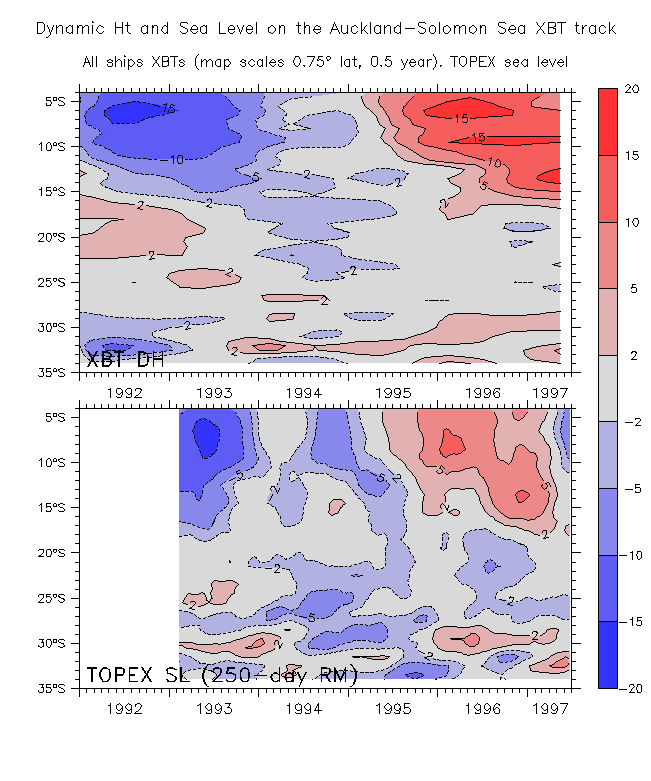
- Compare TOPEX
- Mapped DH vs TOPEX along the track
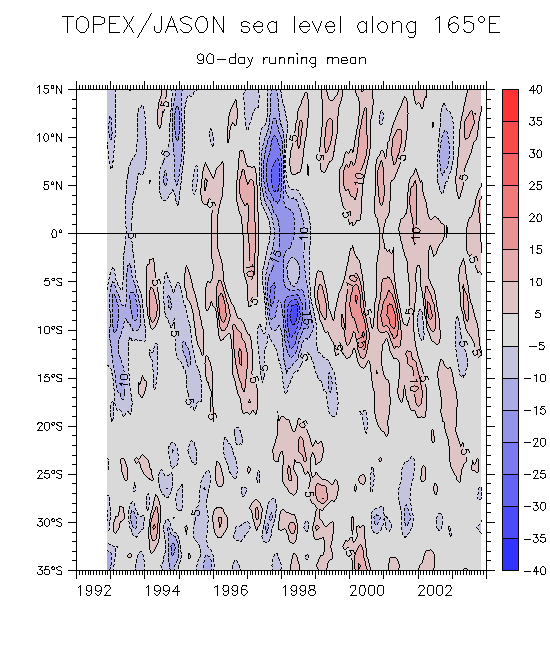
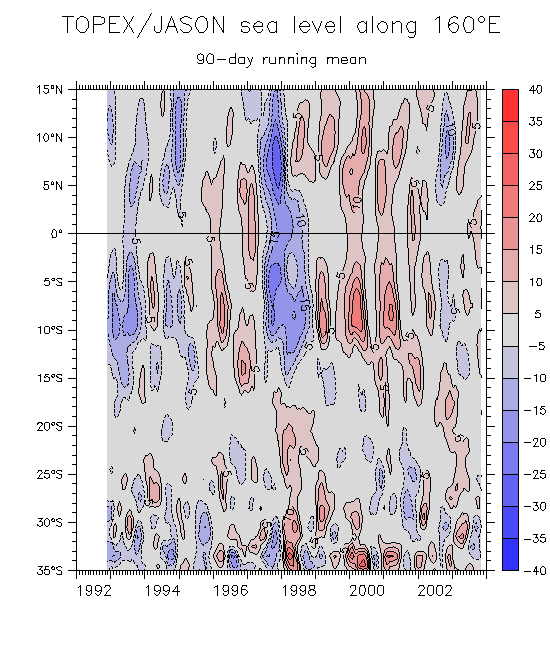
- Topex 35°S-15°N: 165°E 160°E
- Mapped fields (map-all1.f, map-all1b.f, map-all1-ug.f)
- Locations of mapped profiles (over DH)
- DH anomaly time series
- Cross-track sfc velocity
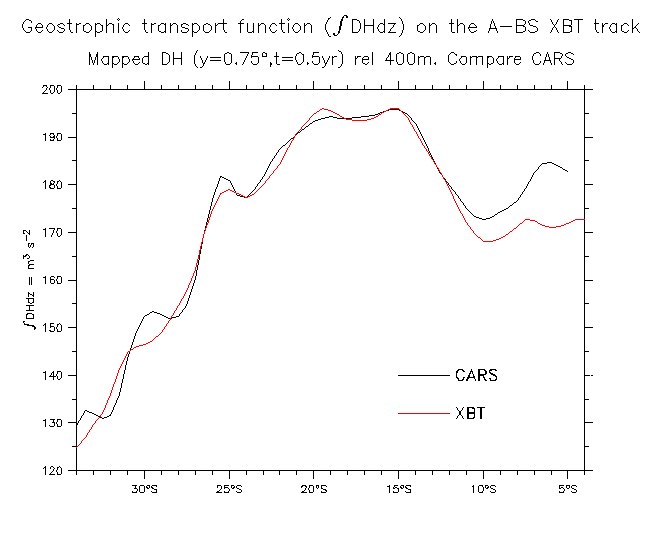
- Cross-track transport Transport NC-Solomons
- CARS checks and comparisons:
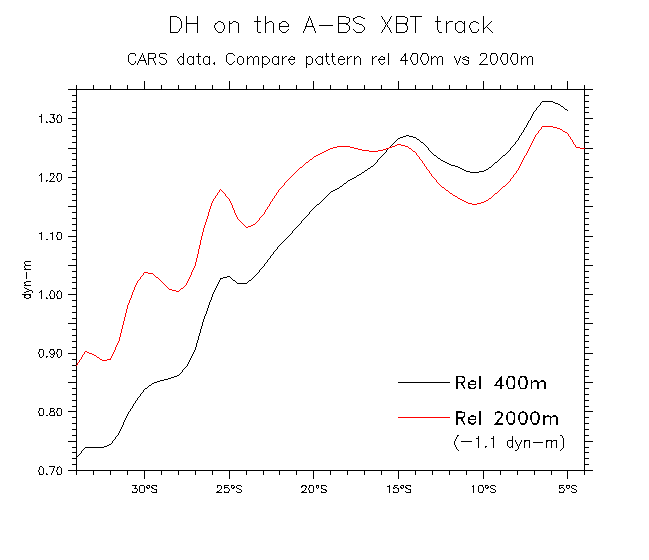
DH Int(DH)dz CARS 400m vs 2000m DH
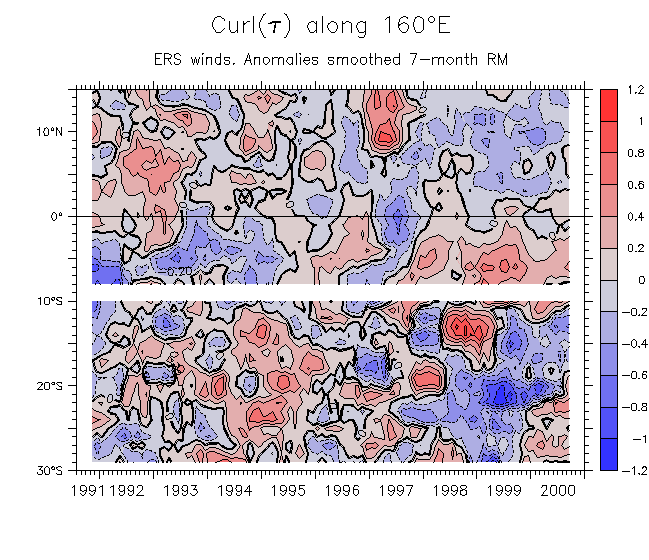
- Curl anomalies along 160°E
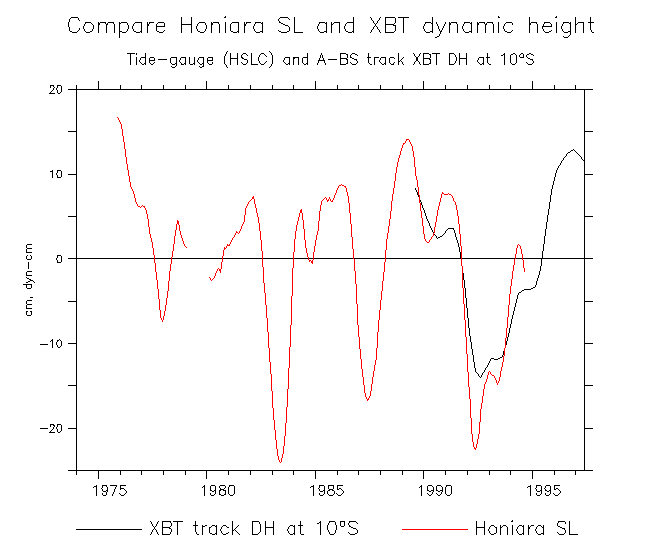
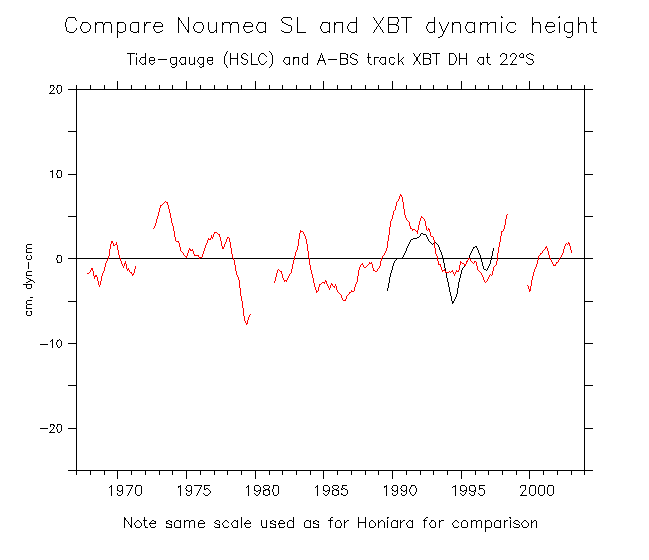
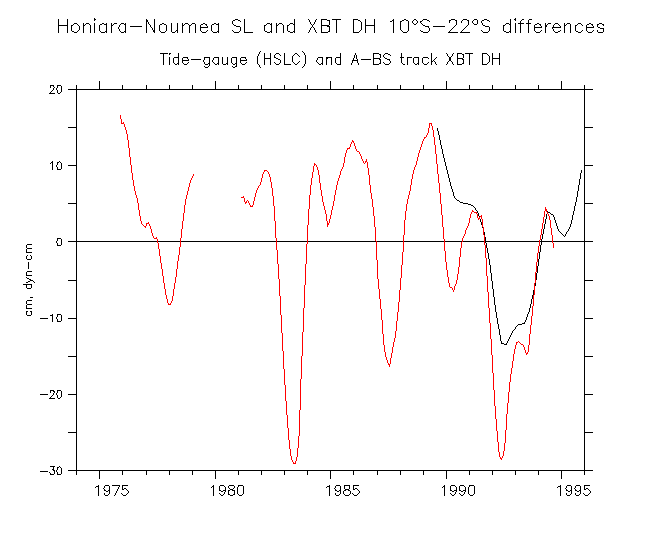
- Honiara-Noumea SL and XBT track DH
- Honiara SL and XBT DH at 10°S
- Noumea SL and XBT DH at 22°S
- Honiara-Noumea SL and XBT DH differences
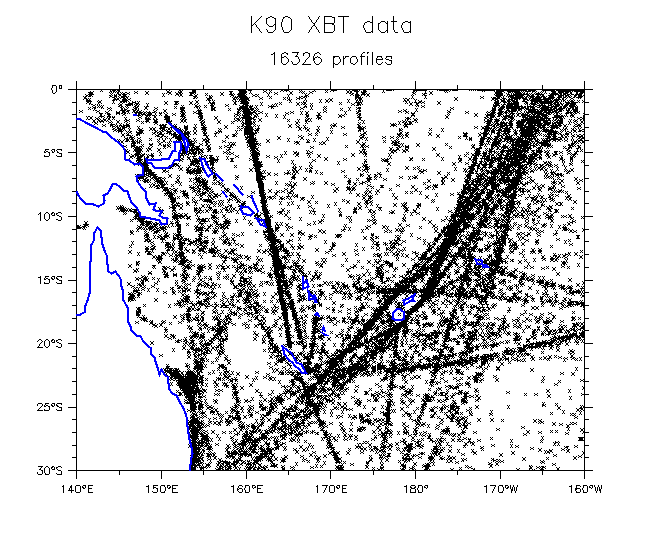
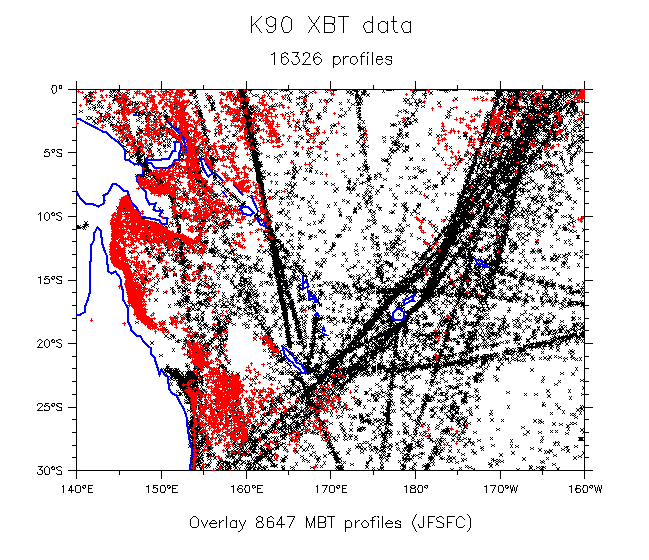
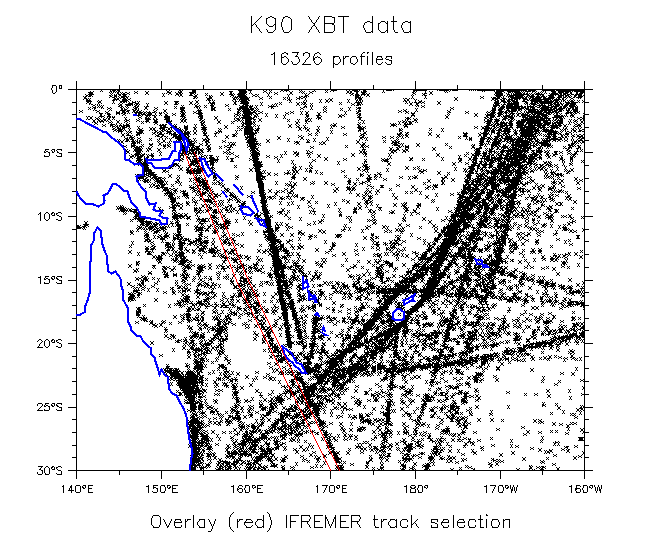
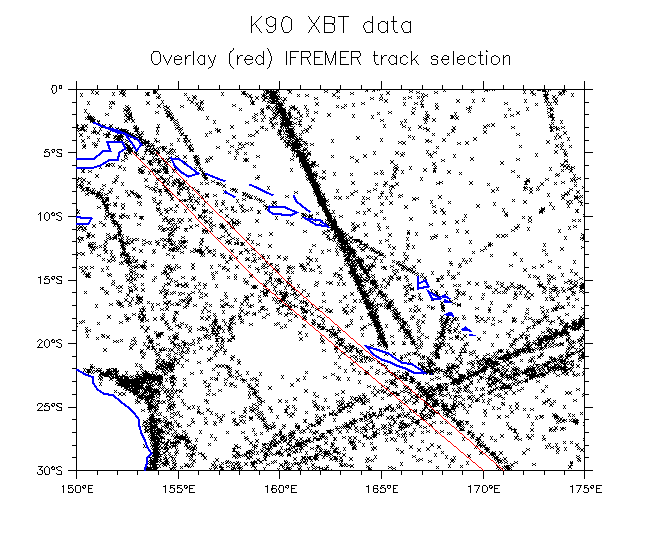
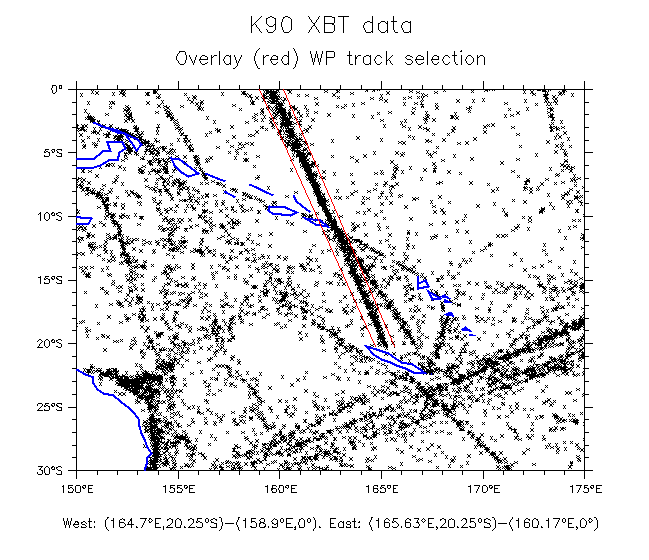
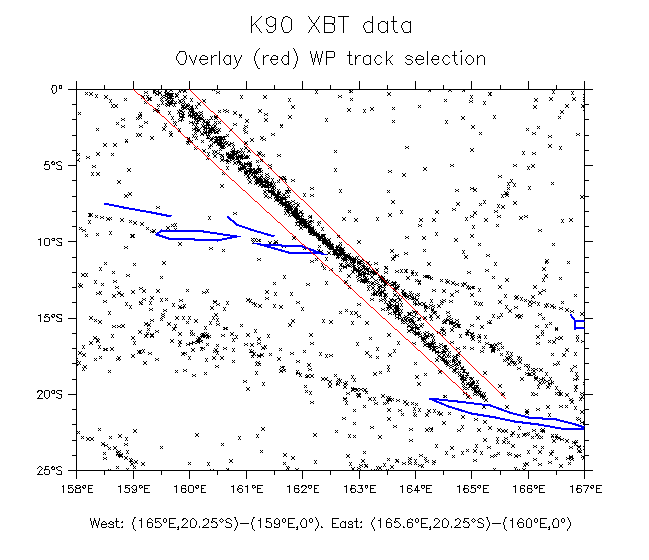
- K90 XBT data
- XBT Overlay MBTs
- XBTs, overlay IFREMER A-BS track Detail
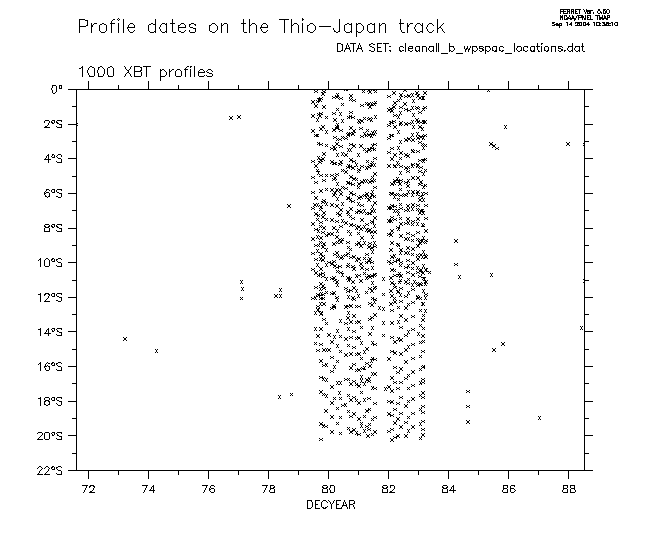
- Track Thio-Japan: Track selection V2 Profile dates
- BMRC comparisons
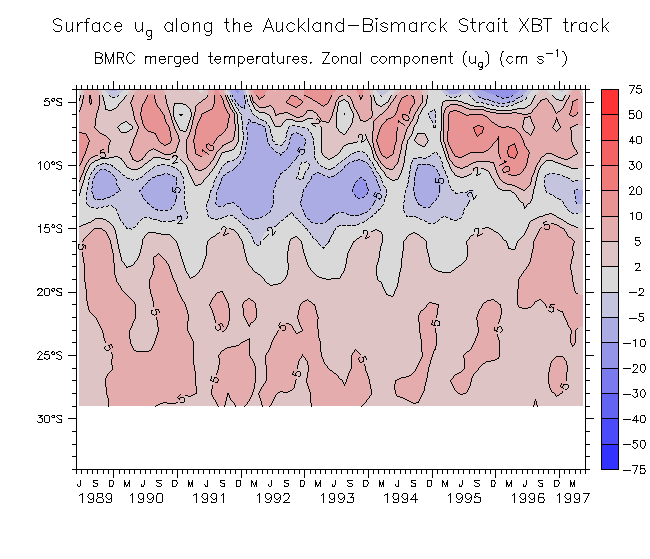
- Surface u_g (1989-97)
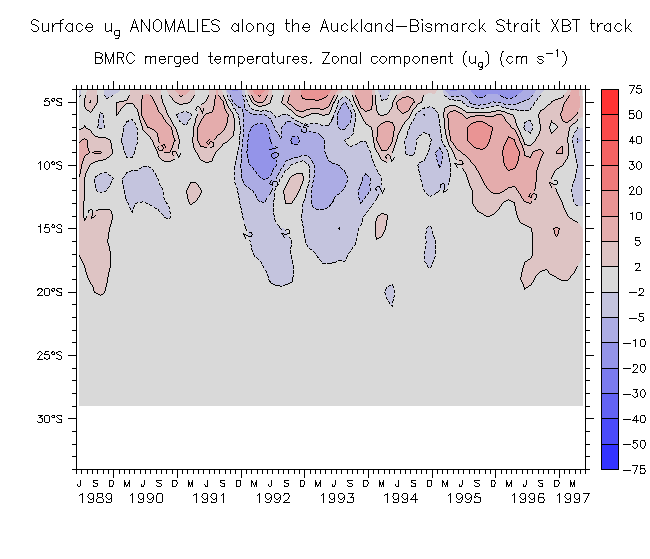
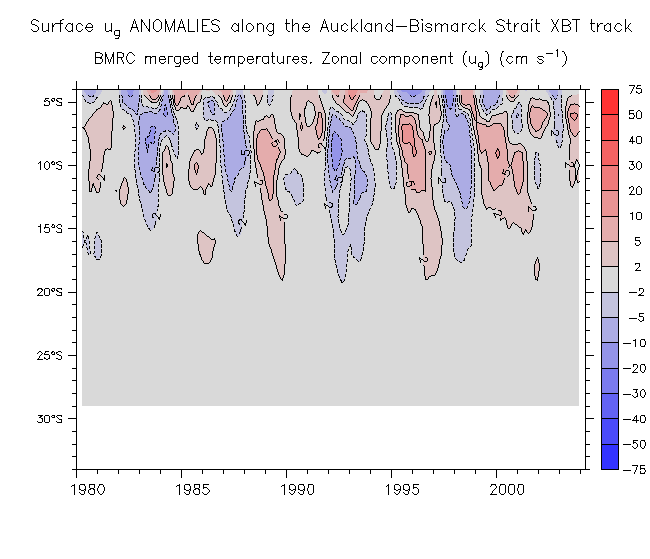
- Surface u_g anomalies (1989-97) Surface u_g anomalies (1980-2004)
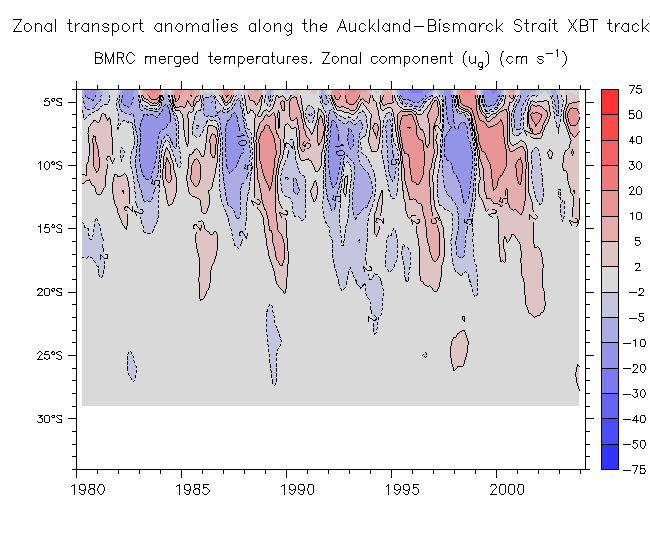
- Transport anomalies (1980-2004)
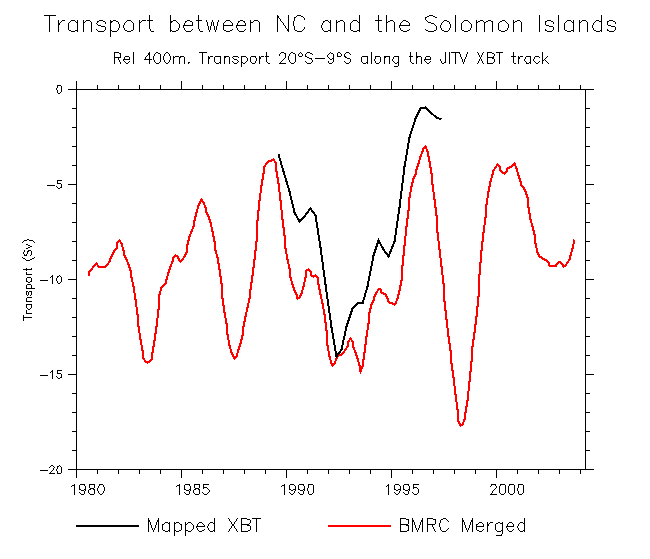
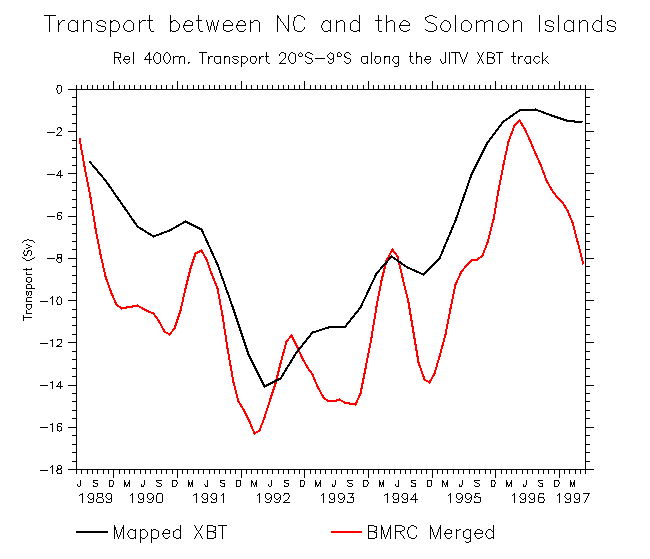
- Transport NC-Solomons: 1980-2004 1989-97
Return to main page
Other pages: