Figures showing IFREMER XBT track calculations (new data set)
Use XBT sections passing just west of New Caledonia to study the variability of the SEC between NC and the Solomon islands.
These calculations are based on a new XBT data set obtained in Sep 04 while in Noumea.
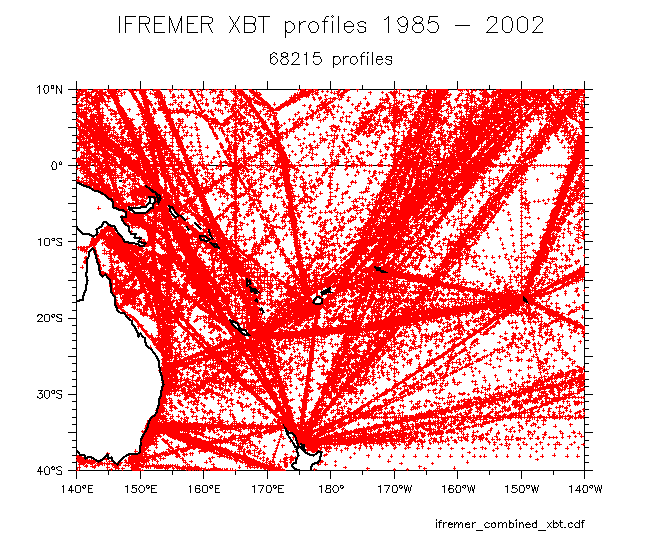
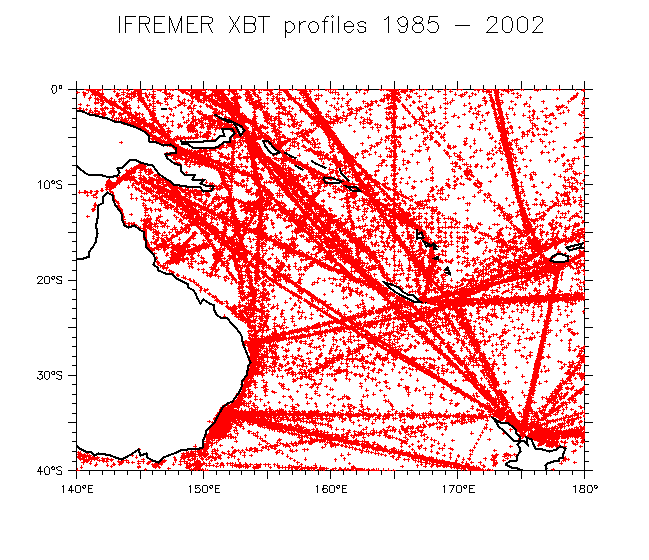
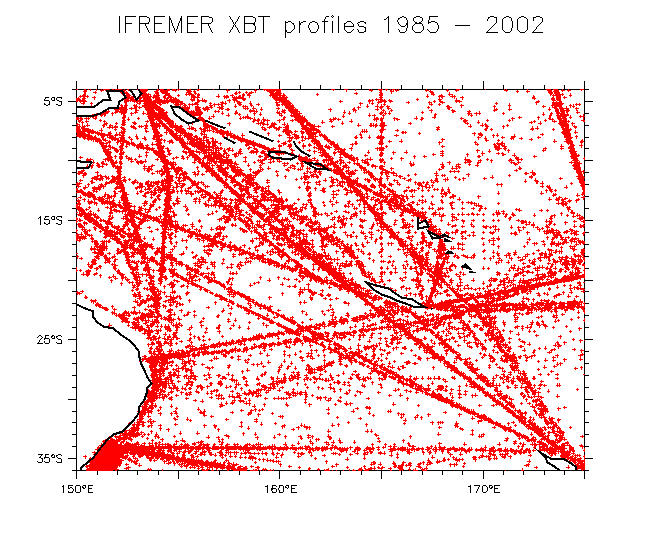
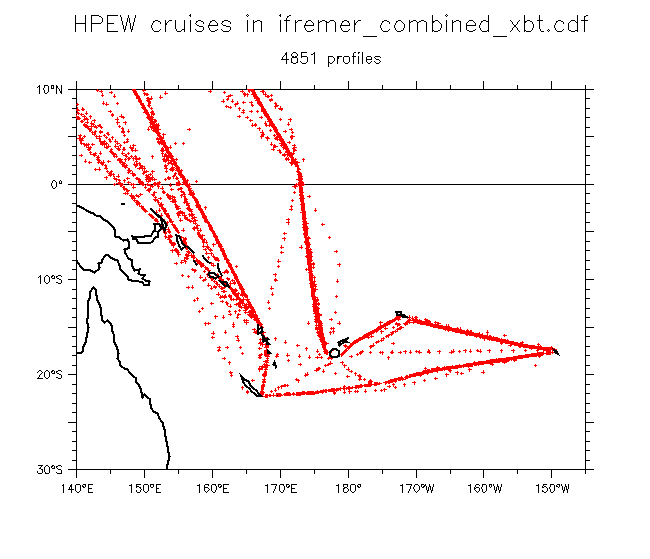
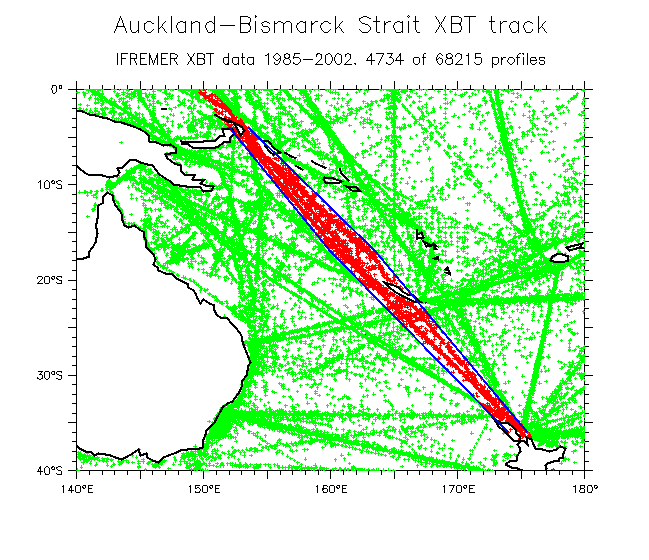
- Maps of the data: All data WP detail WP detail (2)
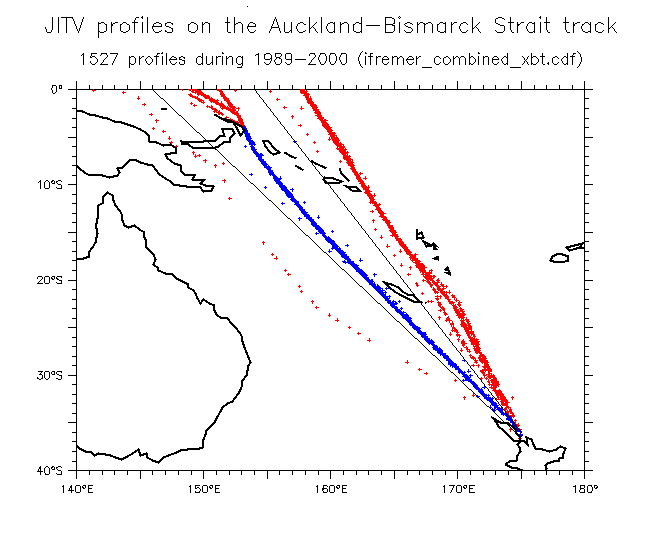
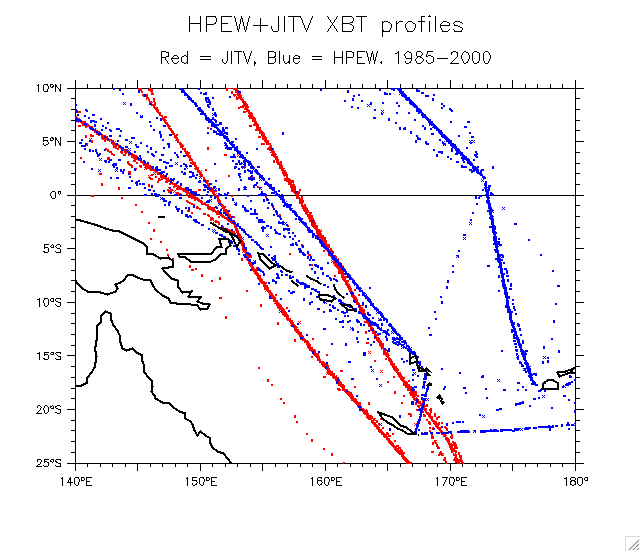
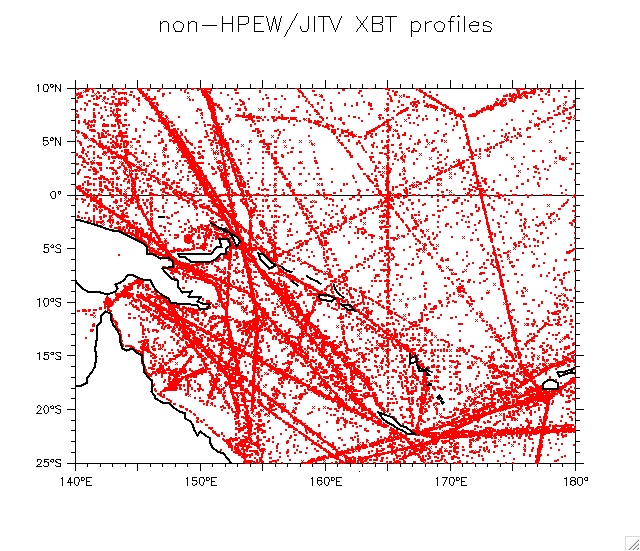
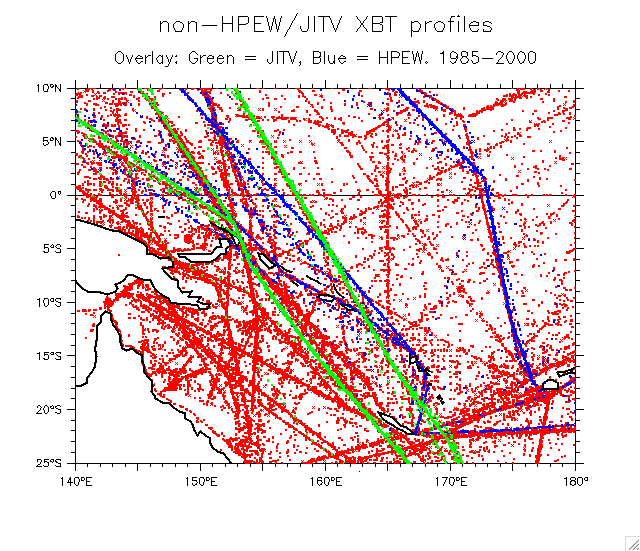
Useful ships: JITV HPEW JITV+HPEW non-JITV/HPEW (Overlay JITV and HPEW)
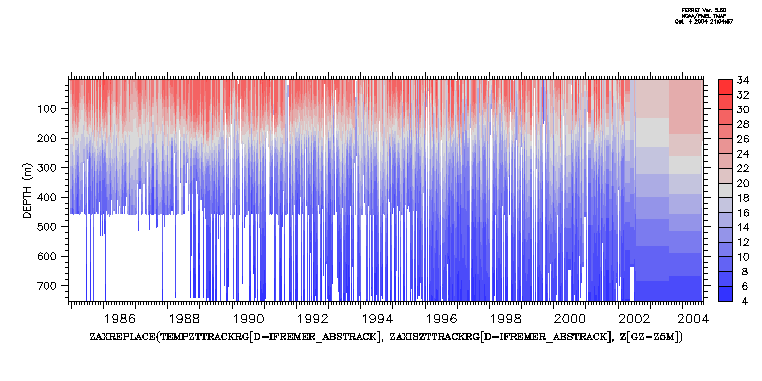
- Select the Auckland-Solomon Strait track
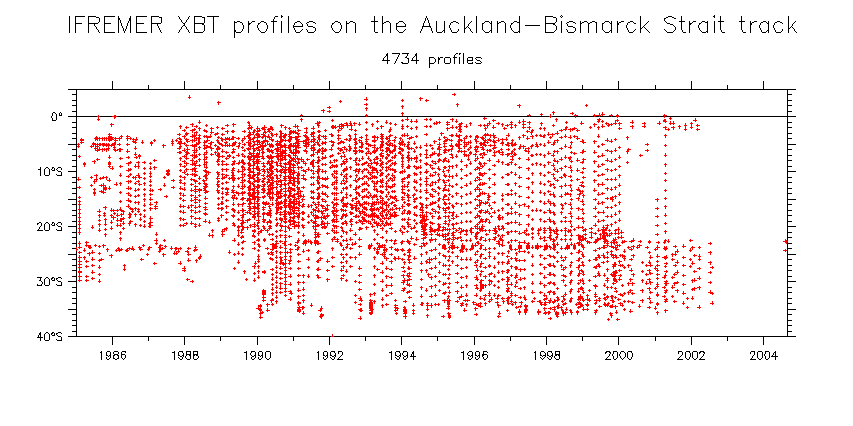
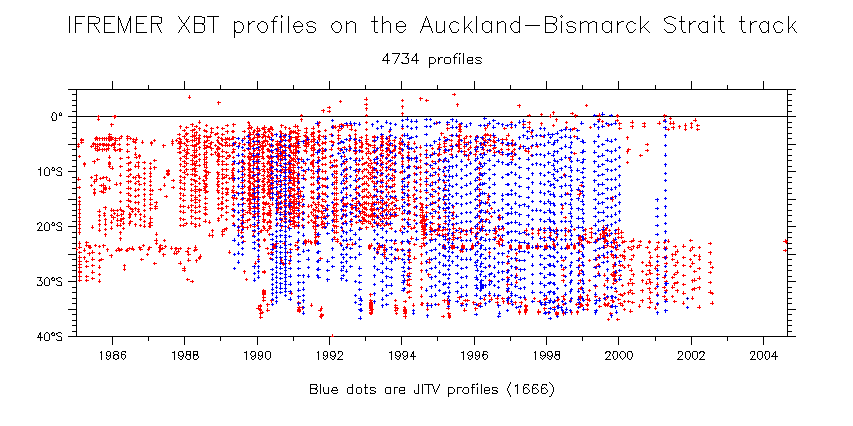
- Time-latitude distribution: All data
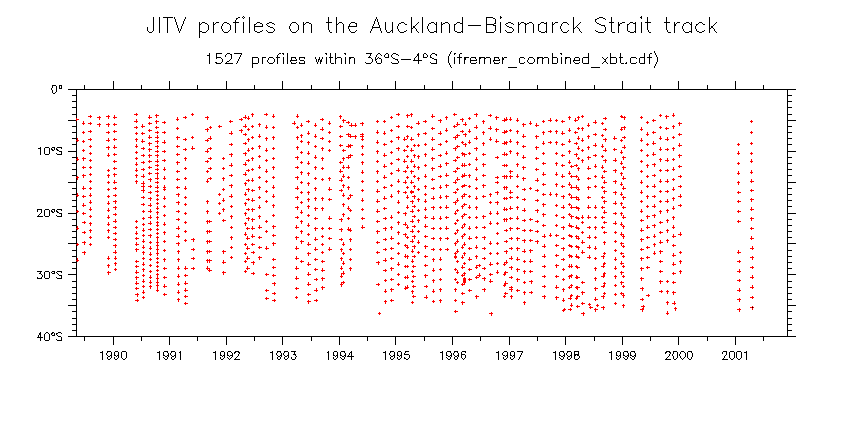
Overlay JITV Just JITV
- Time-depth distribution
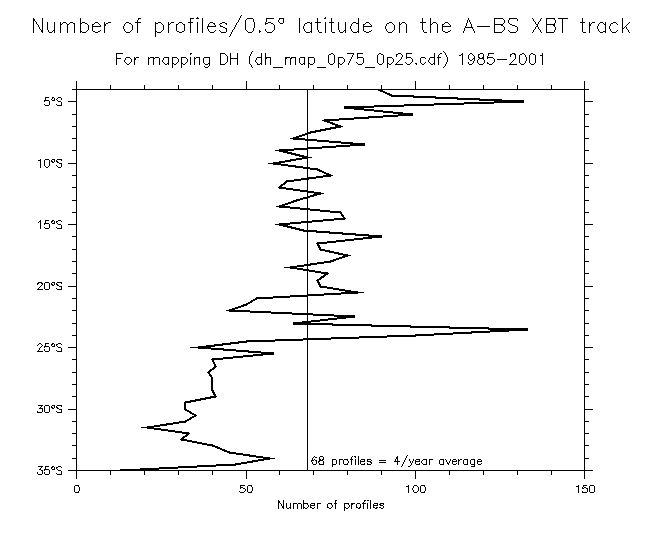
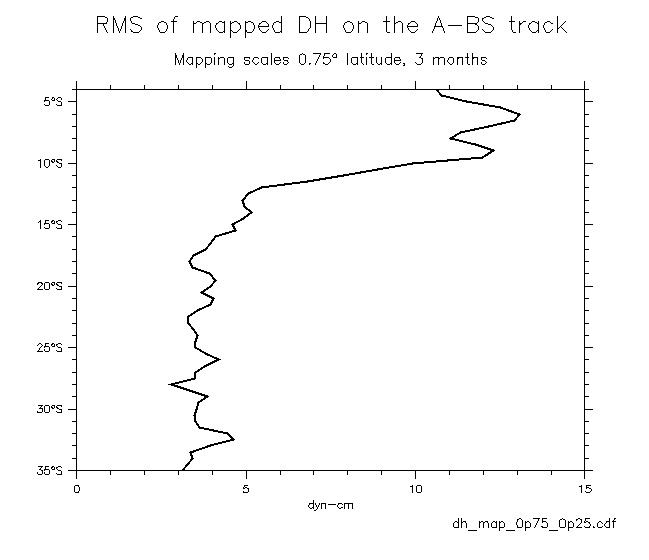
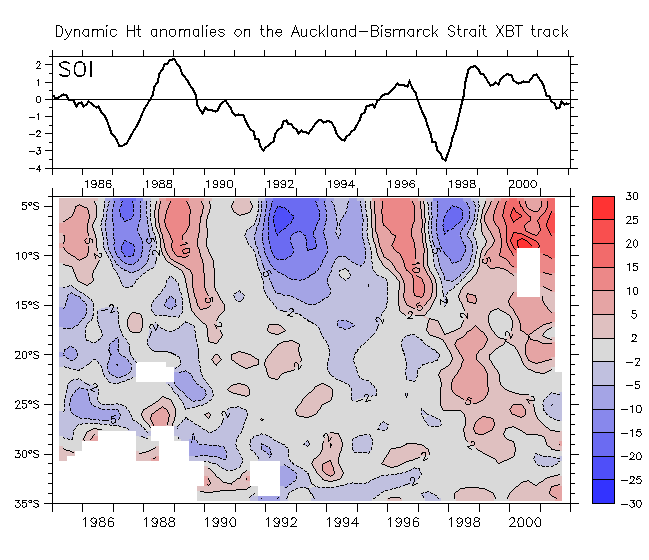
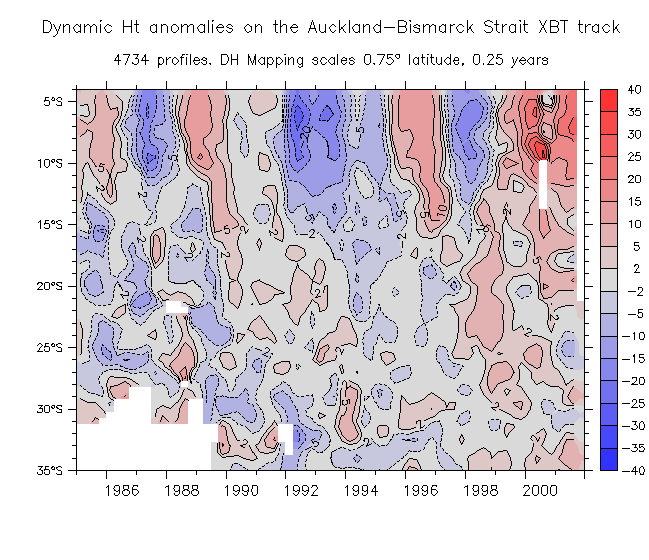
- Mapping DH:
- Distribution of mapped profiles
- RMS DH as a fn of latitude
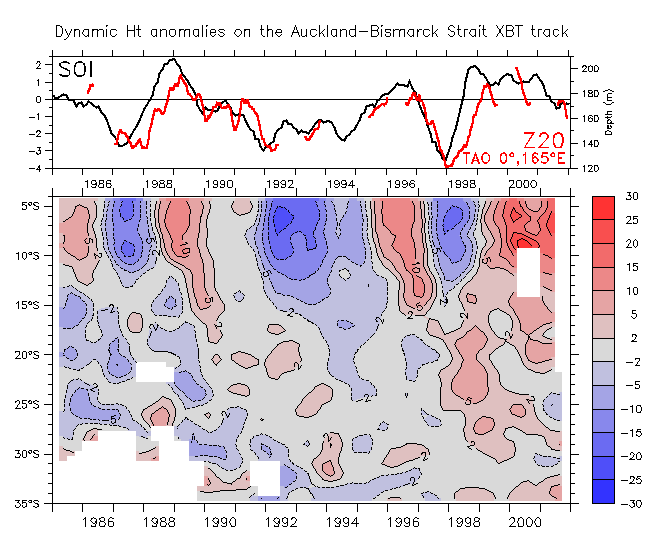
- Compare DH anomalies to ENSO indices: DH and SOI Overlay TAO Z20 at 0°,165°E Show RMS DH
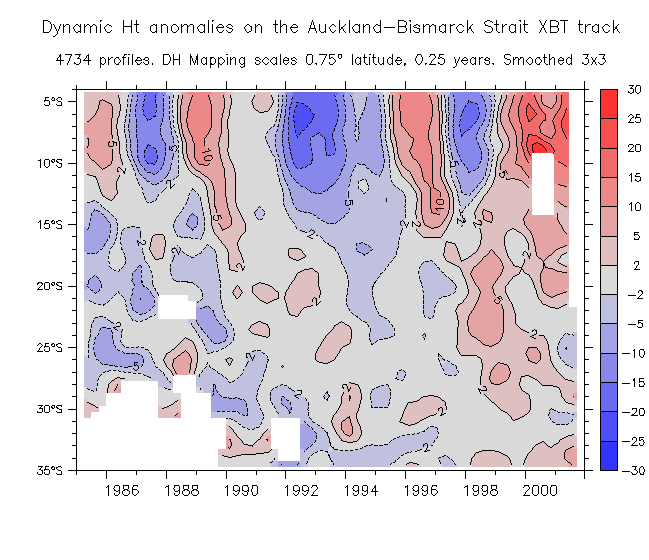
- Test smoothing: Anomalies Smoothed 3x3
- u_geostrophic:
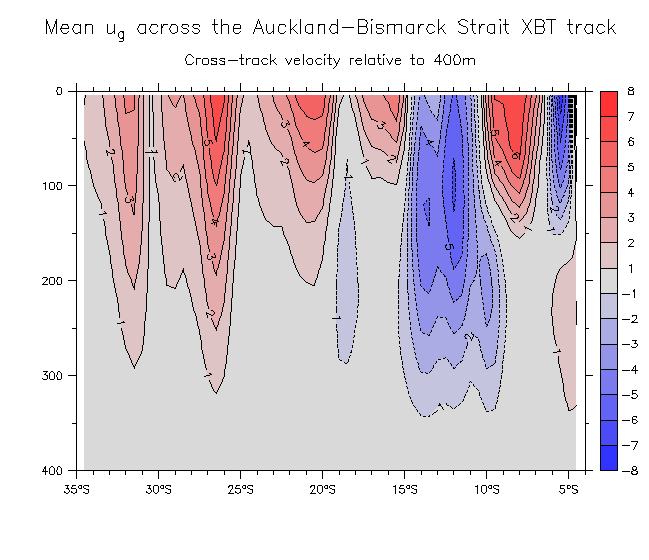
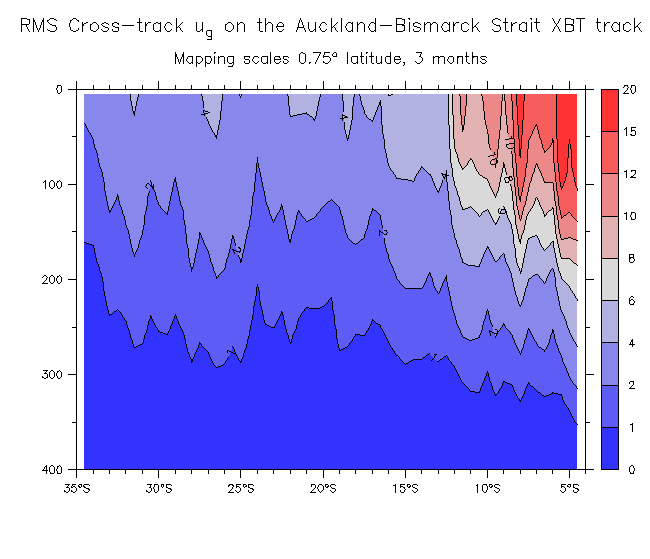
- Mean velocity (y,z) RMS
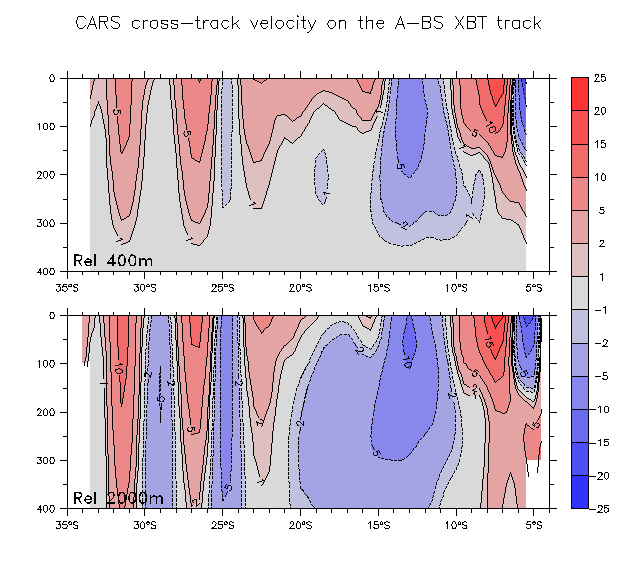
- CARS compare 2km vs 400m ref level on the track
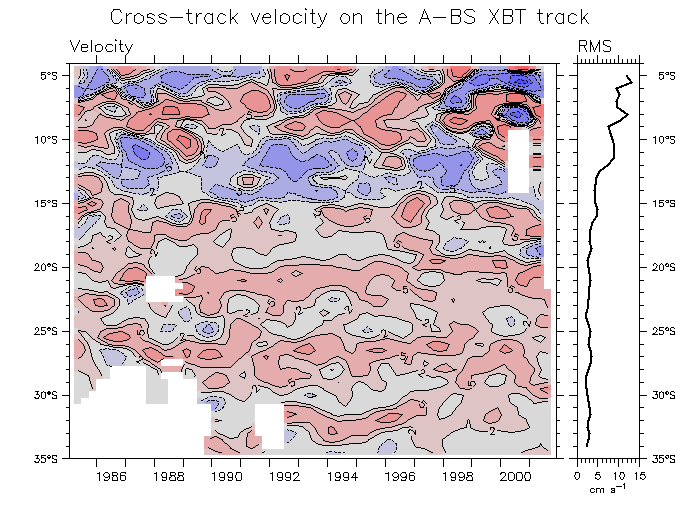
- Velocity as a fn of (y,t)
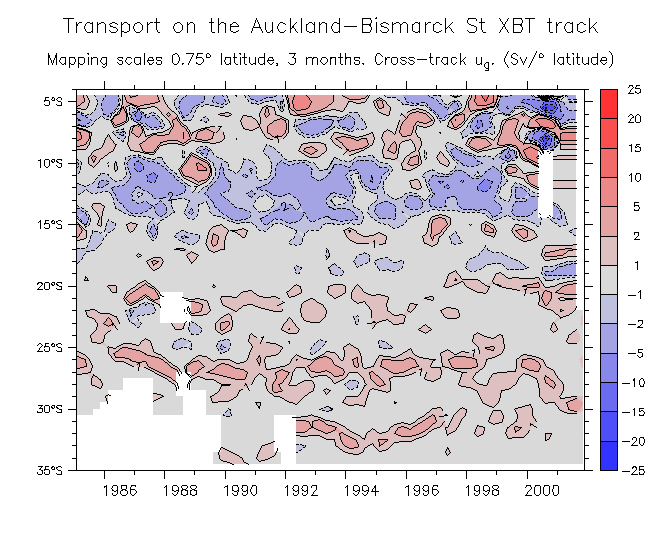
- Transport as a fn of (y,t)
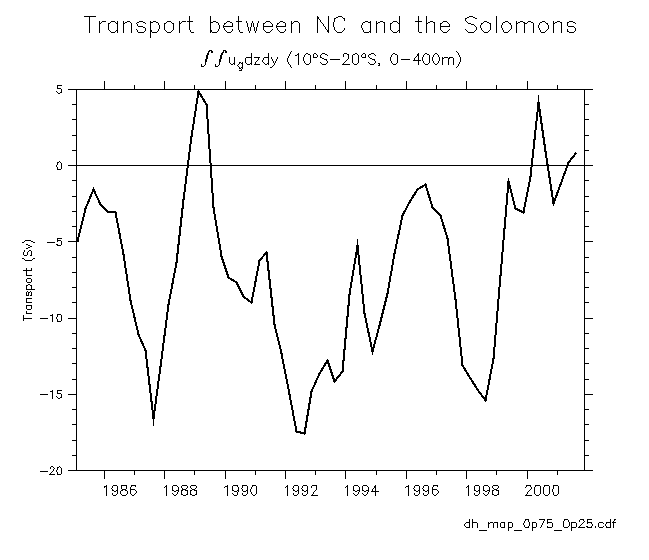
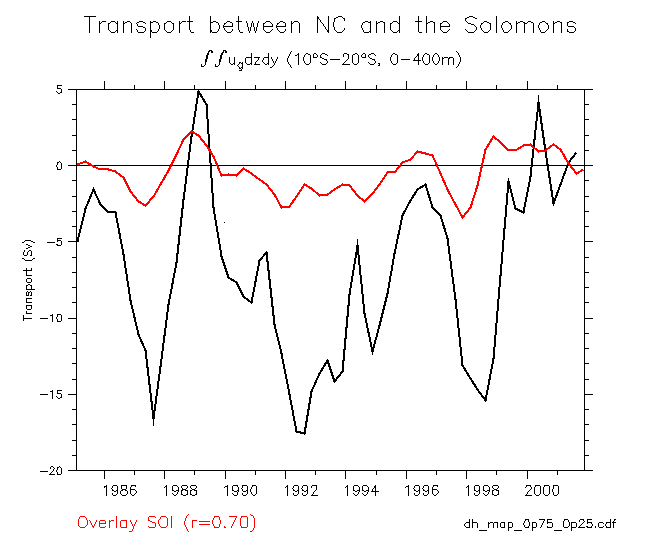
- NC-Solomons transport Overlay SOI
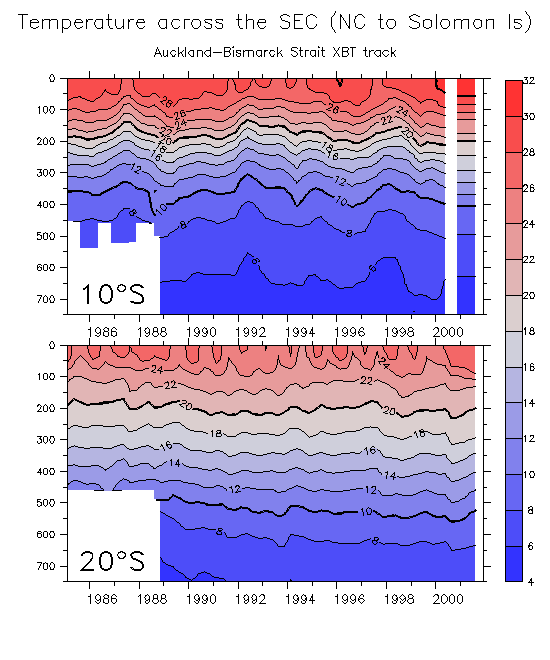
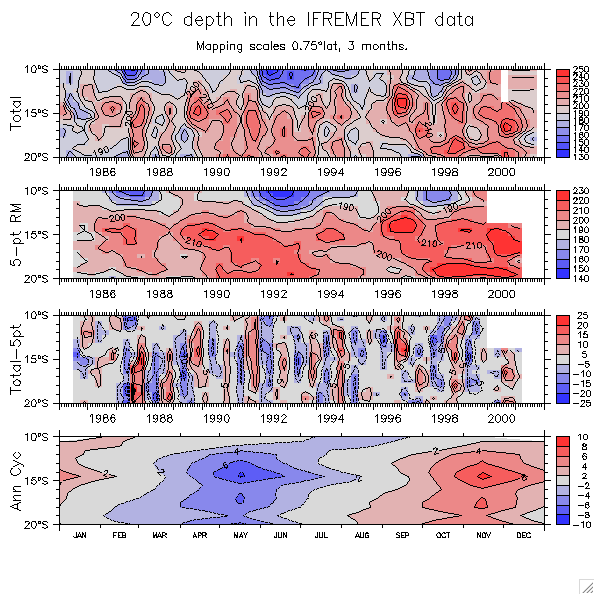
- Temperature and isotherm depth variability
- Compare temperature and isotherm depth time series at 10°S - 20°S (across the SEC)
- Two time series
- Differences across the SEC
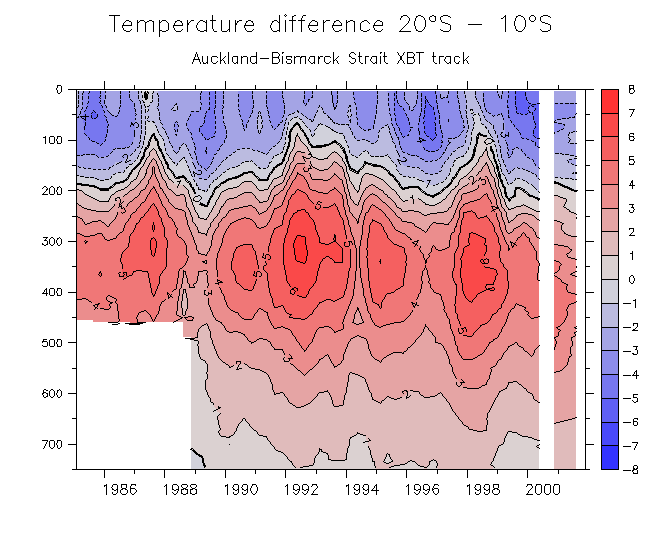
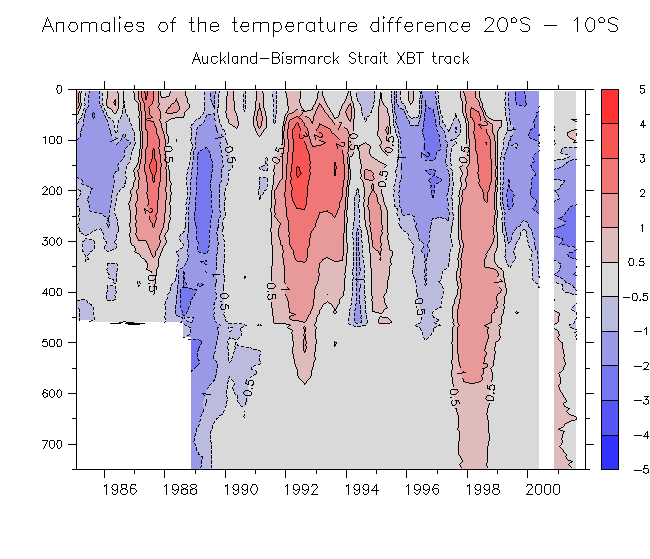
- Temperature difference 10°S - 20°S
Anomalies
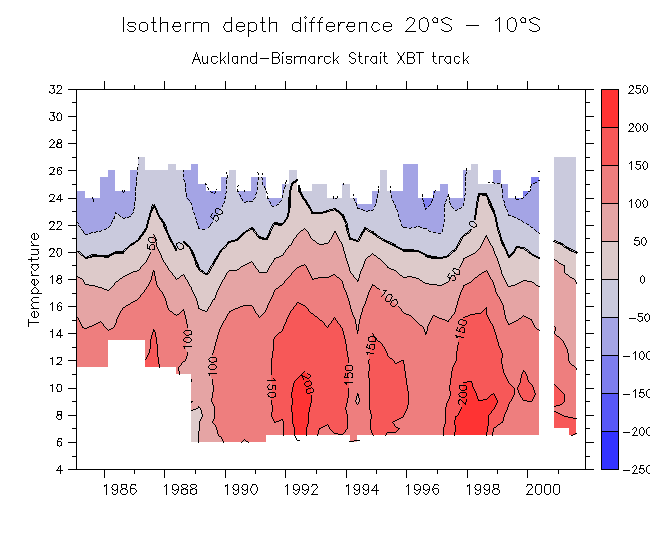
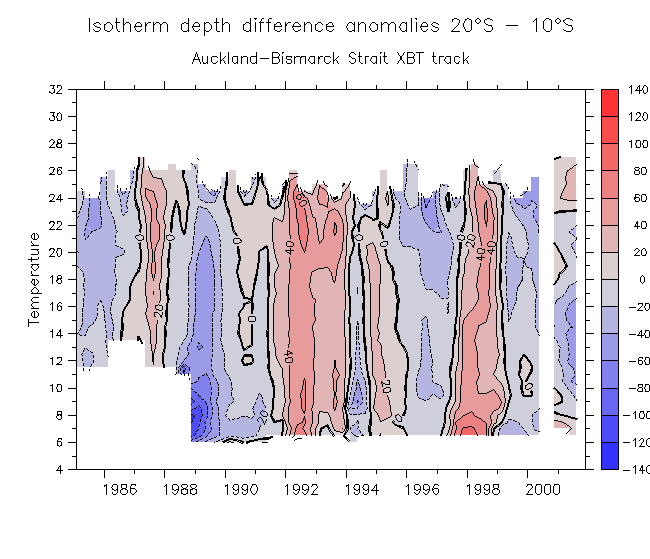
- Isotherm depth difference 10°S - 20°S
Anomalies
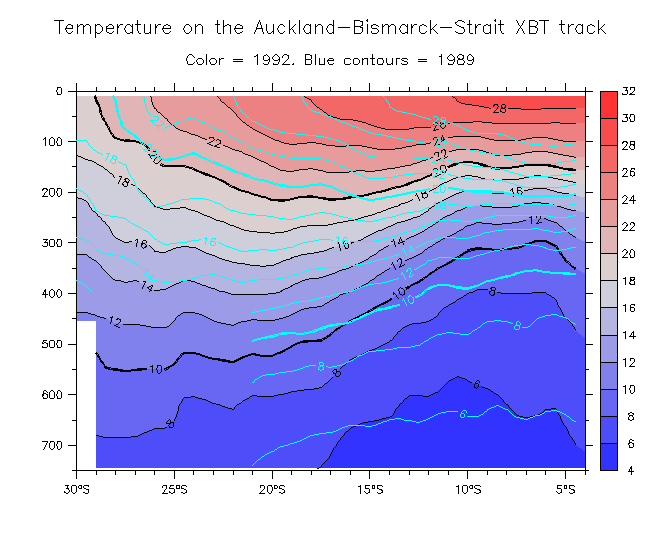
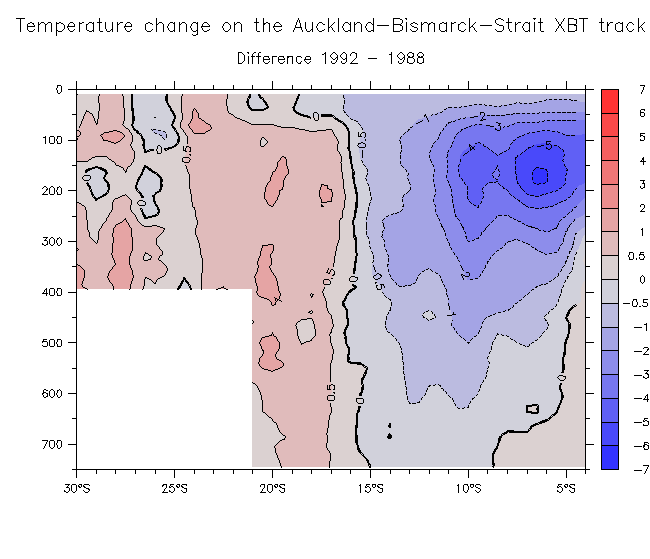
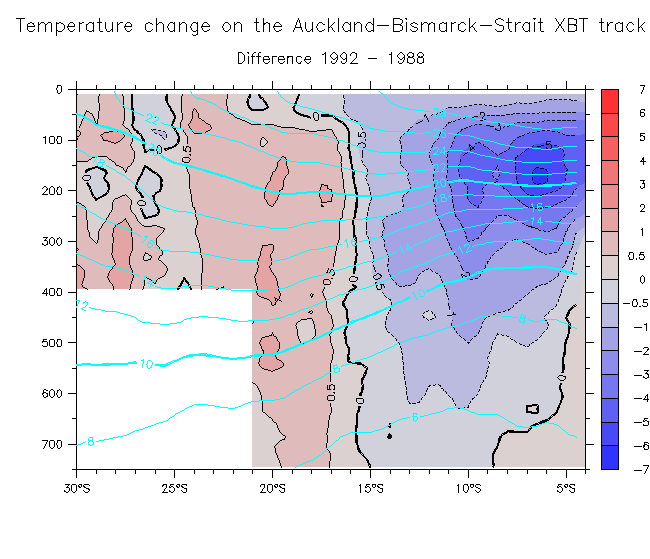
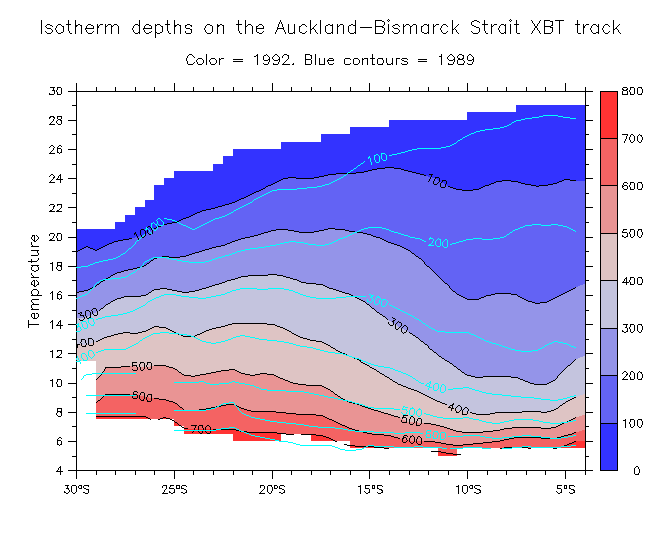
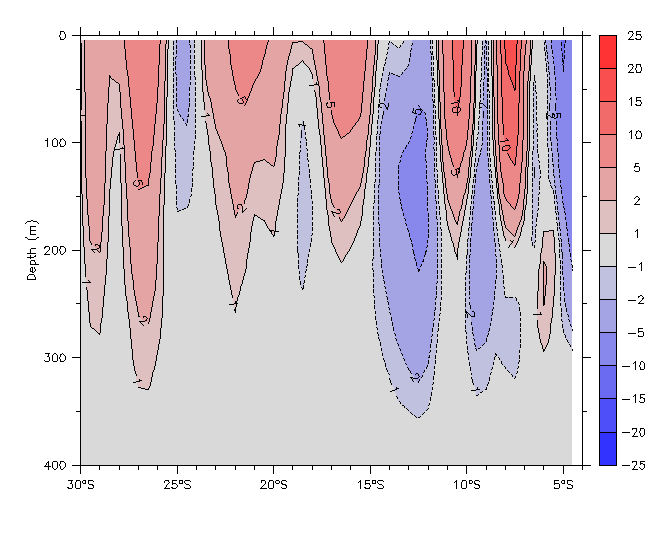
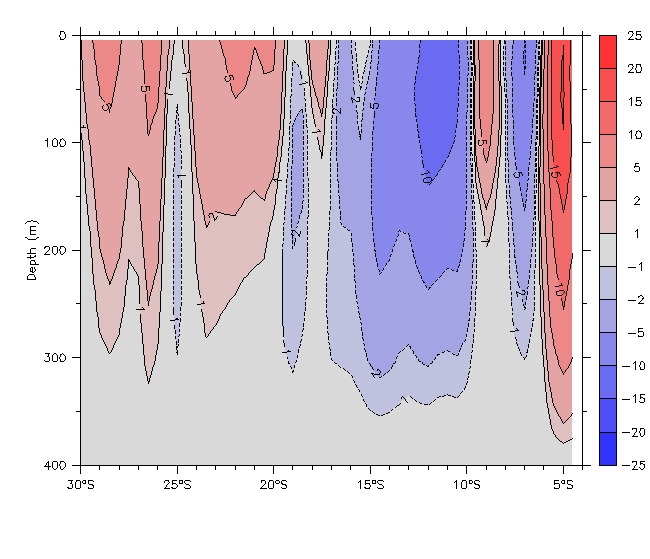
- Compare temperature and isotherm depths along the section during 1992 - 1988
- Temperatures 1992 and 1988
Difference Overlay mean T
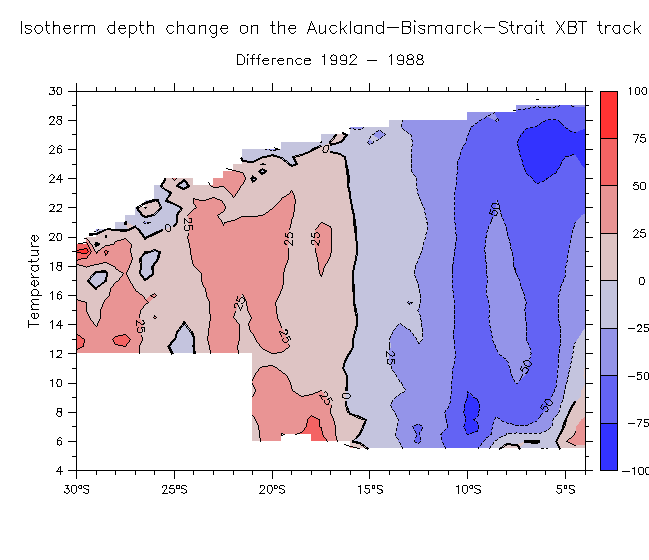
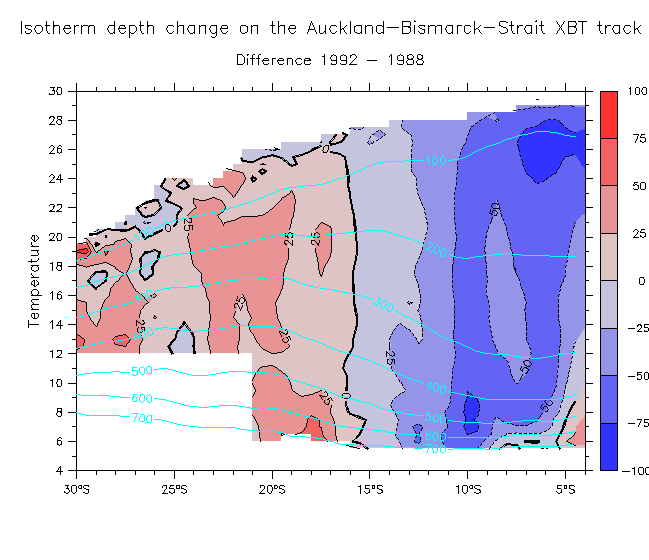
- Isotherm depths 1992 and 1988
Difference Overlay mean depths
- u_g 1989 u_g 1992
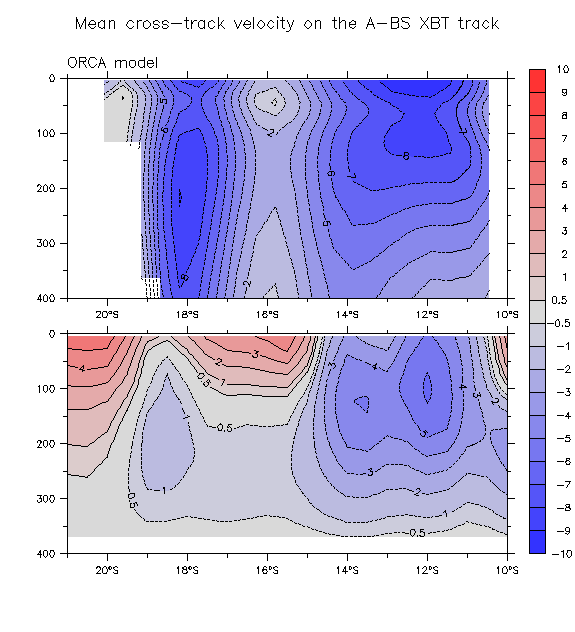
- Compare ORCA model (also see ORCA page)
- Compare mean cross-track u_g
- Compare ORCA/XBT SEC transport time series
- SEC transport and the SOI: ORCA and XBT transport XBT only
- Annual cycle:
- Temperatures (annual and interannual)
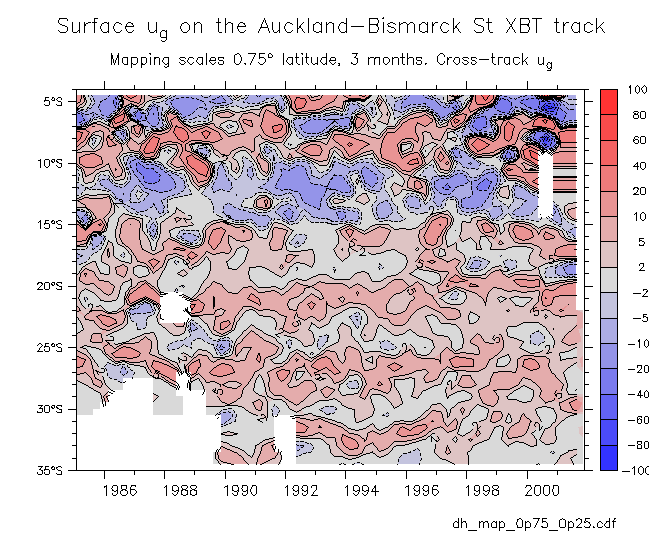
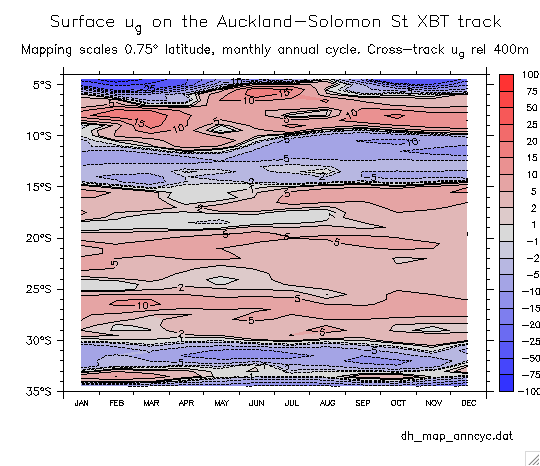
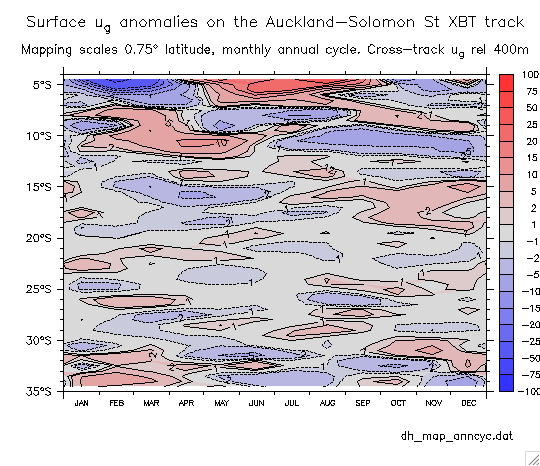
- Crosstrack ug:
- 35°S-4°S: Totals Anomalies
- 10°S-20°S: Totals Anomalies (2 years)
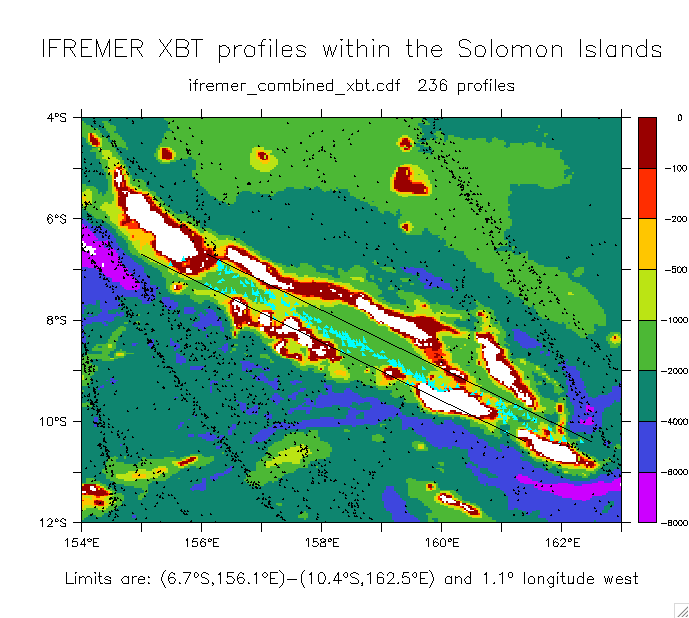
- Solomon Islands work:
- Regional profile locations
- Interior Solomon Island profile locations
This section now ranges widely past just the IFREMER observations, but includes lost of other stuff related to the SECC and Solomons Islands.
(See also the ORCA page, section 9)
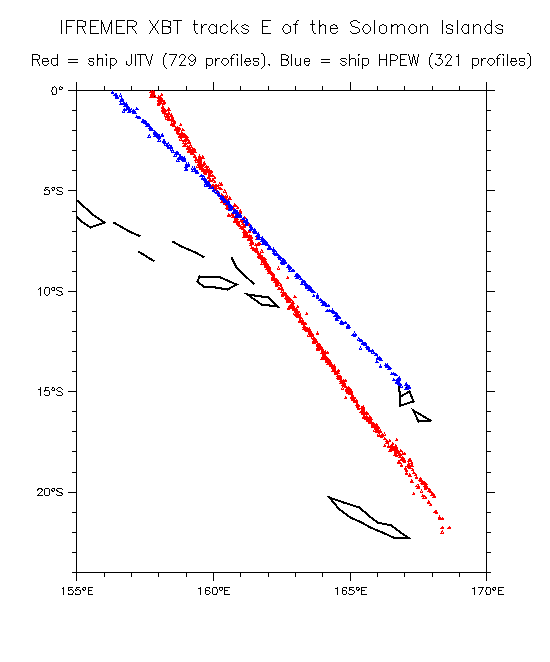
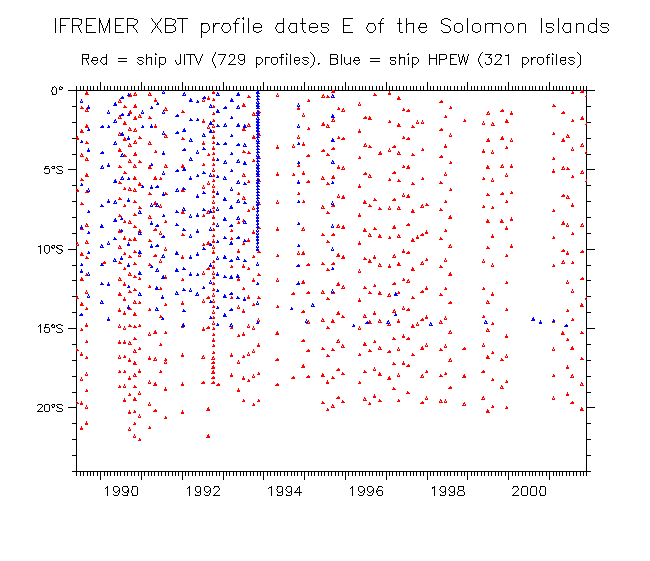
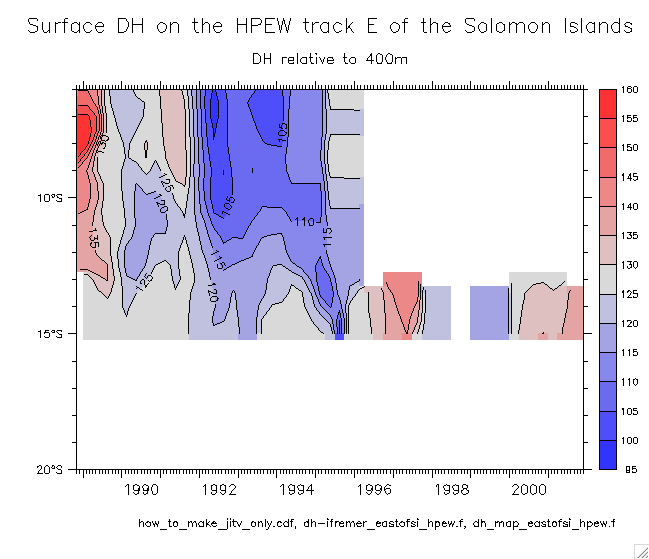
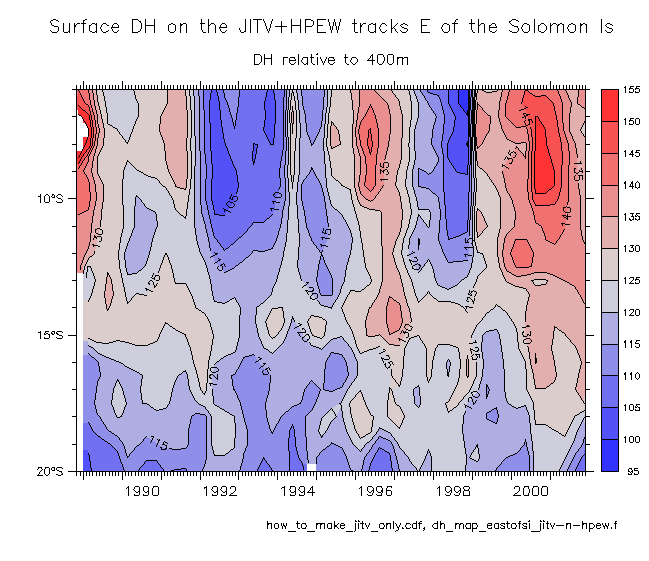
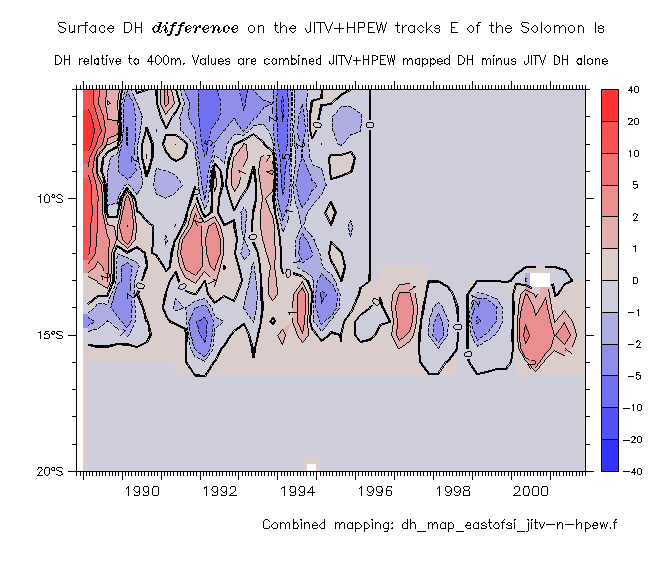
- East of Solomons SECC work:
- Track selection (ships JITV and HPEW)
Dates on track
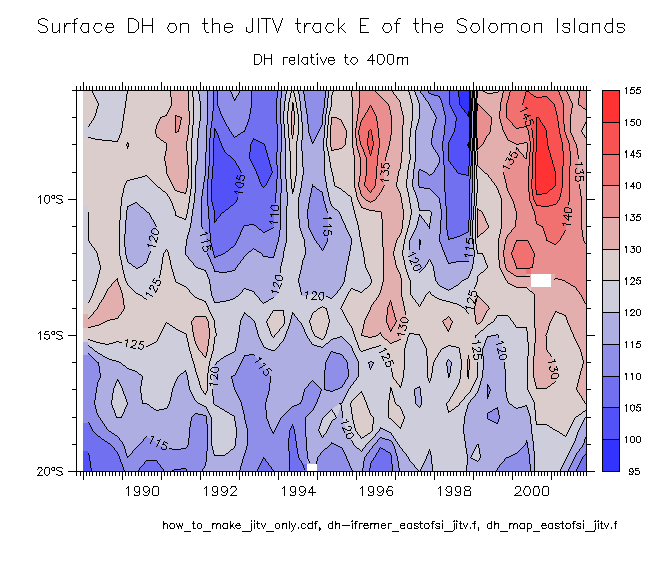
- Mapped DH and ug (JITV and HPEW alone and in combination):
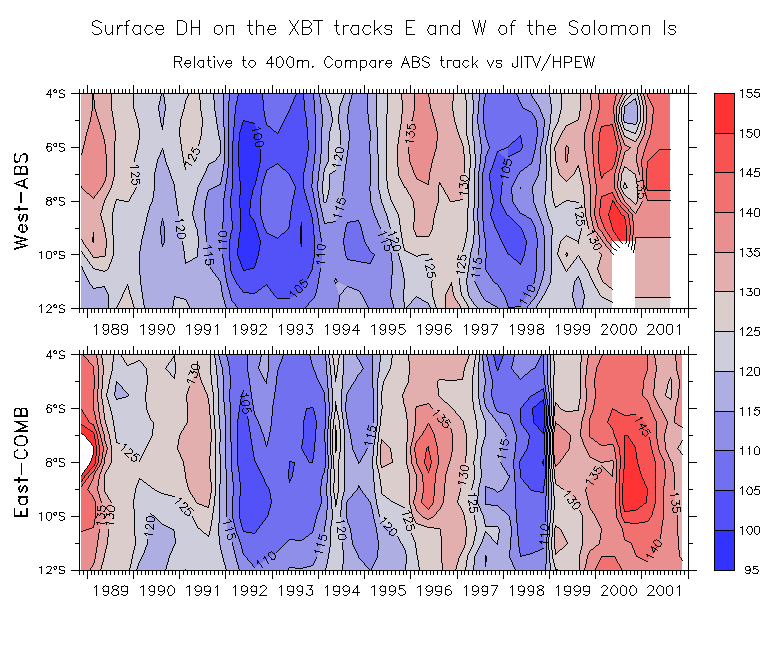
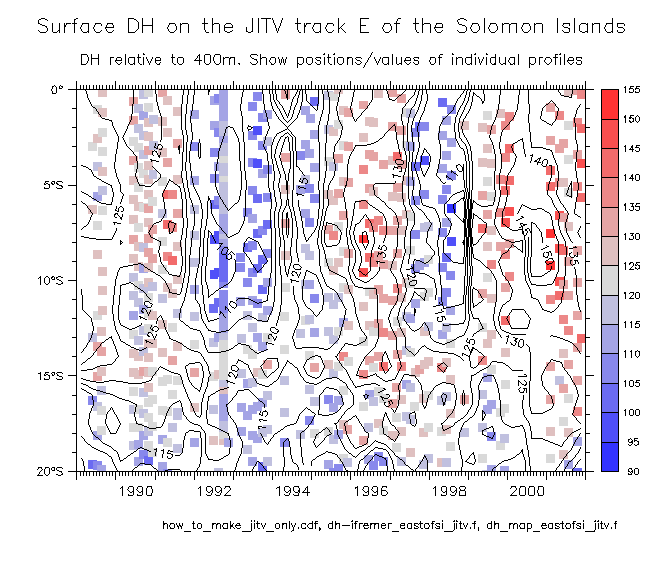
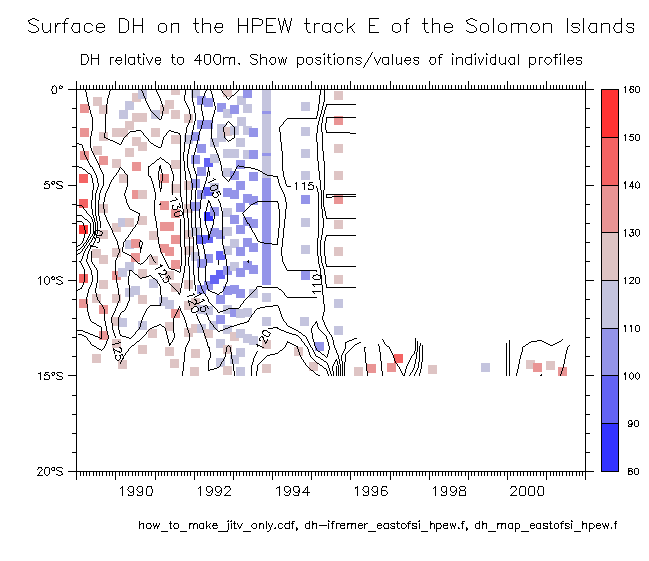
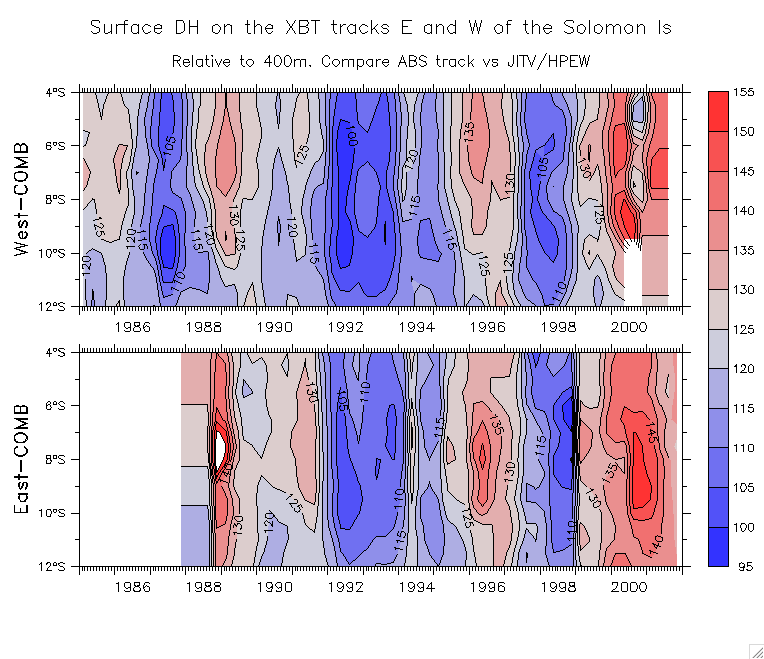
- DH surface: JITV HPEW JITV+HPEW JITV-HPEW difference 12°S-6°S: JITV+COMB COMB+West (ABS)
Checking (show locations of profiles): JITV HPEW
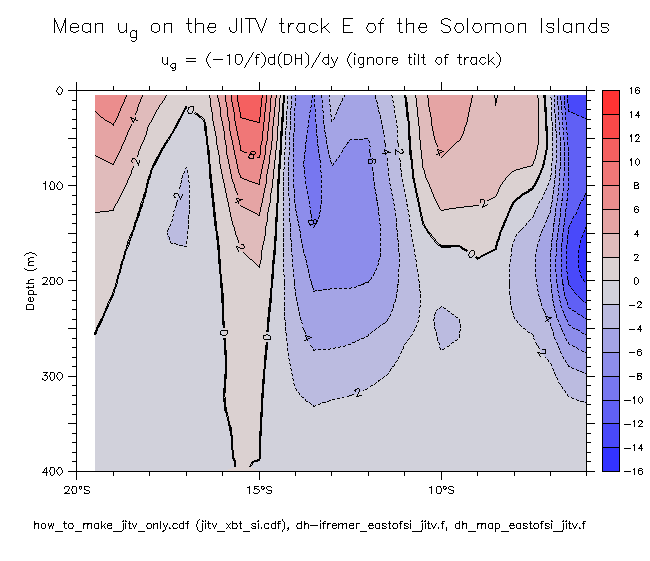
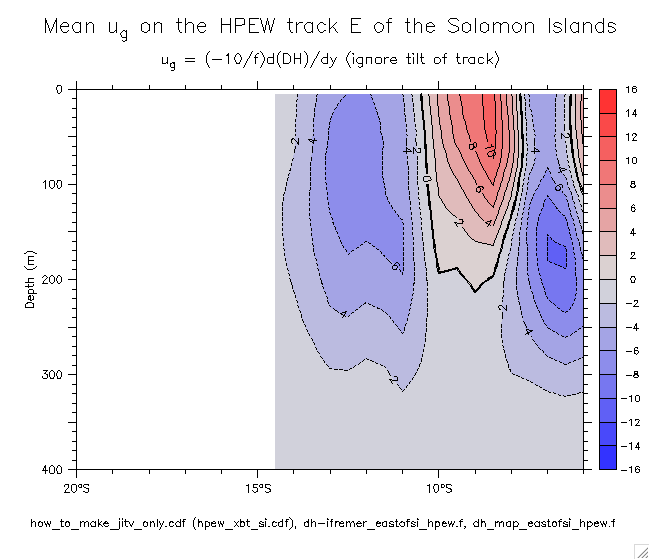
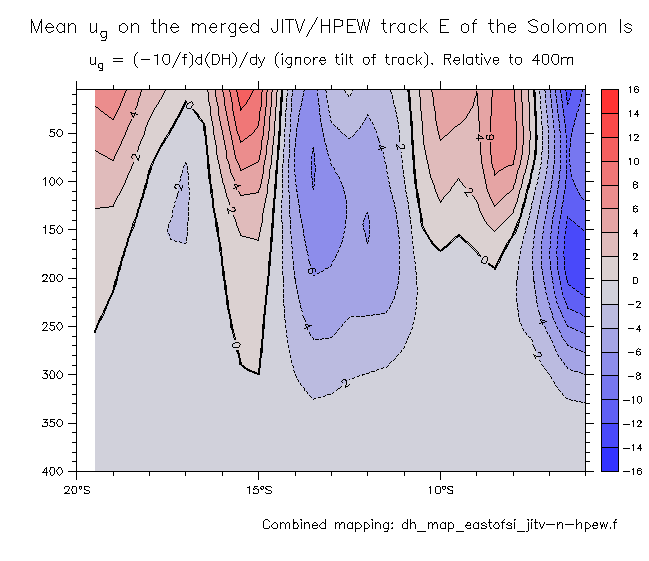
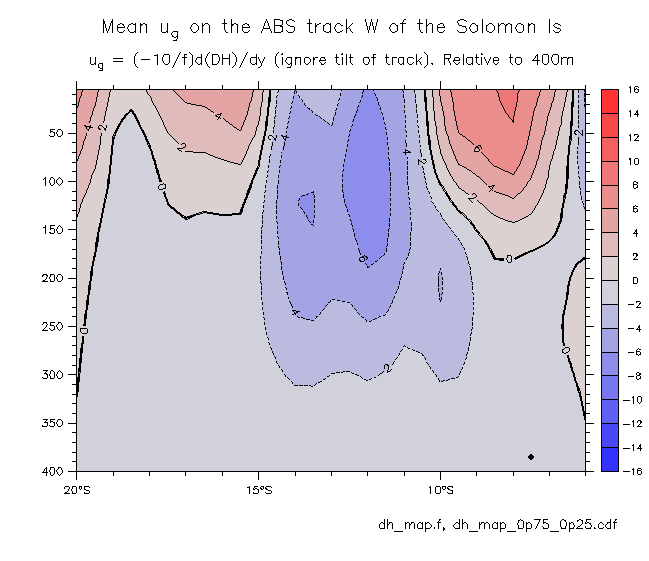
- ug mean: JITV HPEW JITV+HPEW West (ABS)
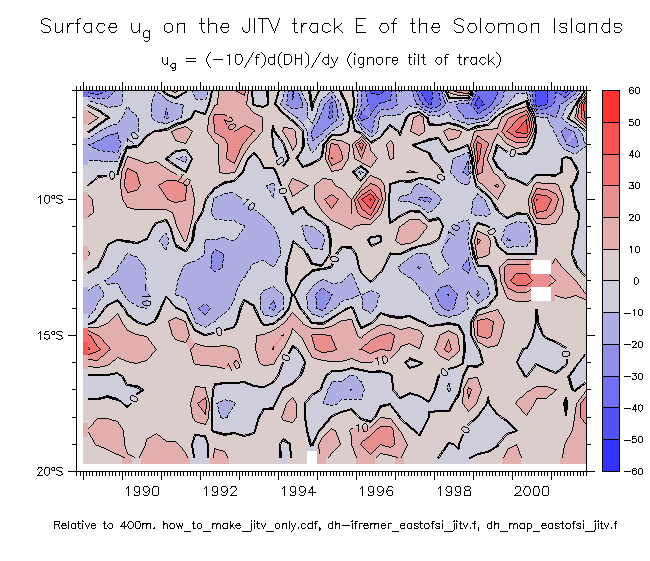
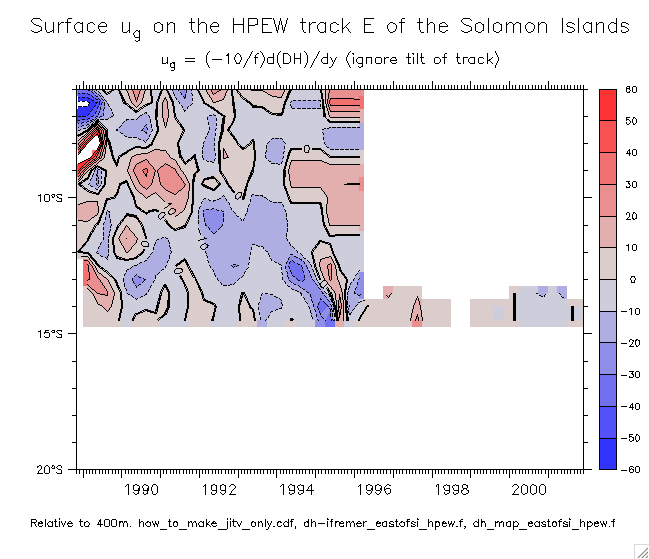
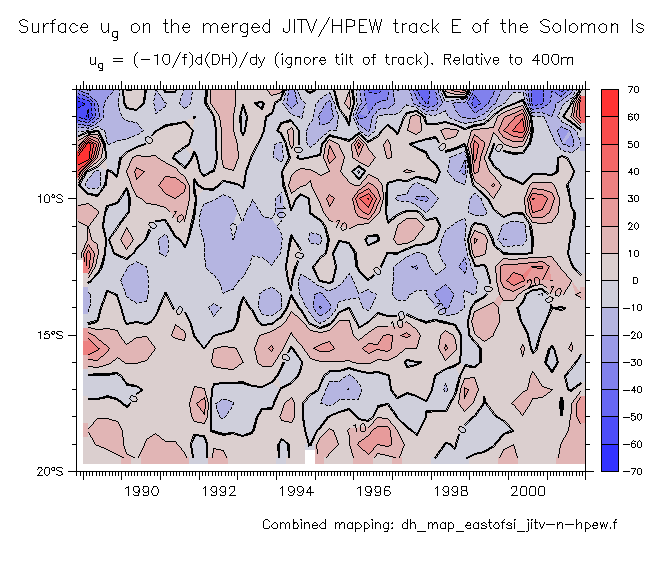
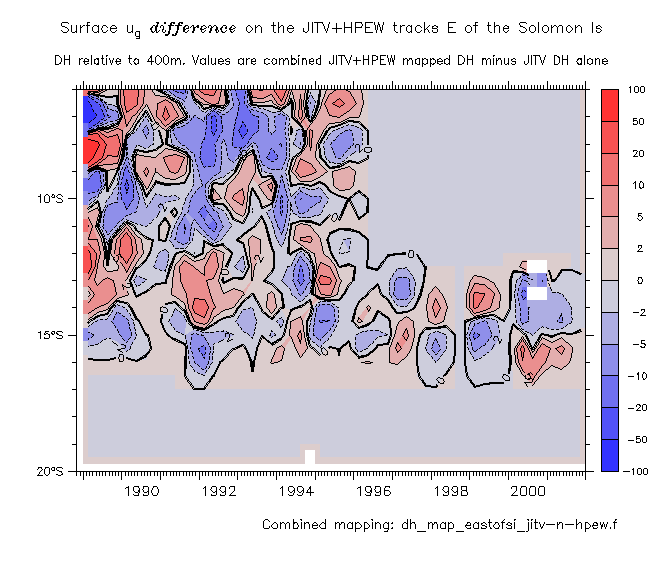
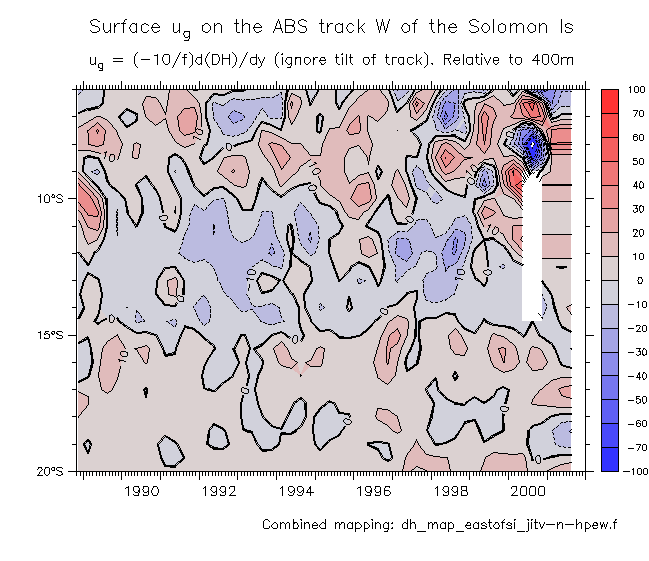
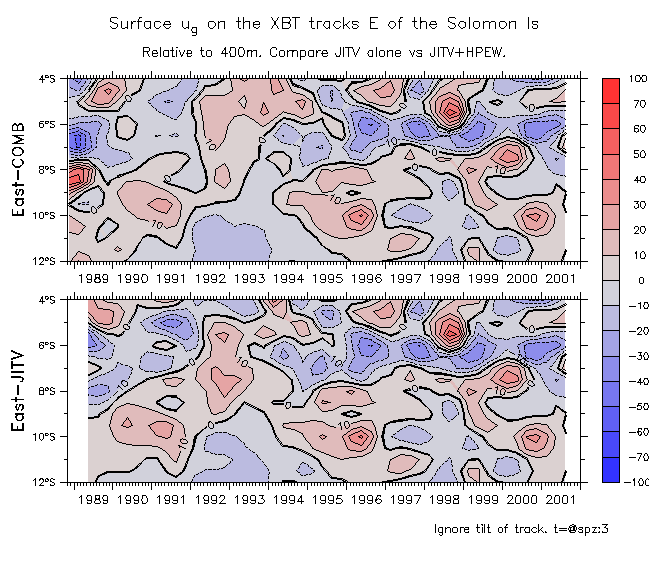
- ug surface: JITV HPEW JITV+HPEW combined JITV-HPEW difference West (ABS) 12°S-6°S: JITV+COMB
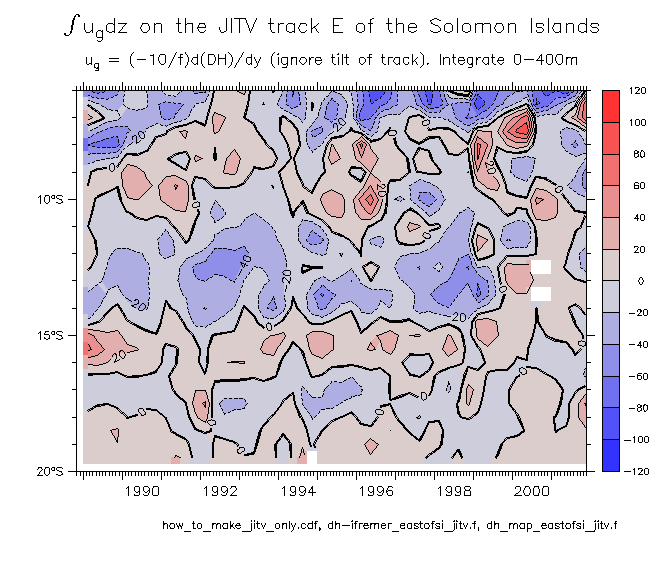
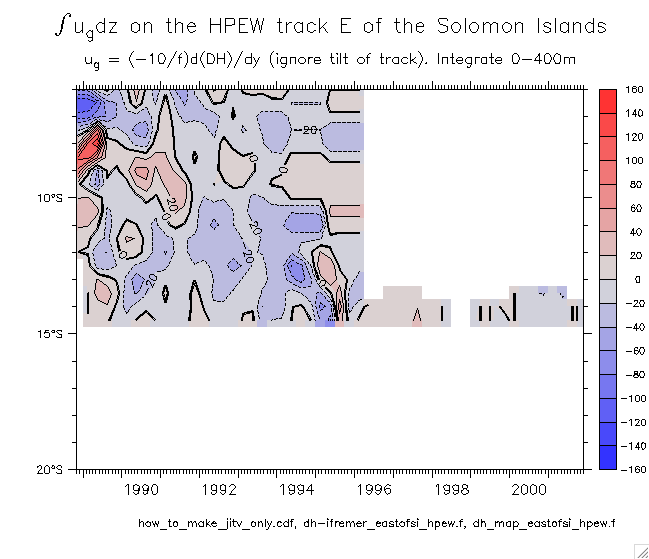
- Int(ug)dz: JITV HPEW
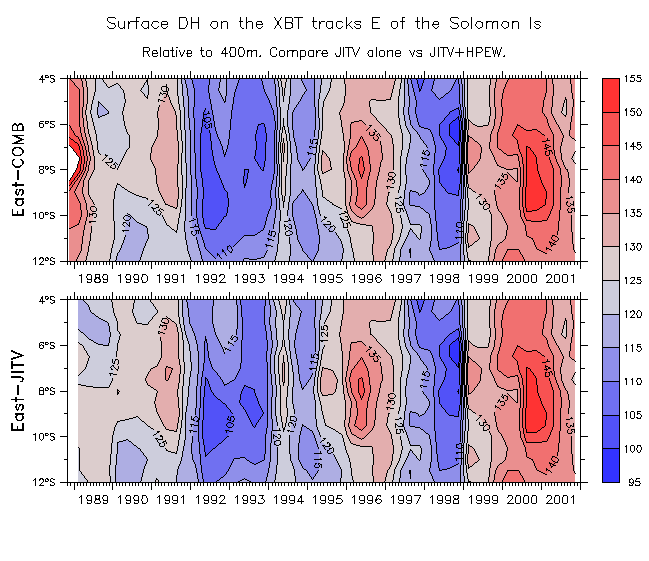
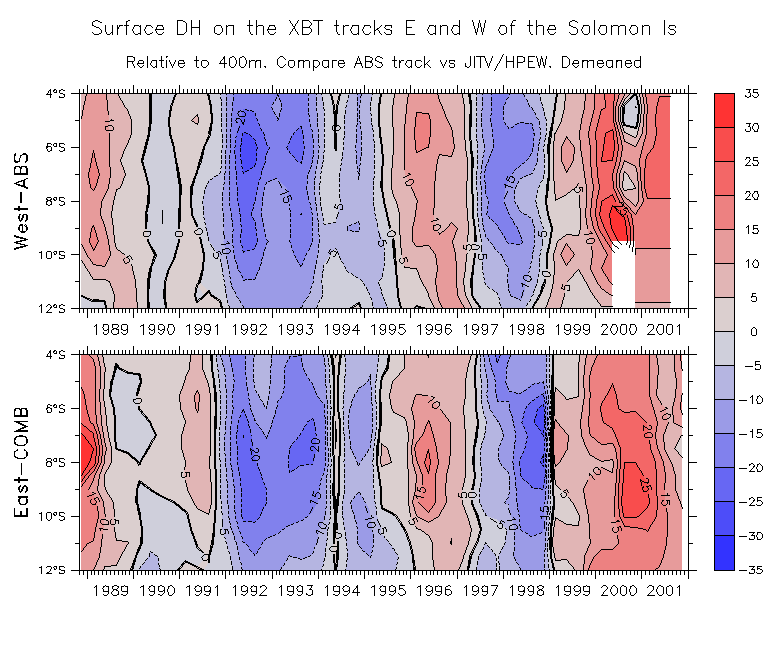
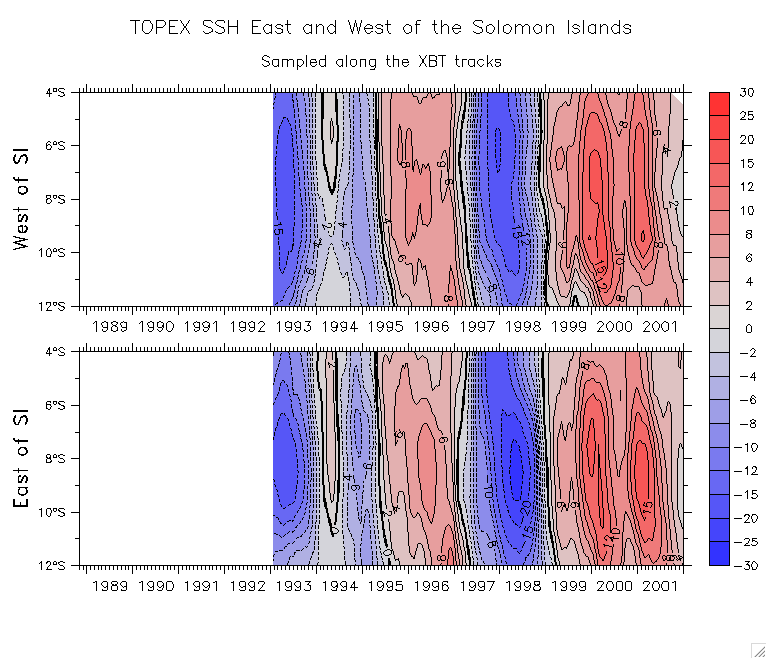
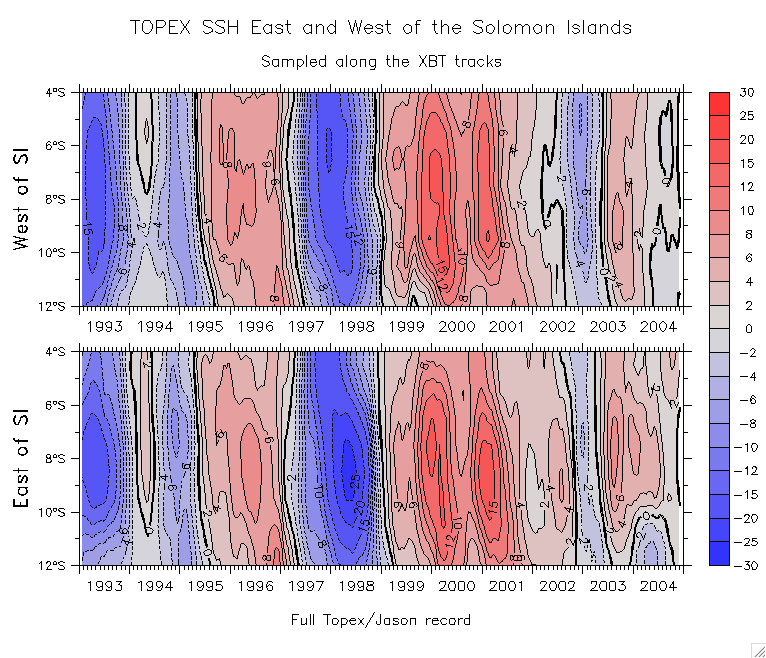
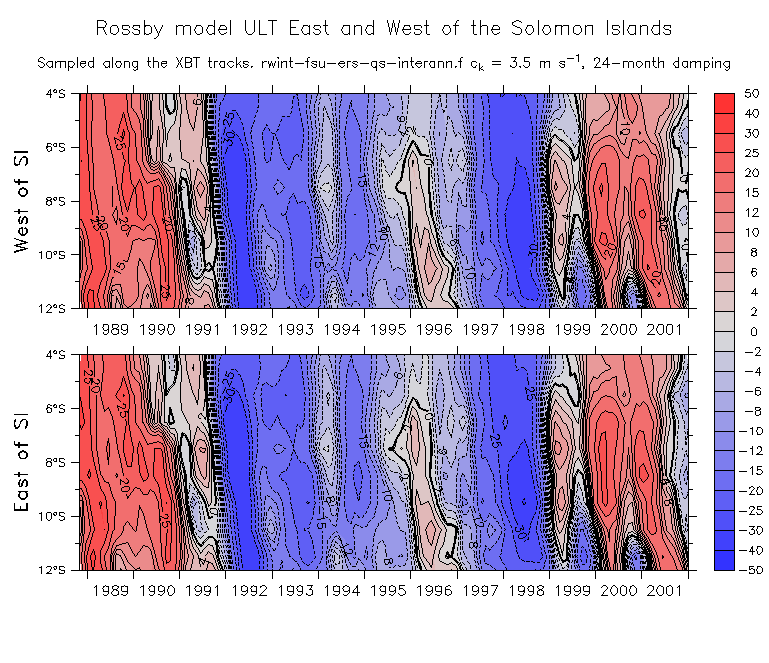
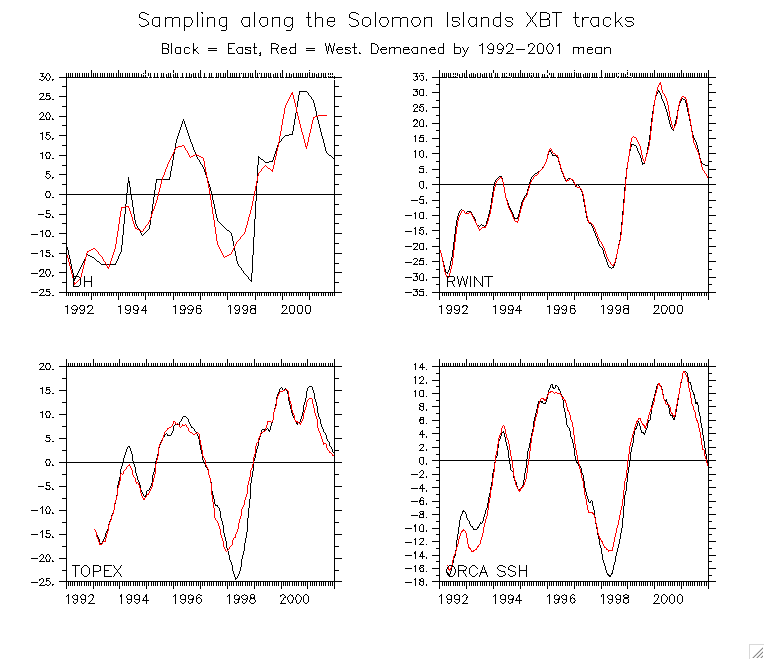
- Sample other fields along the XBT tracks E and W of the Solomons:
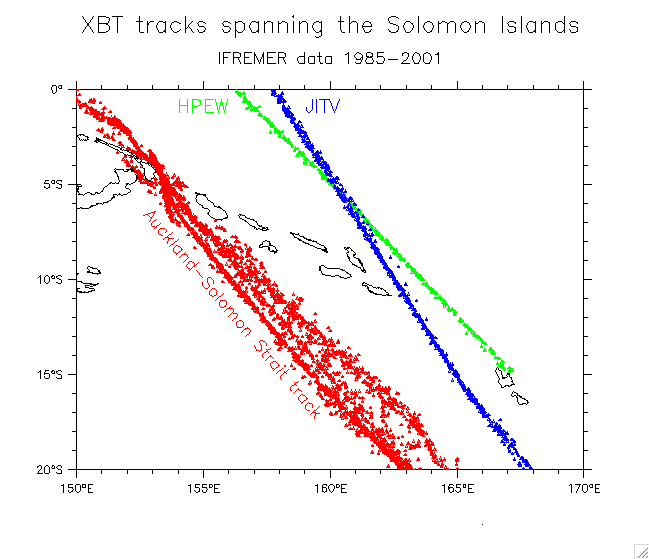
- Map of tracks (both E and W of islands) Solomon Sea bathymetry (detail)
- XBT DH (Demeaned)
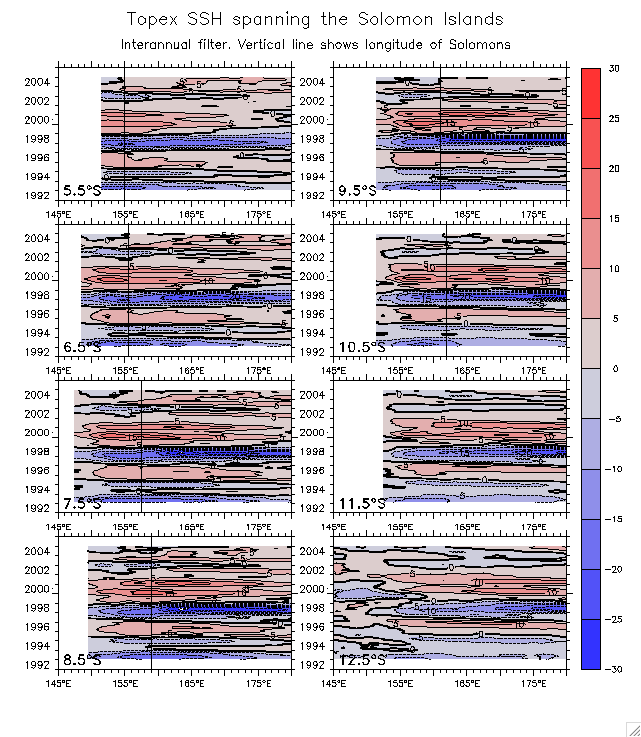
- TOPEX (Full record 1992-2004)
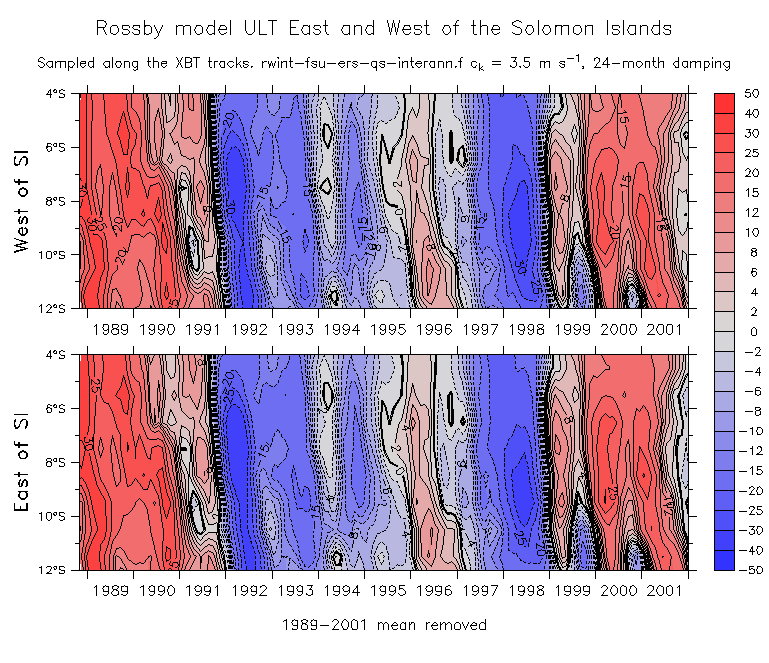
- Rossby model (Demeaned)
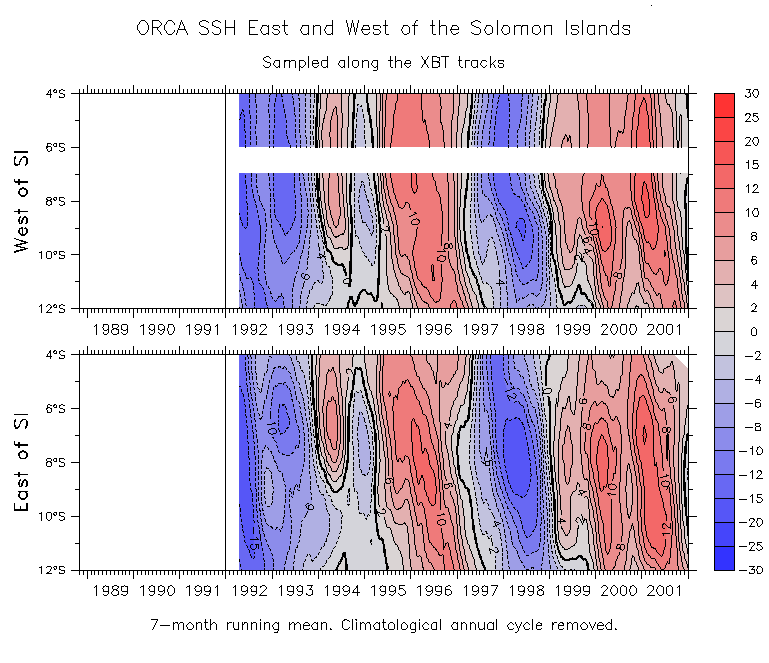
- ORCA
- All the above combined in one page
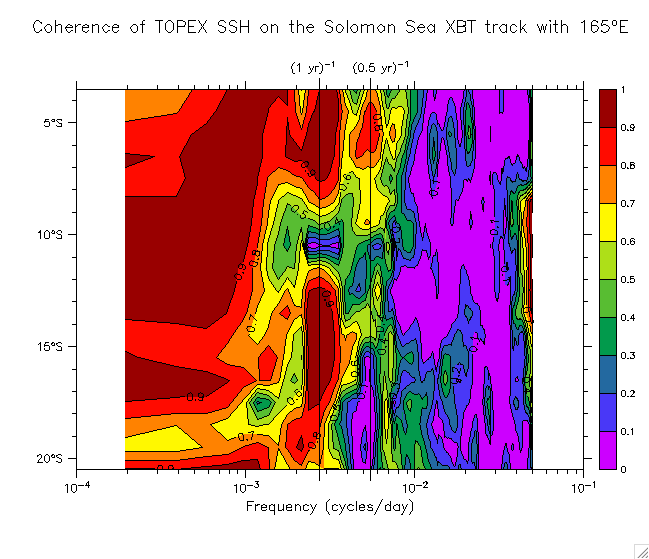
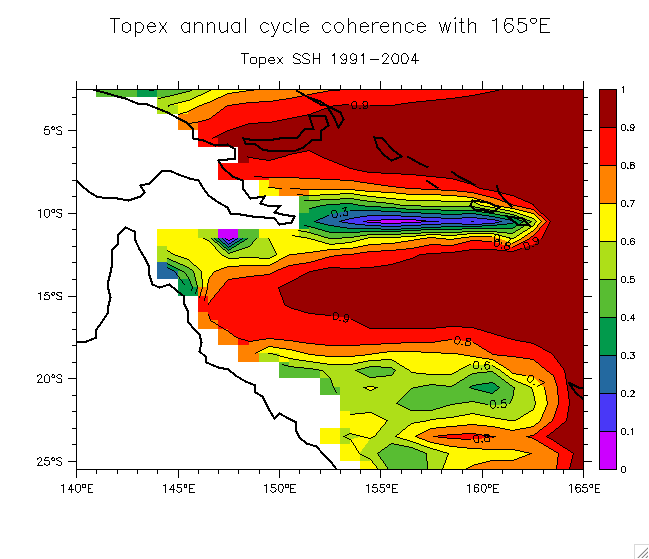
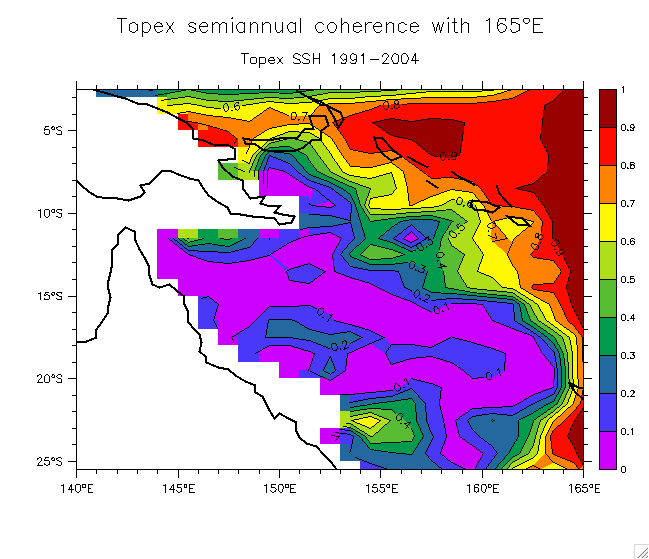
- Coherence of Topex SSH on the ABS track with 165°E
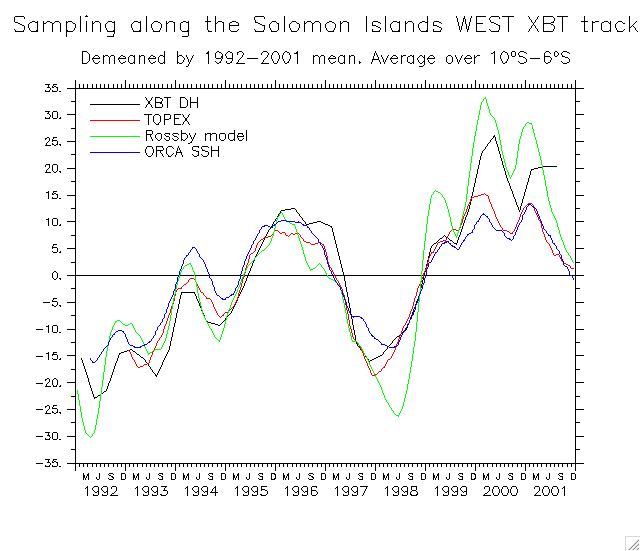
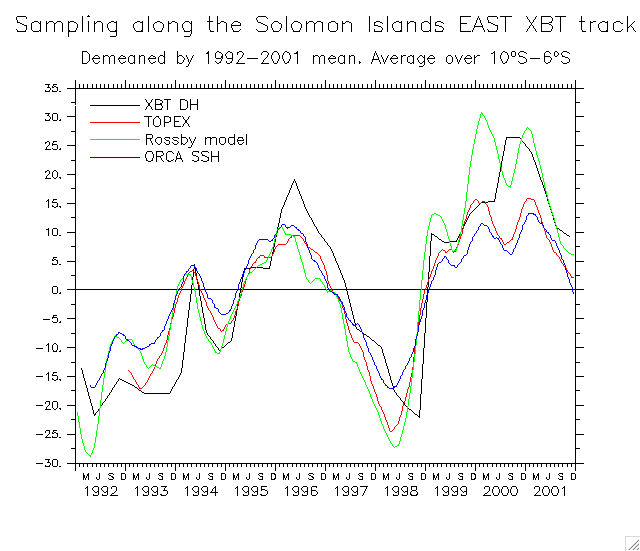
- Interannual time series across the islands (XBT DH, Topex, Rossby model, ORCA):
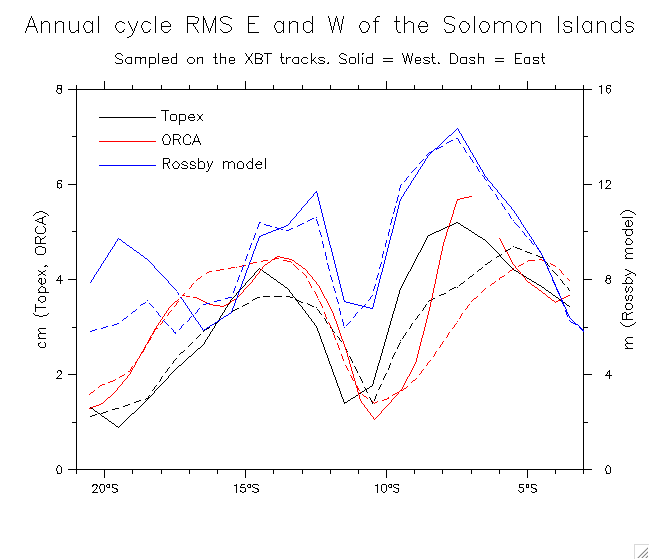
- Annual cycle time series across the islands (Topex, ORCA, Rossby model)
- Annual cycle RMS
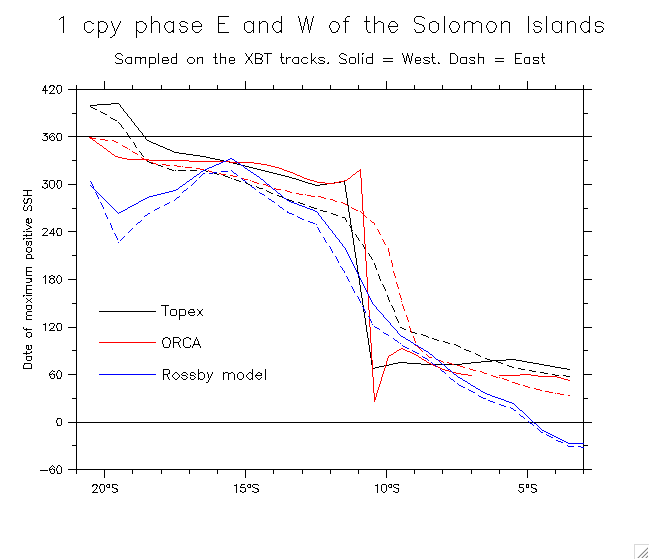
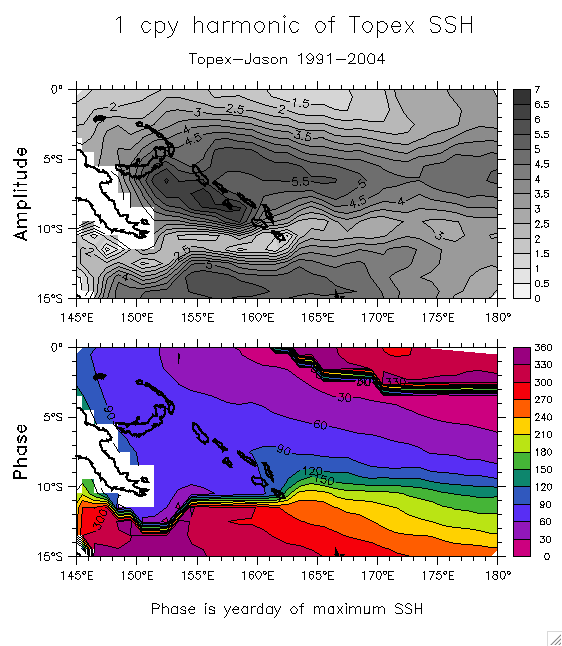
- 1 cpy phase
- Topex coherence vs 165°E on the ABS track
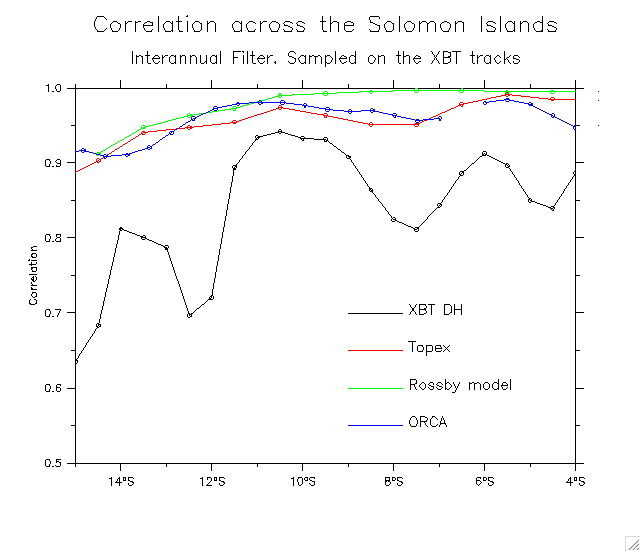
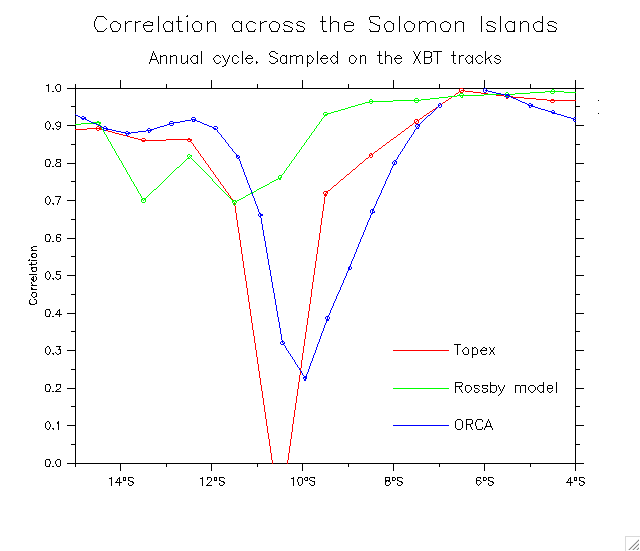
- Correlations across the islands (fn of y): Interannual Annual cycle
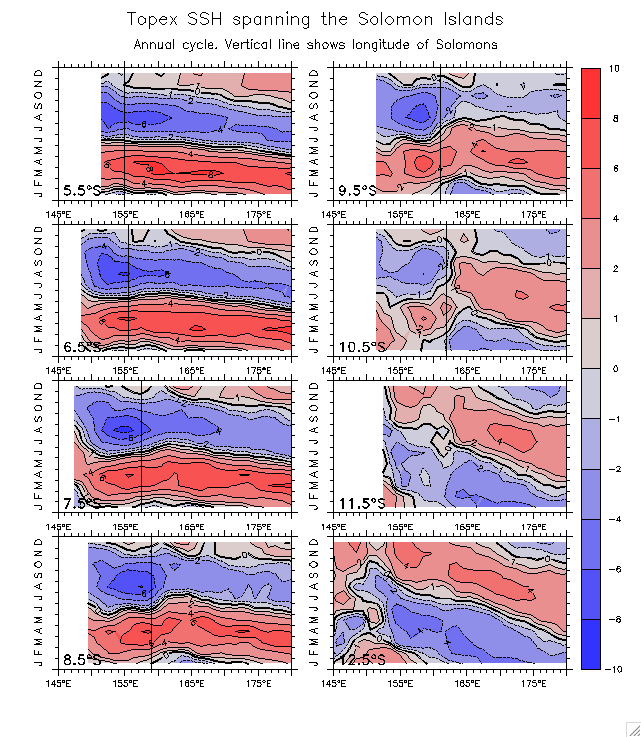
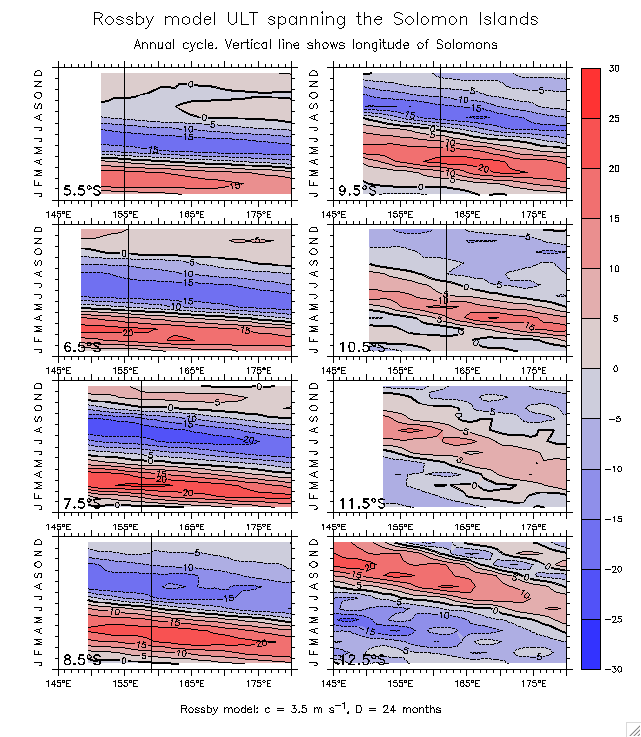
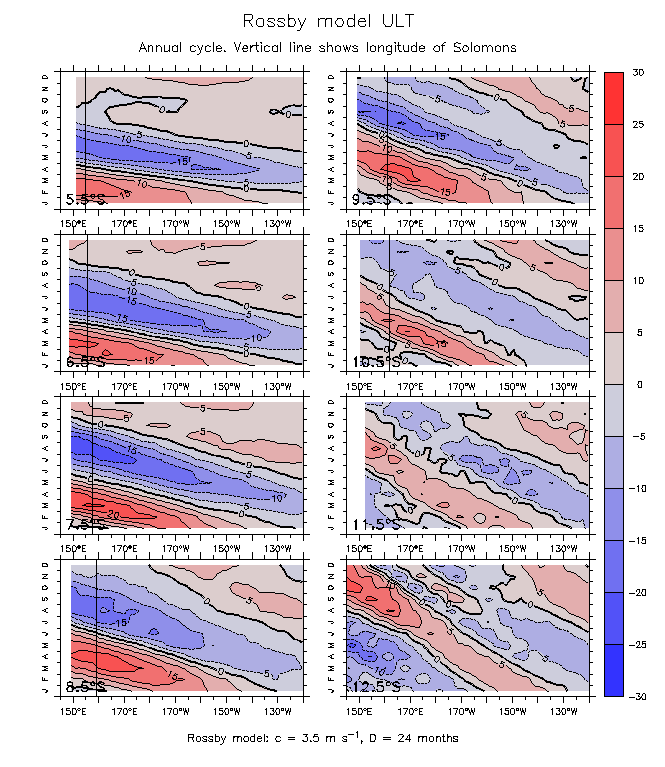
- Quantities spanning the Solomon Islands: (See also the ORCA page, section 8g)
- Topex: Interannual Annual cycle
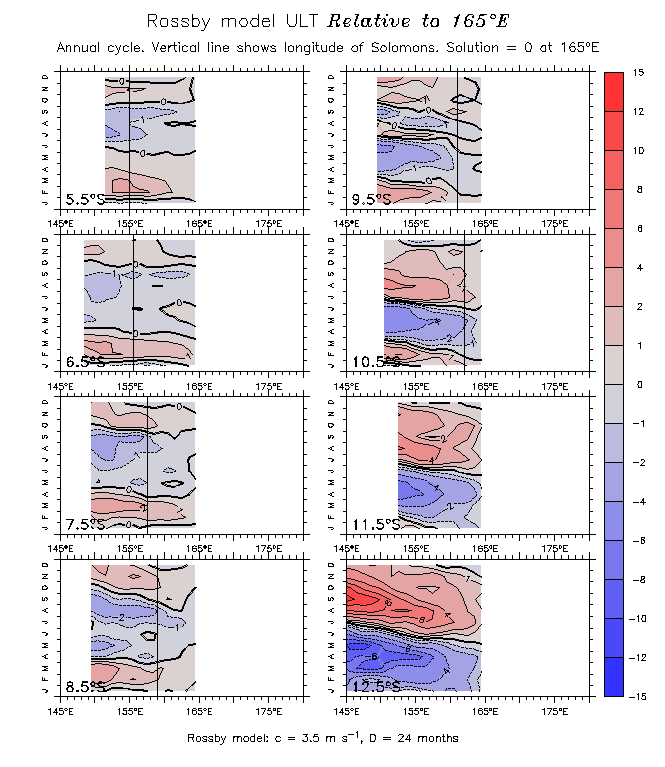
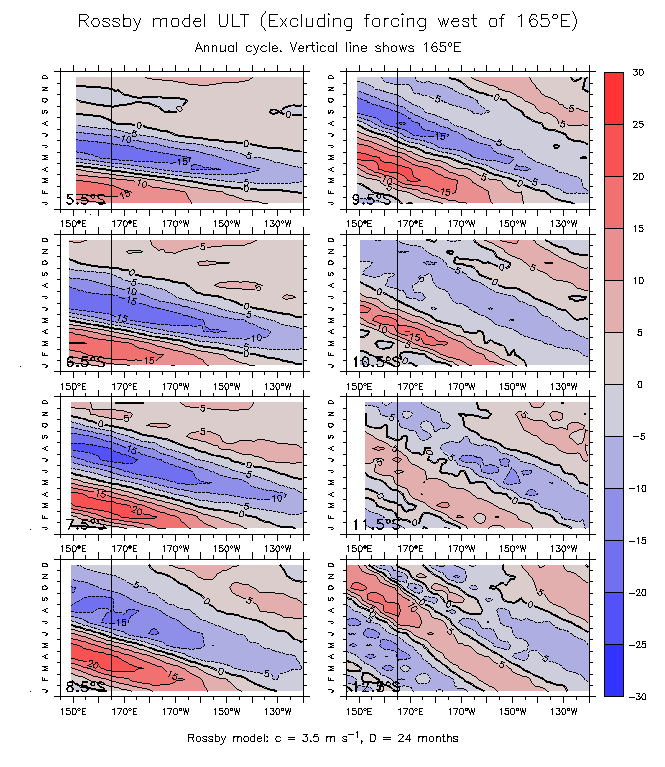
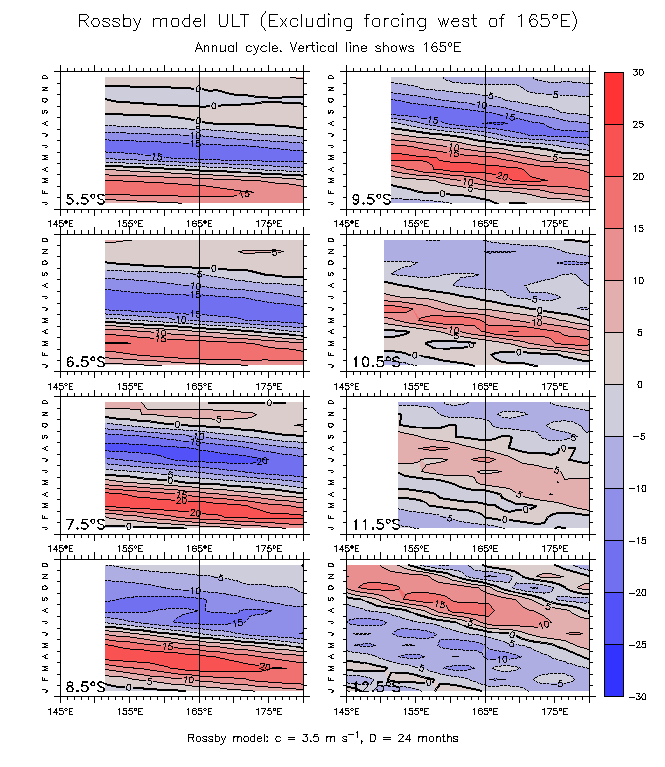
- Rossby model (annual cycle): SI region Extend to 120°W
Relative to 165°E Eastern forcing only (to 120°W) (W of 180°)
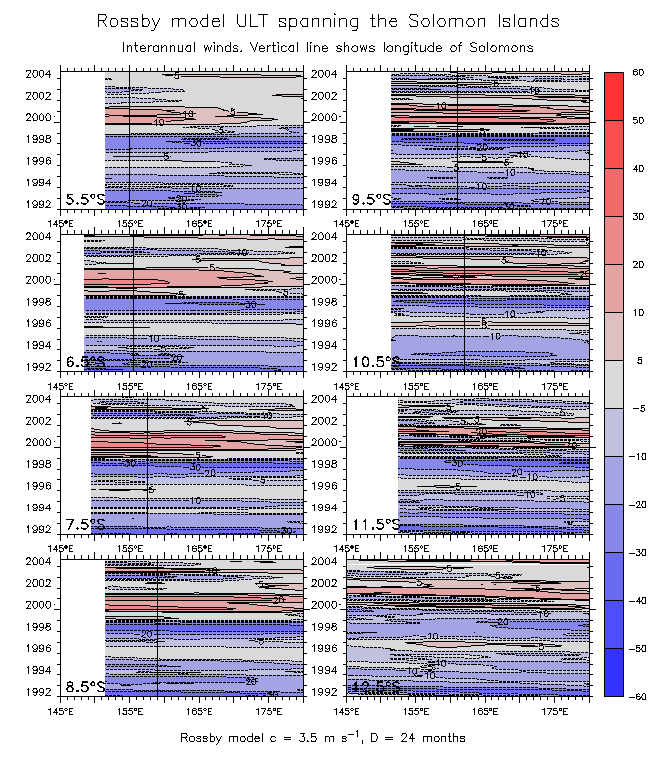
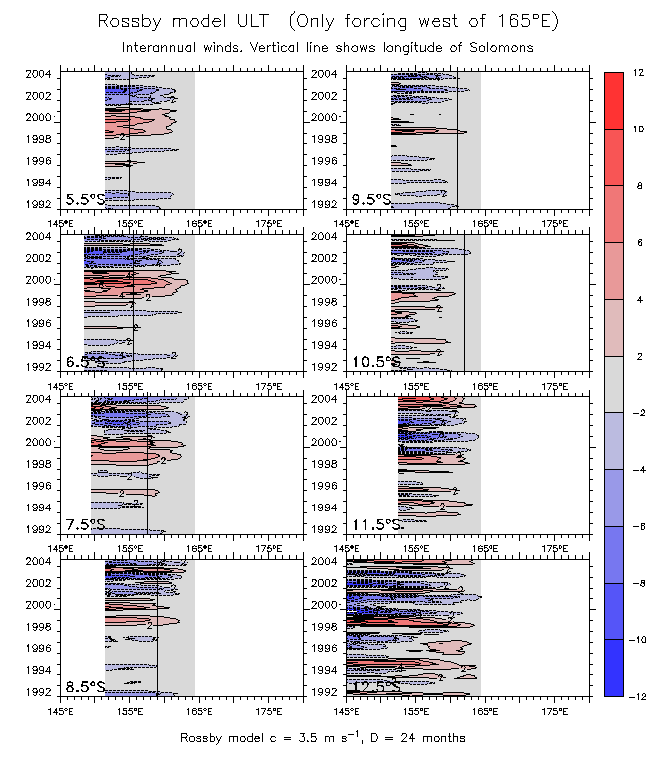
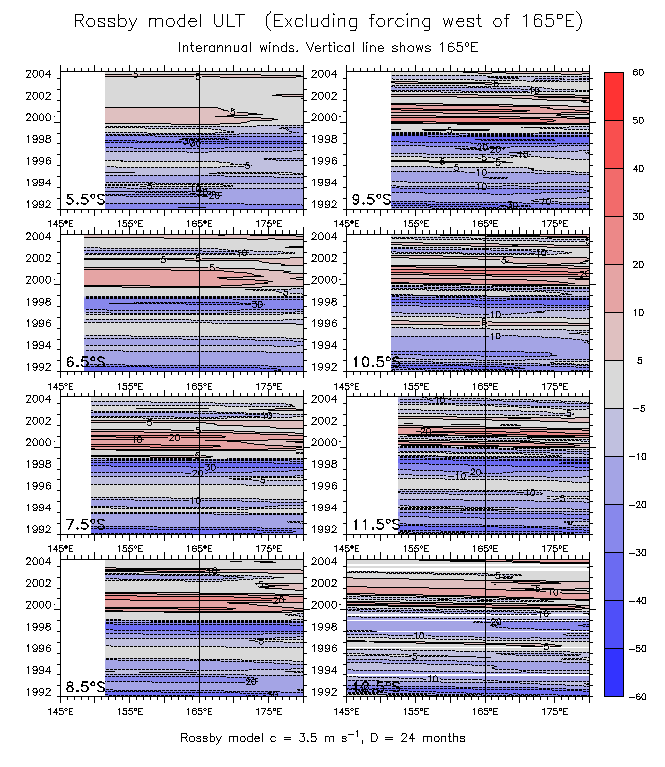
- Rossby model (interannual): SI region
Relative to 165°E Eastern forcing only
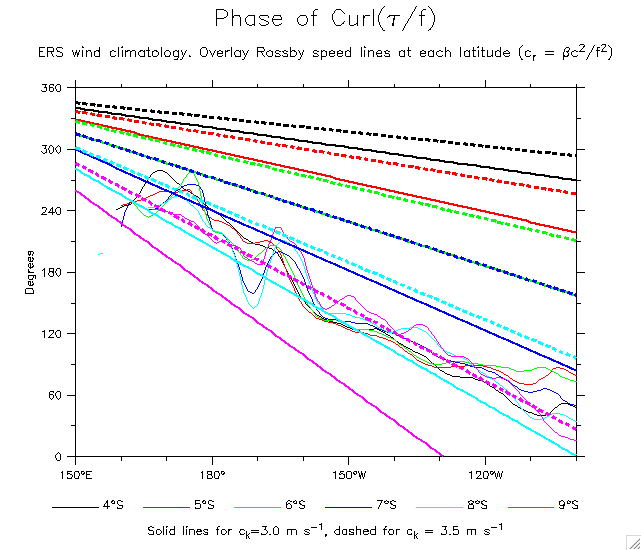
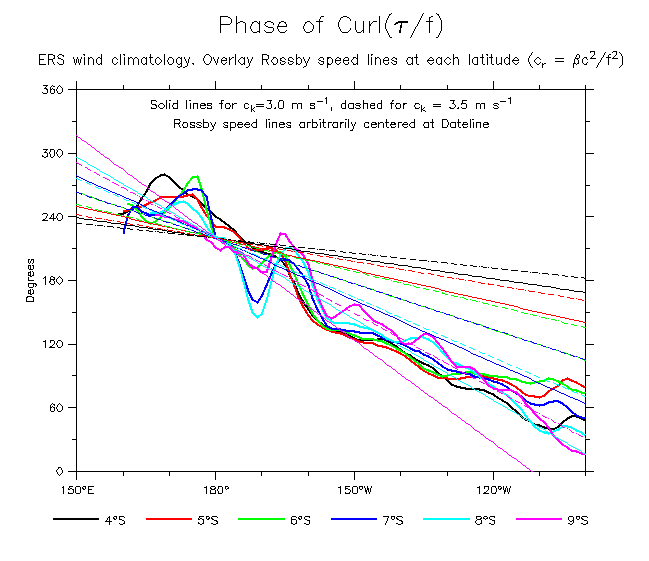
Phase variation of Curl(Tau/f) vs Rossby waves speed Center RW speed on dateline
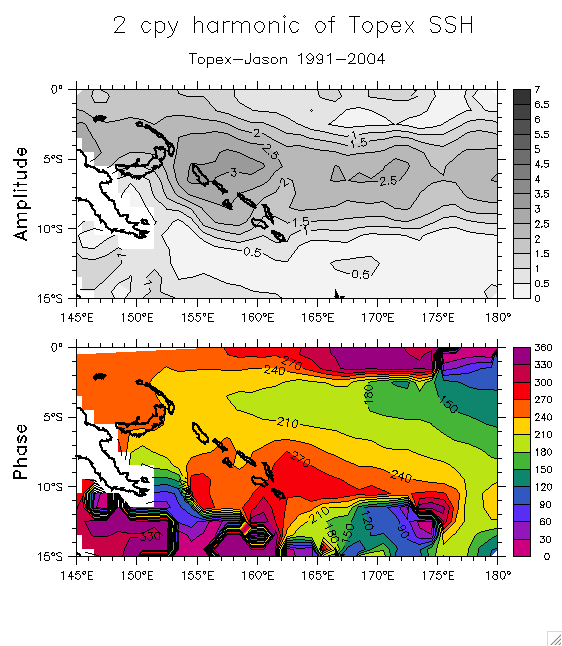
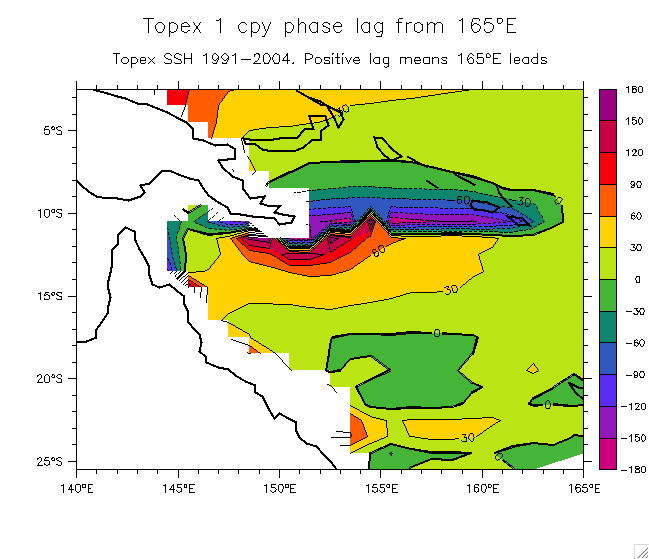
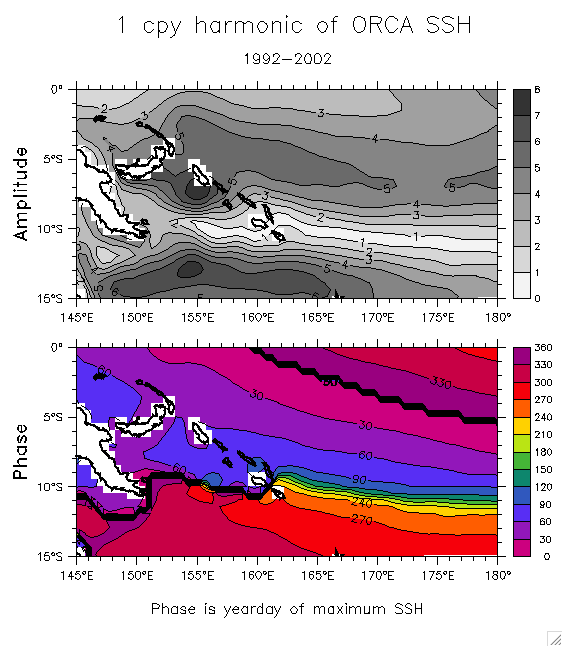
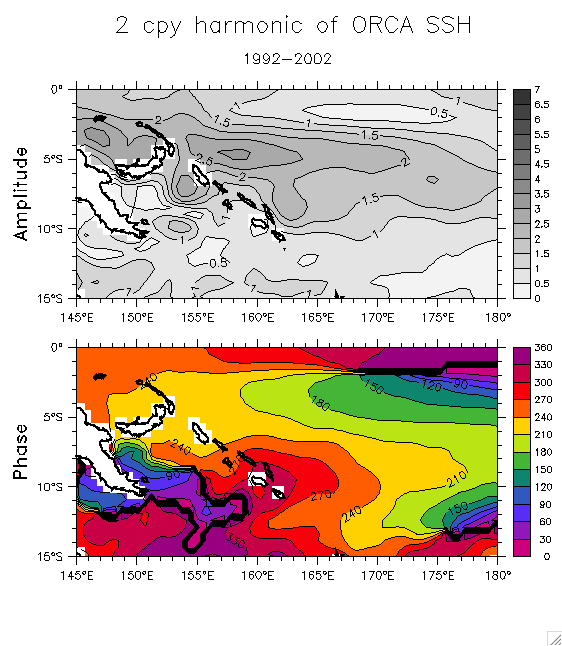
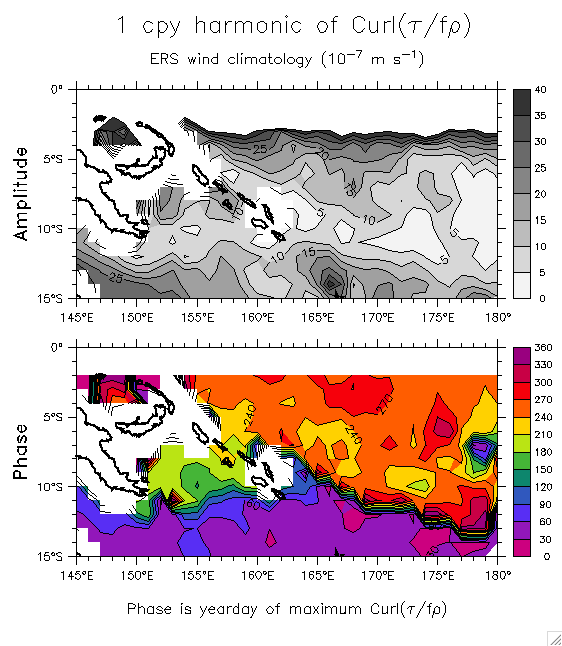
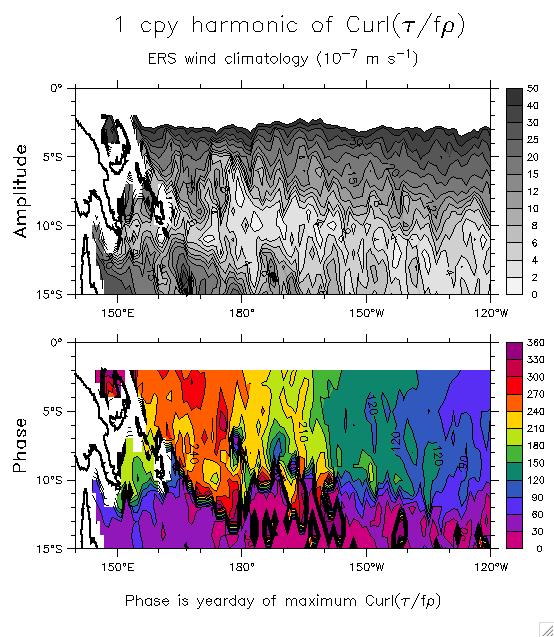
- Harmonics:
- Topex: 1 cpy 2 cpy 1 cpy phase lag from 165°E
- ORCA: 1 cpy 2 cpy
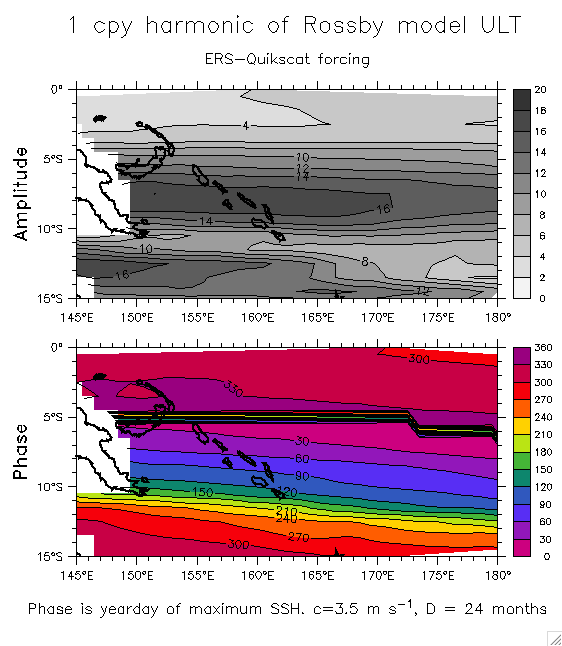
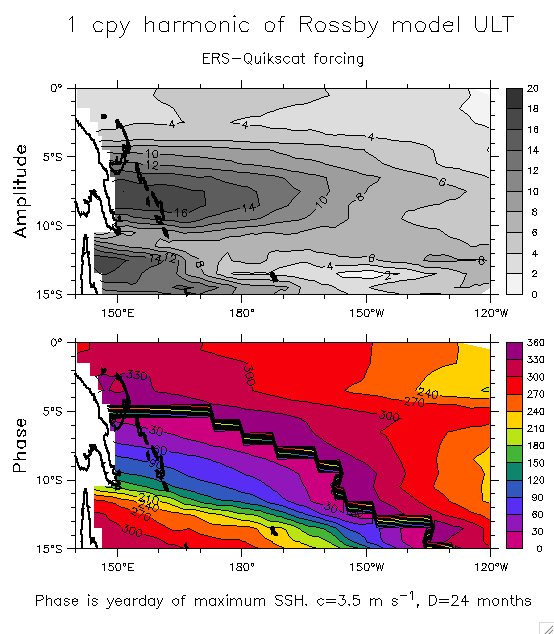
- Rossby model: 1 cpy Extend to 120°W
- Wind and Rossby model forcing:
- Lat-by-lat Topex spectral analysis:
SSH spectra
Coherence vs SSH at 165°E: Amplitude Phase
Coherence at annual and semiannual frequencies: Annual Semiannual
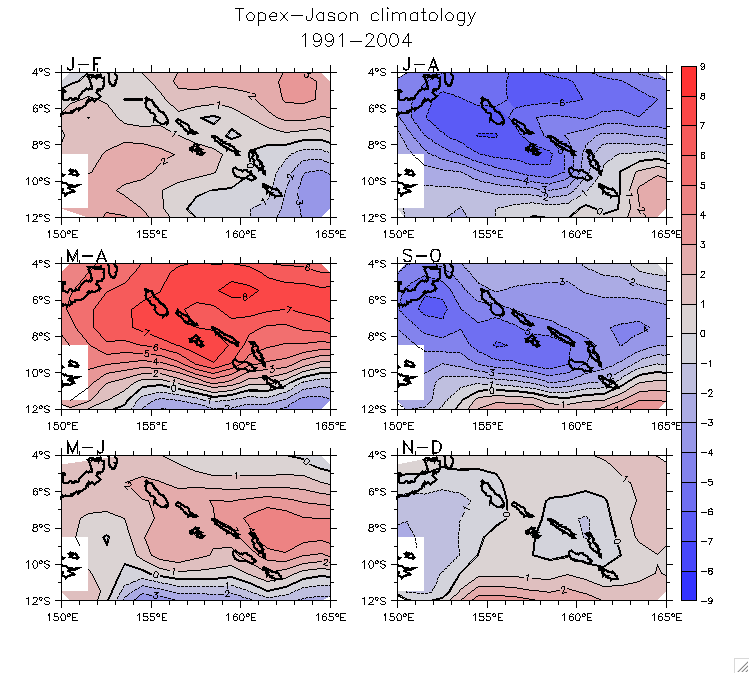
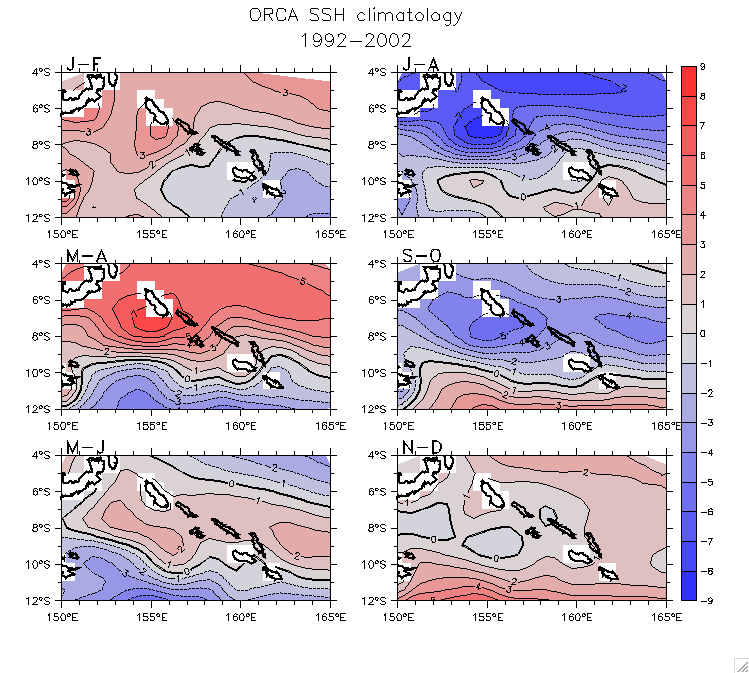
- Seasonal SSH maps near the Solomons: Topex ORCA
- Consider local forcing (climatologies in the Solomon Sea region):
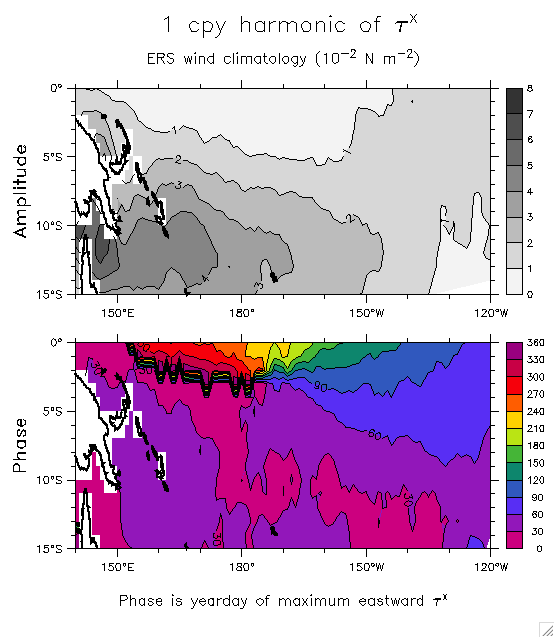
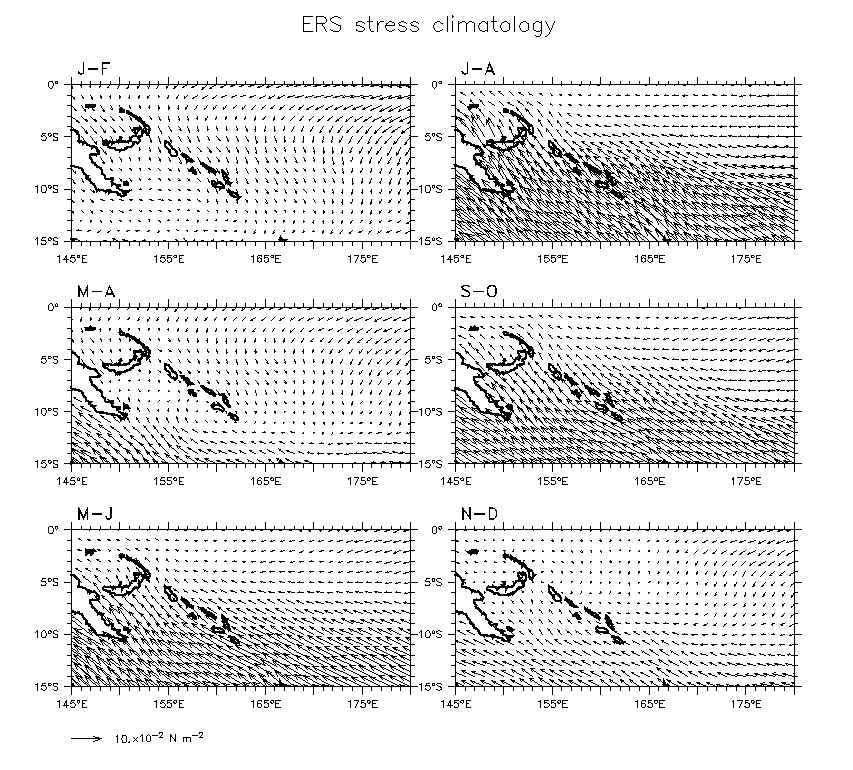
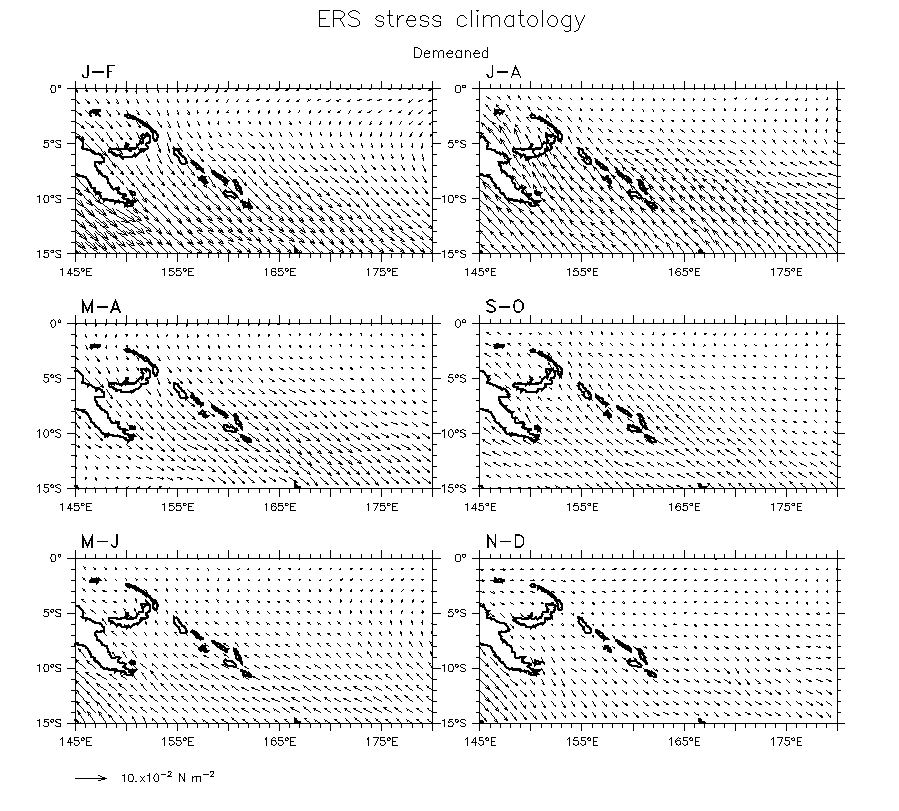
- ERS vector winds (Demeaned)
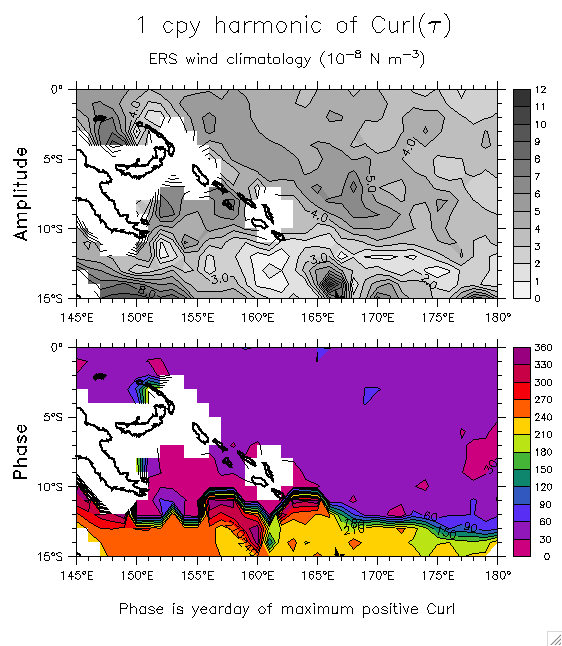
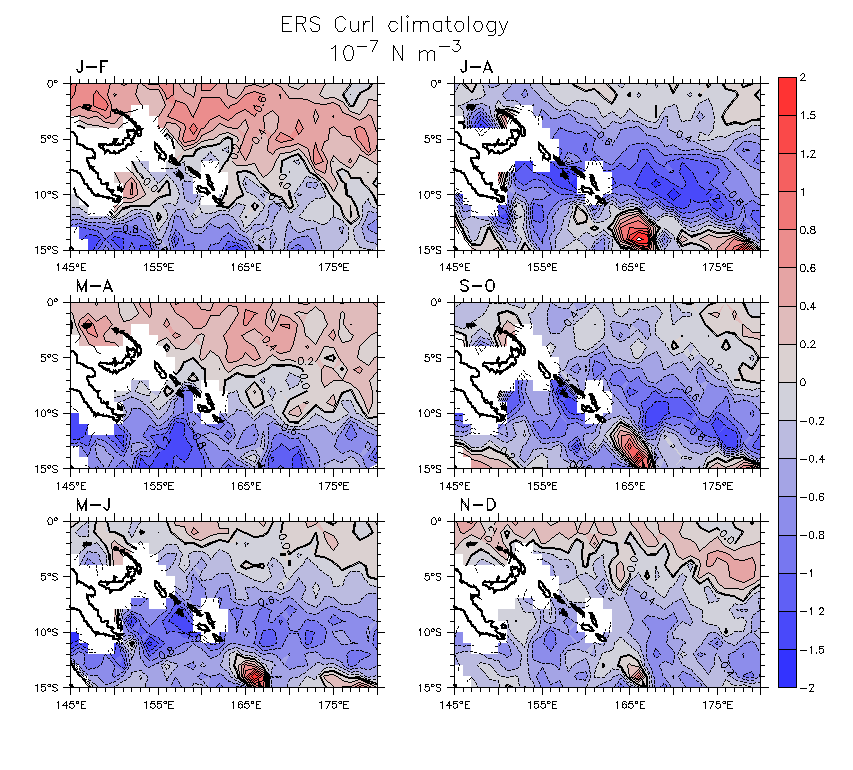
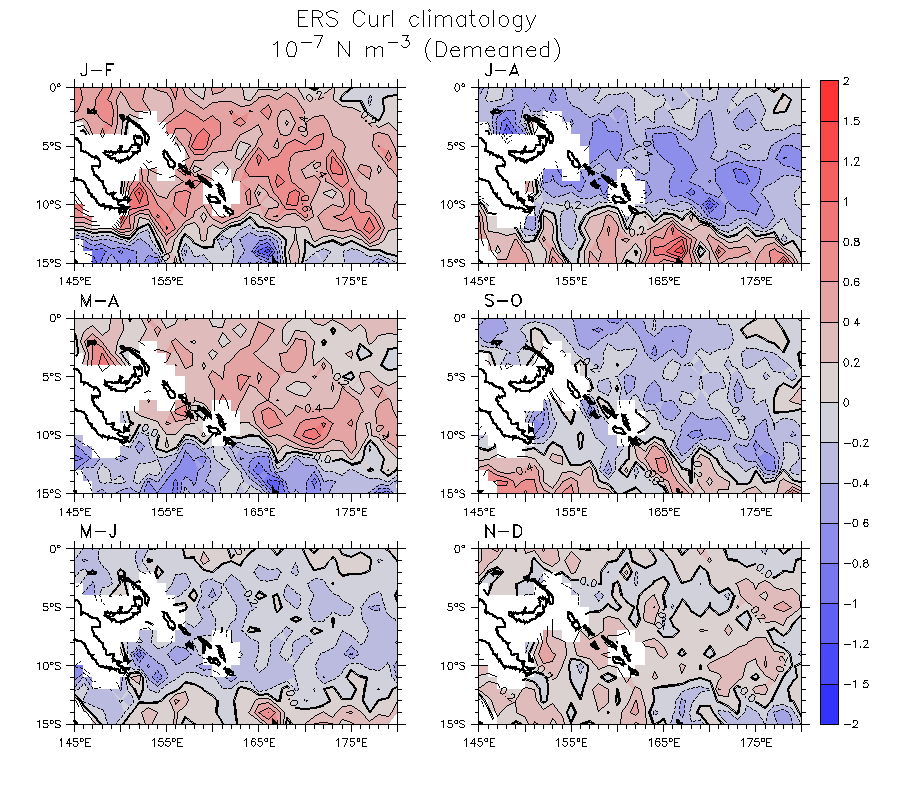
- ERS curl (Demeaned)
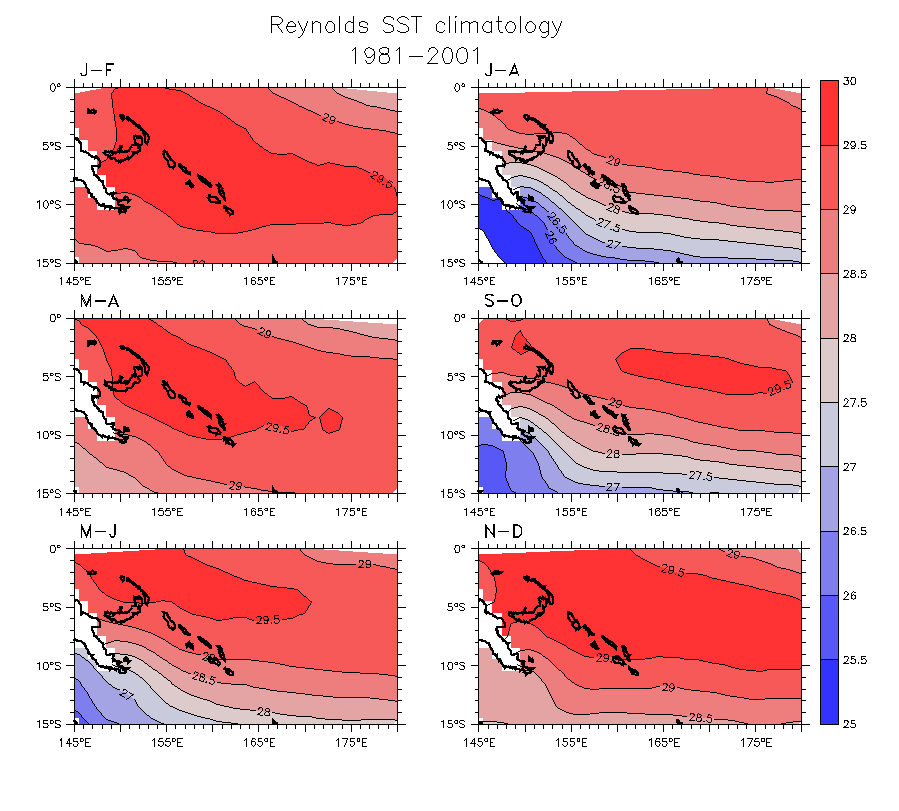
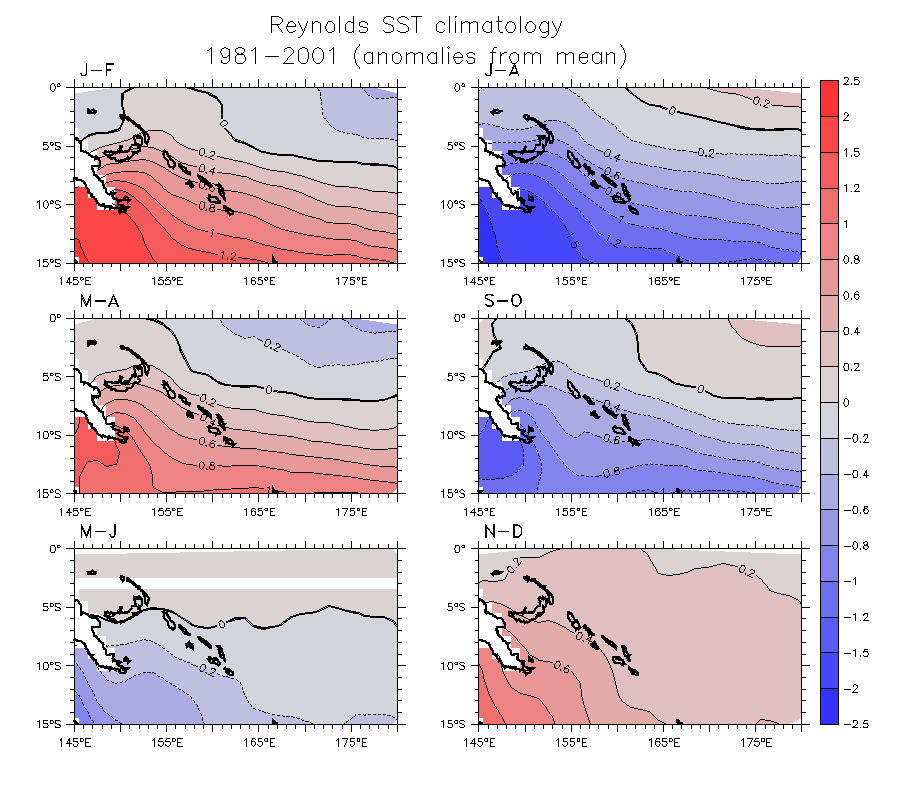
- Reynolds SST (Demeaned)
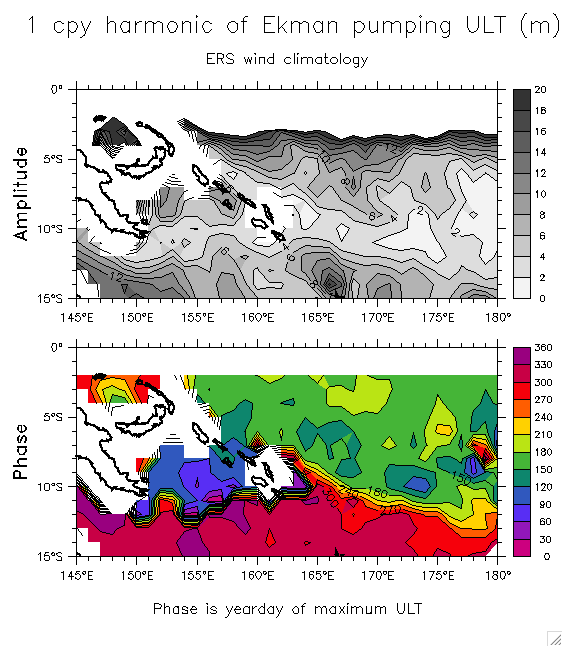
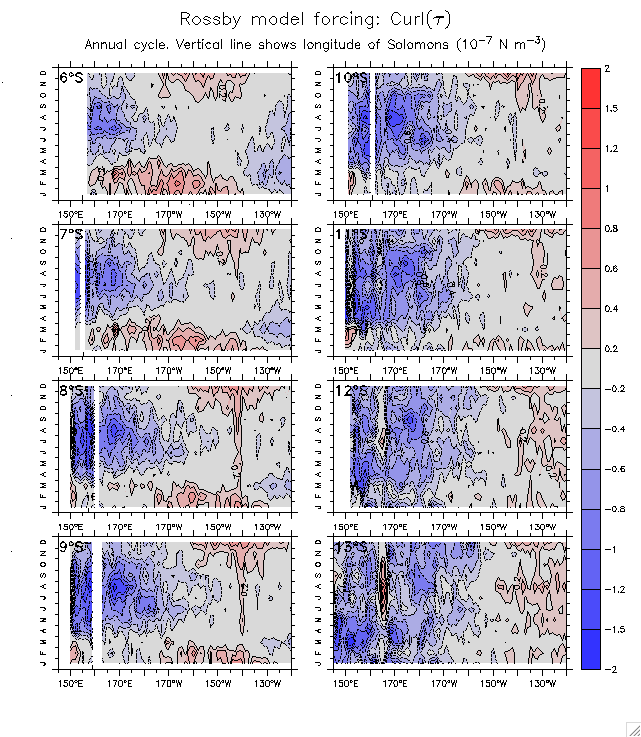
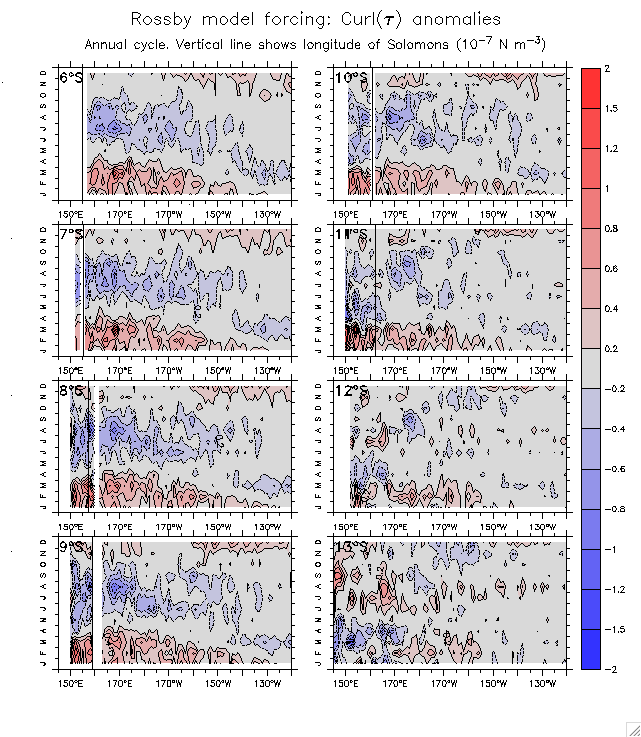
- Curl (annual cycle) Hofmullers: Obs Anomalies
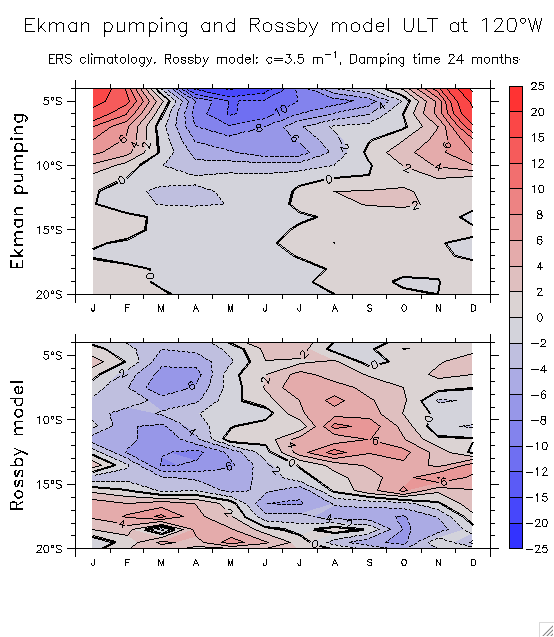
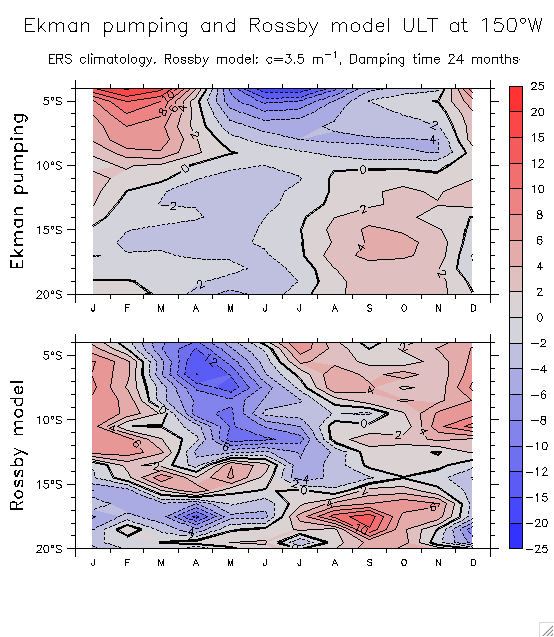
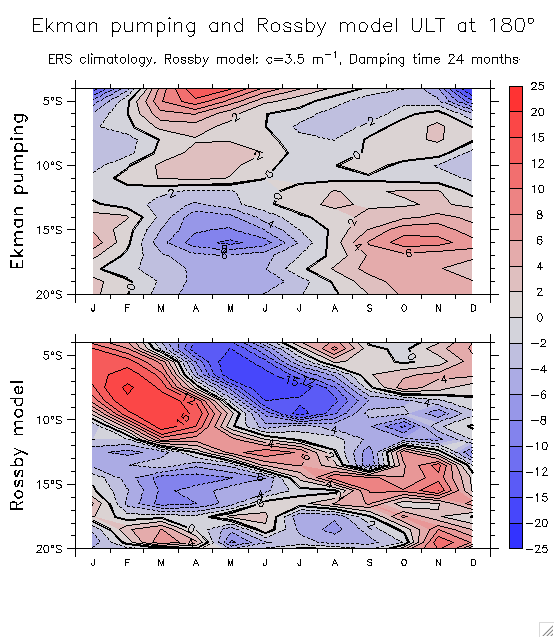
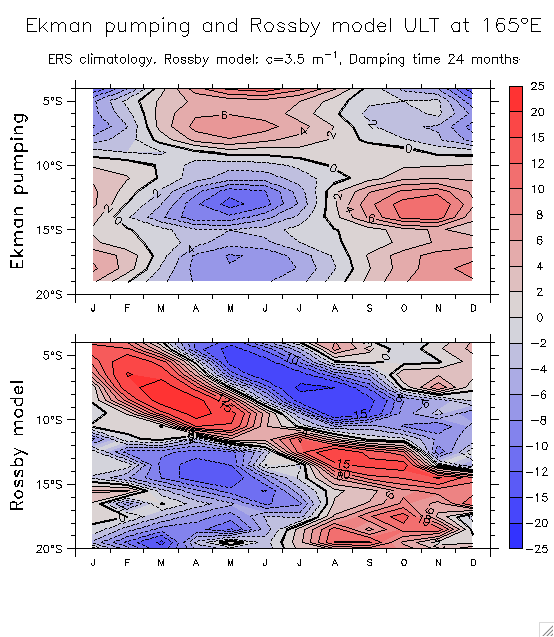
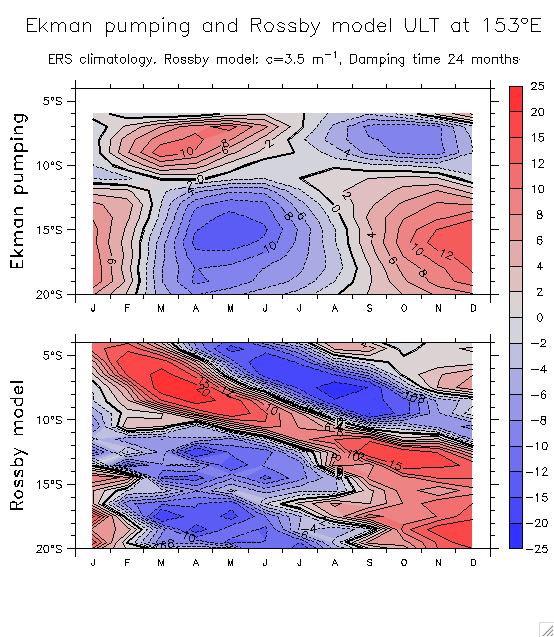
- Ekman pumping vs Rossby model solutions: 120°W 150°W 180° 165°E 153°E
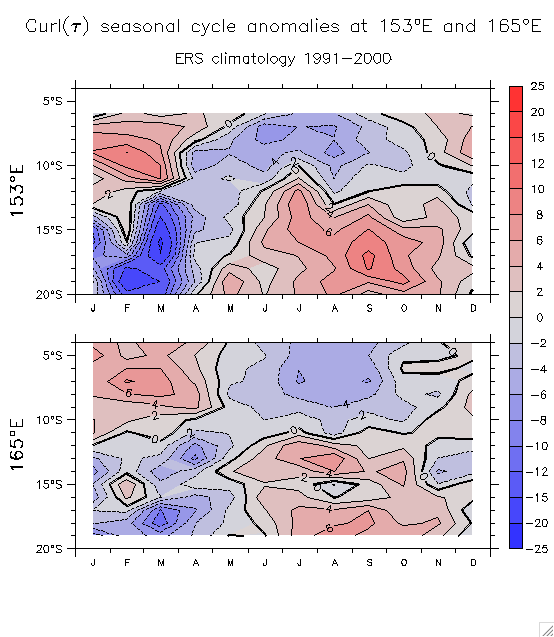
- Compare annual cycle of curl at 165°E vs 153°E
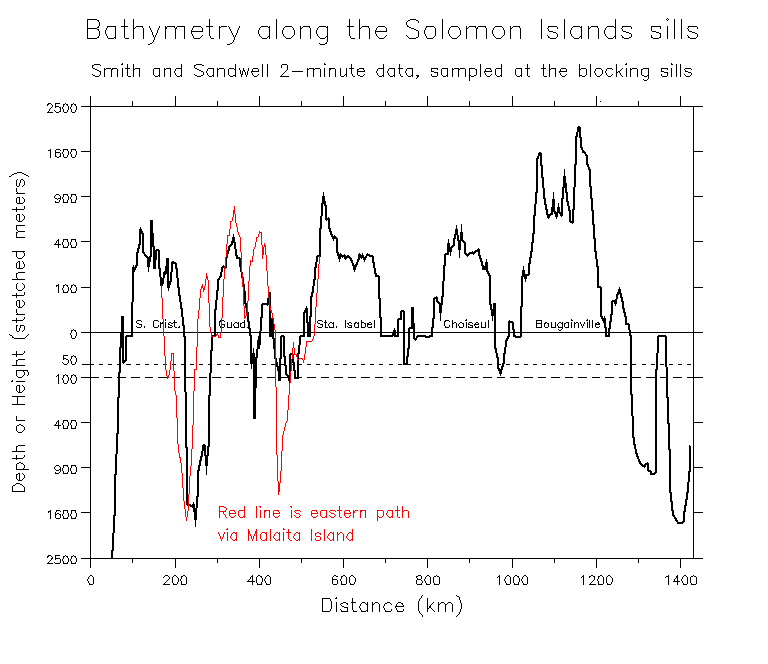
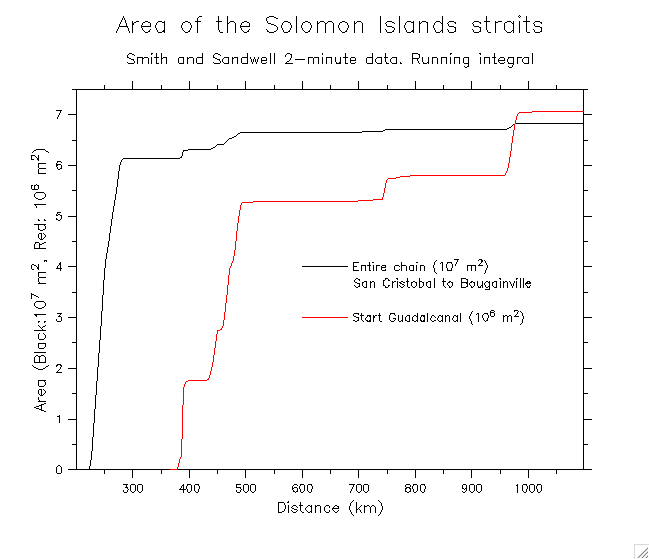
- Solomon inter-island straits:
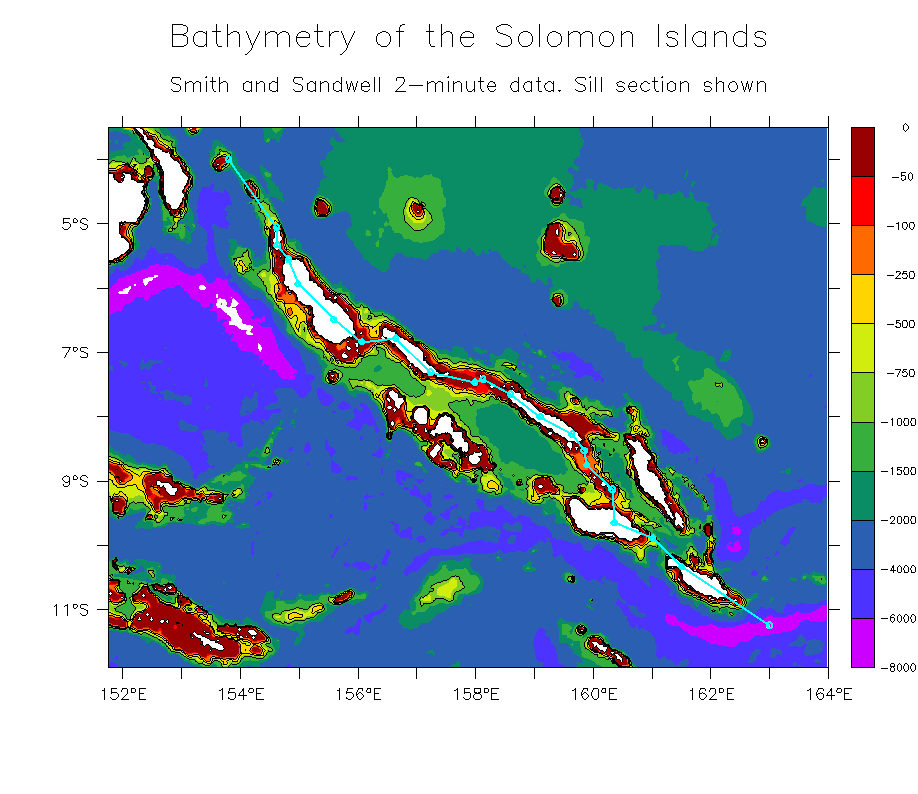
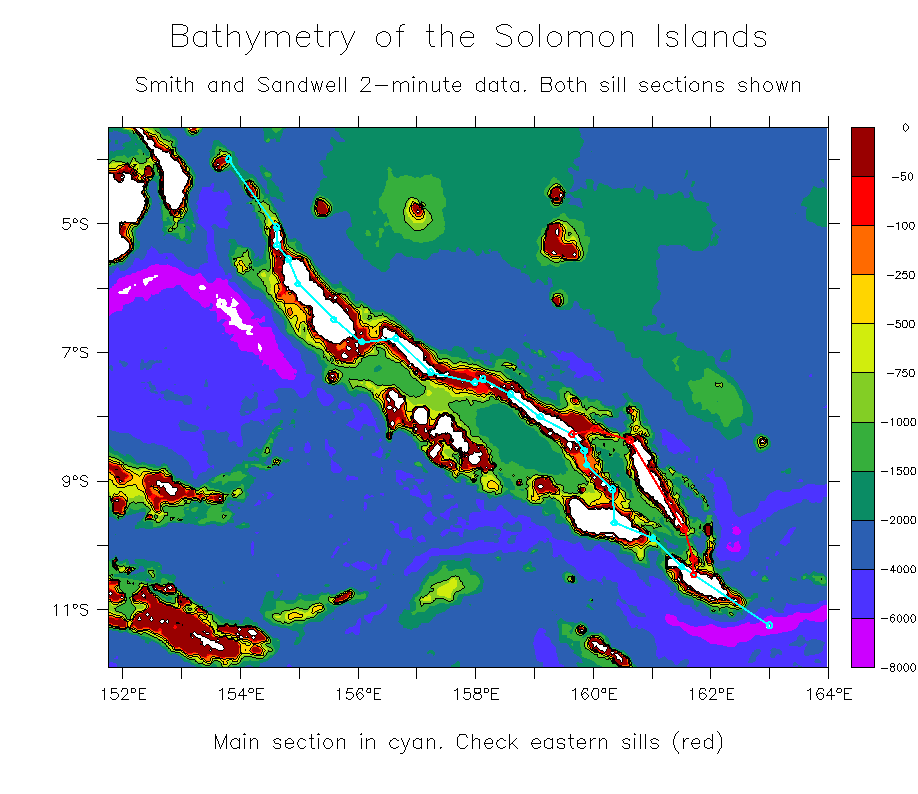
- Map showing sill section location Include eastern path through Malaita
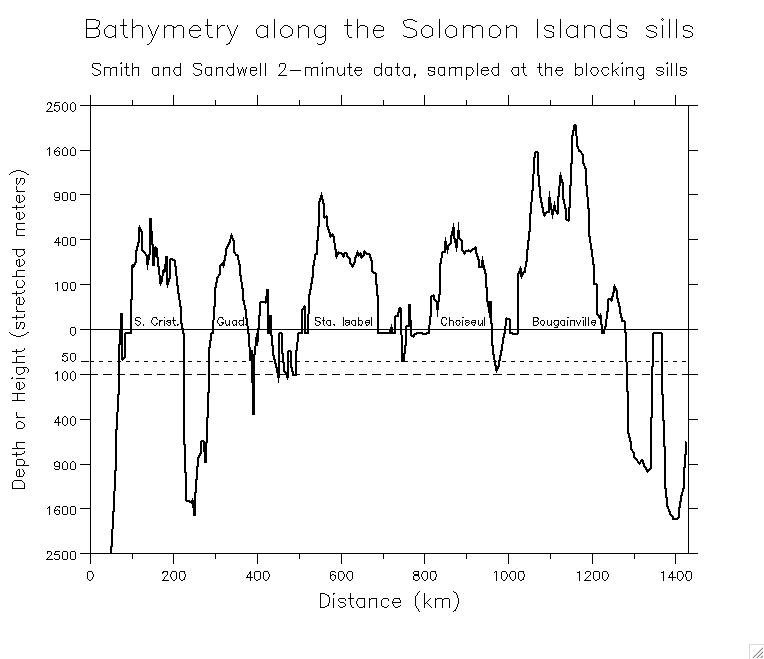
- Sill depths through the Solomon Islands (Include eastern path)
- Cross-sectional area of the straits
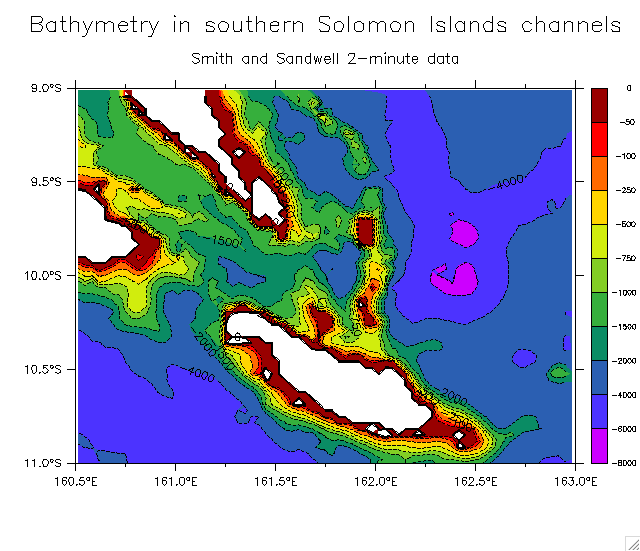
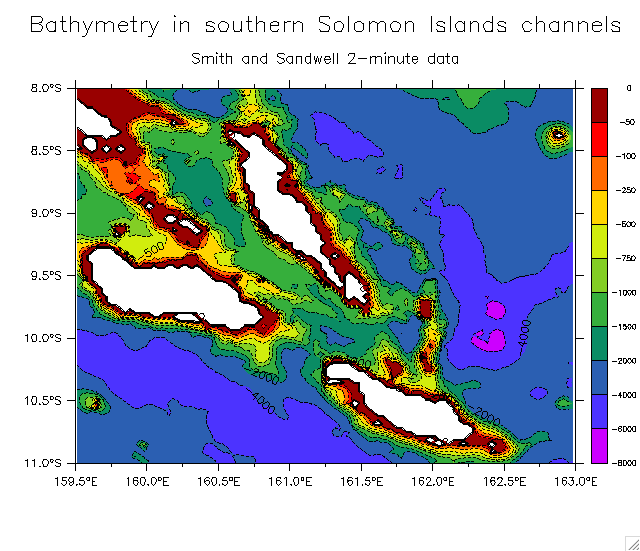
- Bathymetry details in the southern Solomon Islands: 1 2
- Bathymetry in the ORCA model:
Solomon Sea Solomon Islands Sill depths
See plots comparing ORCA and S&S bathymetry in section 1g of the ORCA page
Return to main page
Other pages: