5 Selecting on Spot Count
Once you have an estimate for the heritability of spot count in your Left Field population, go back to the Analyze Populations tab in the Analyses pane. Make a note of the mean spot count for the Left Field ladybugs. The mean appears below the graph, and it is indicated by a white dot on the horizontal axis of the histogram.
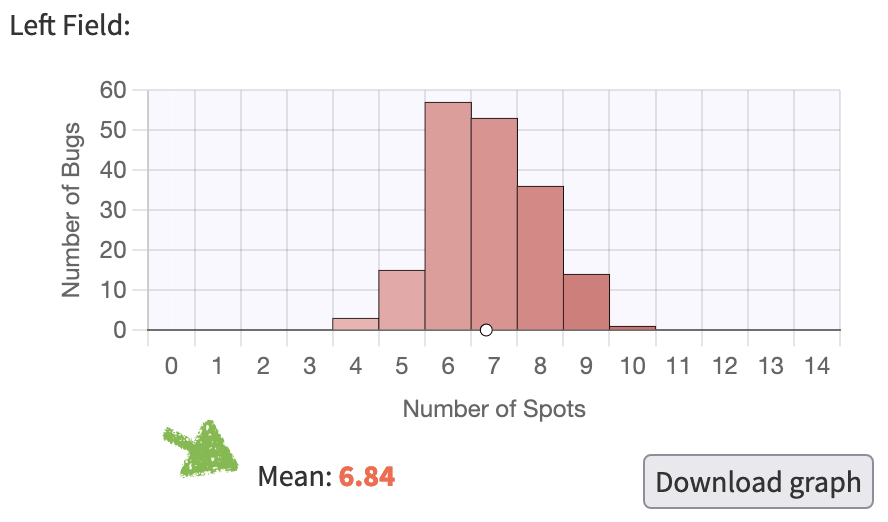
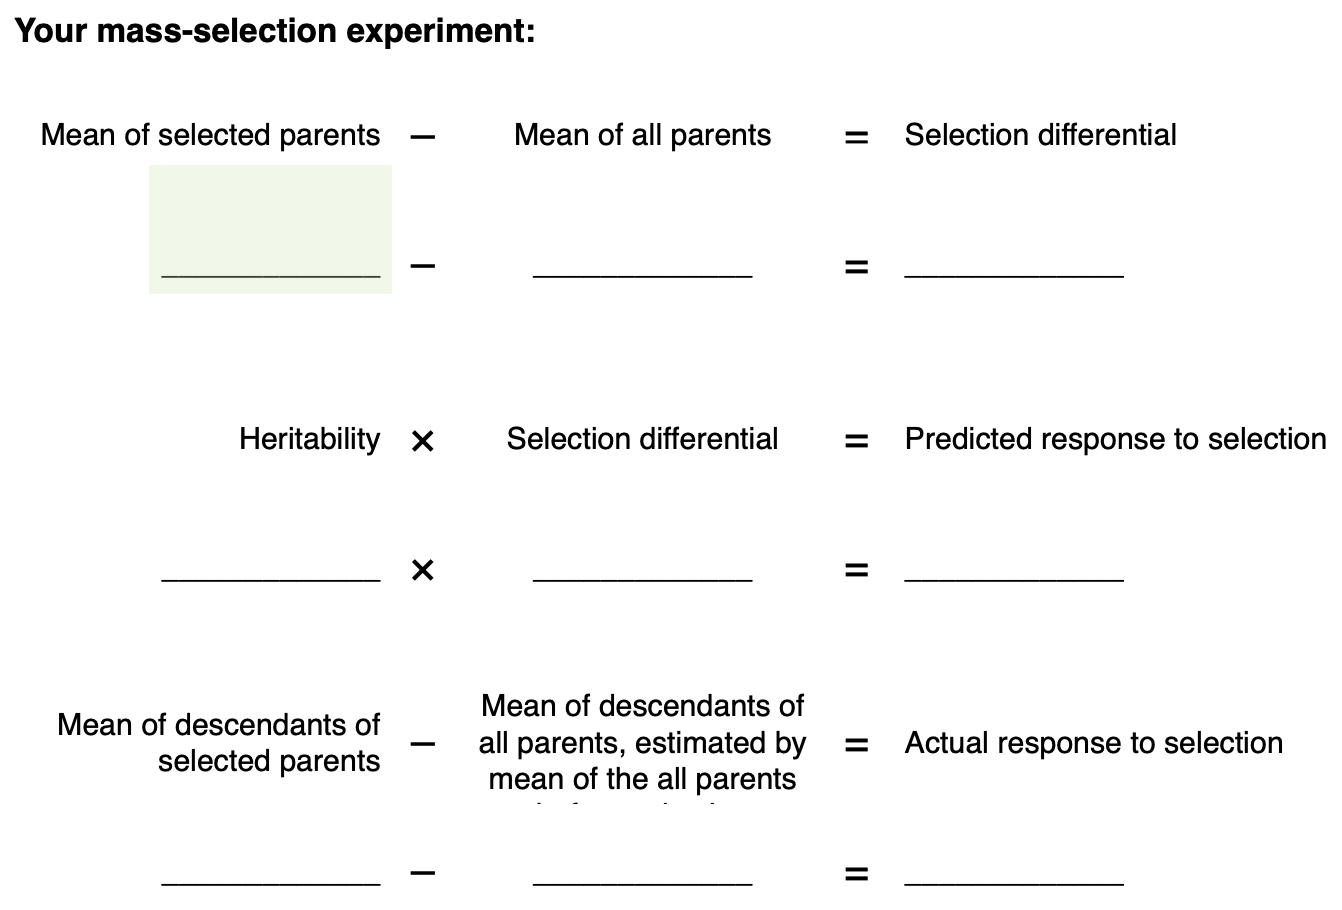
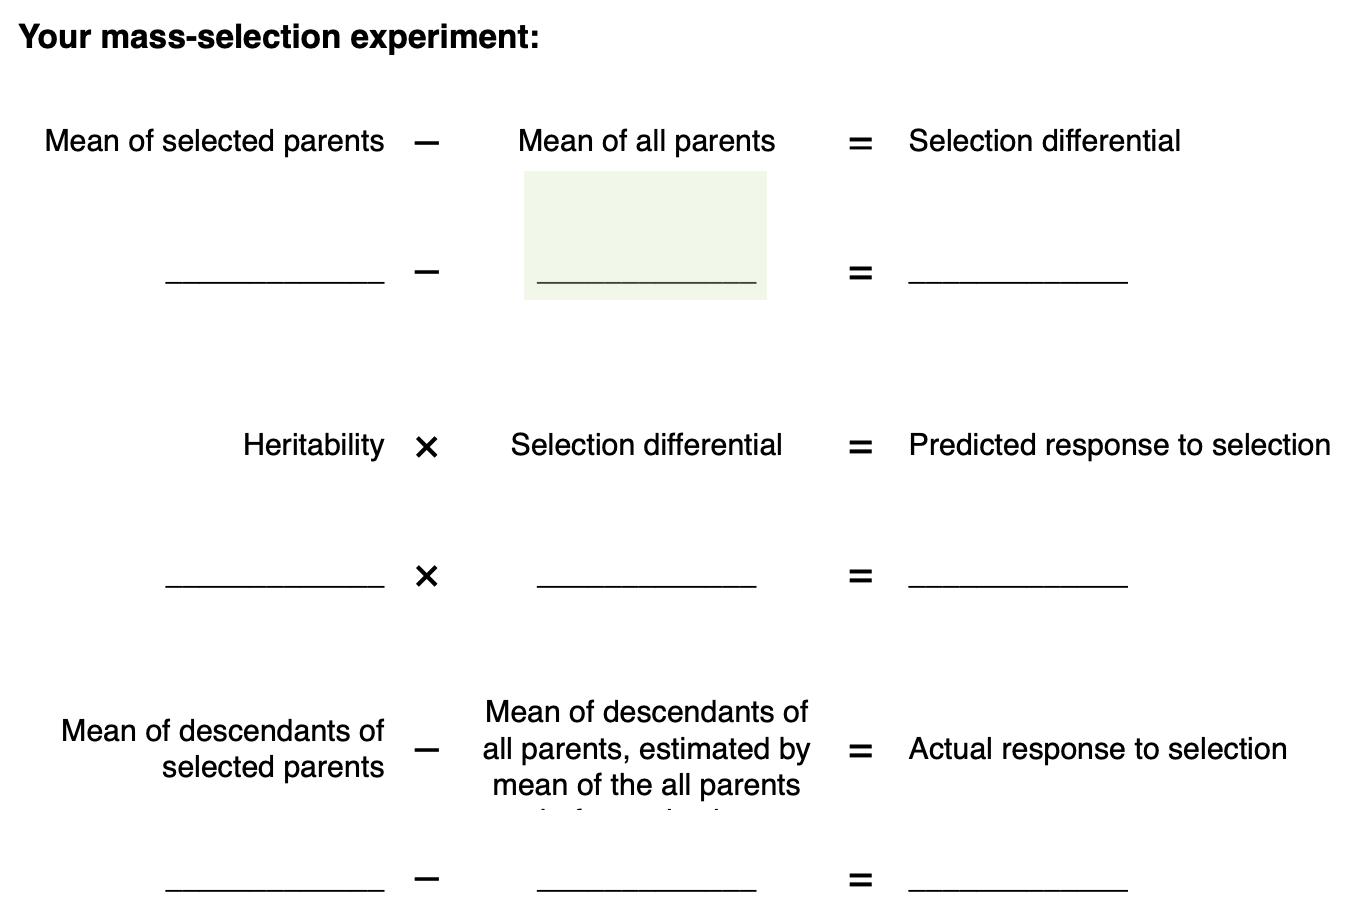
Record the mean of your Left Field population on your copy of the Bugsville worksheet:
Now you can perform a mass selection experiment. Decide whether you will select for high spot count or low spot count. Move at least a dozen adult ladybugs with the desired spot counts to Right Field. Make sure they are touching each other, so that when you start the simulation running they will mate.
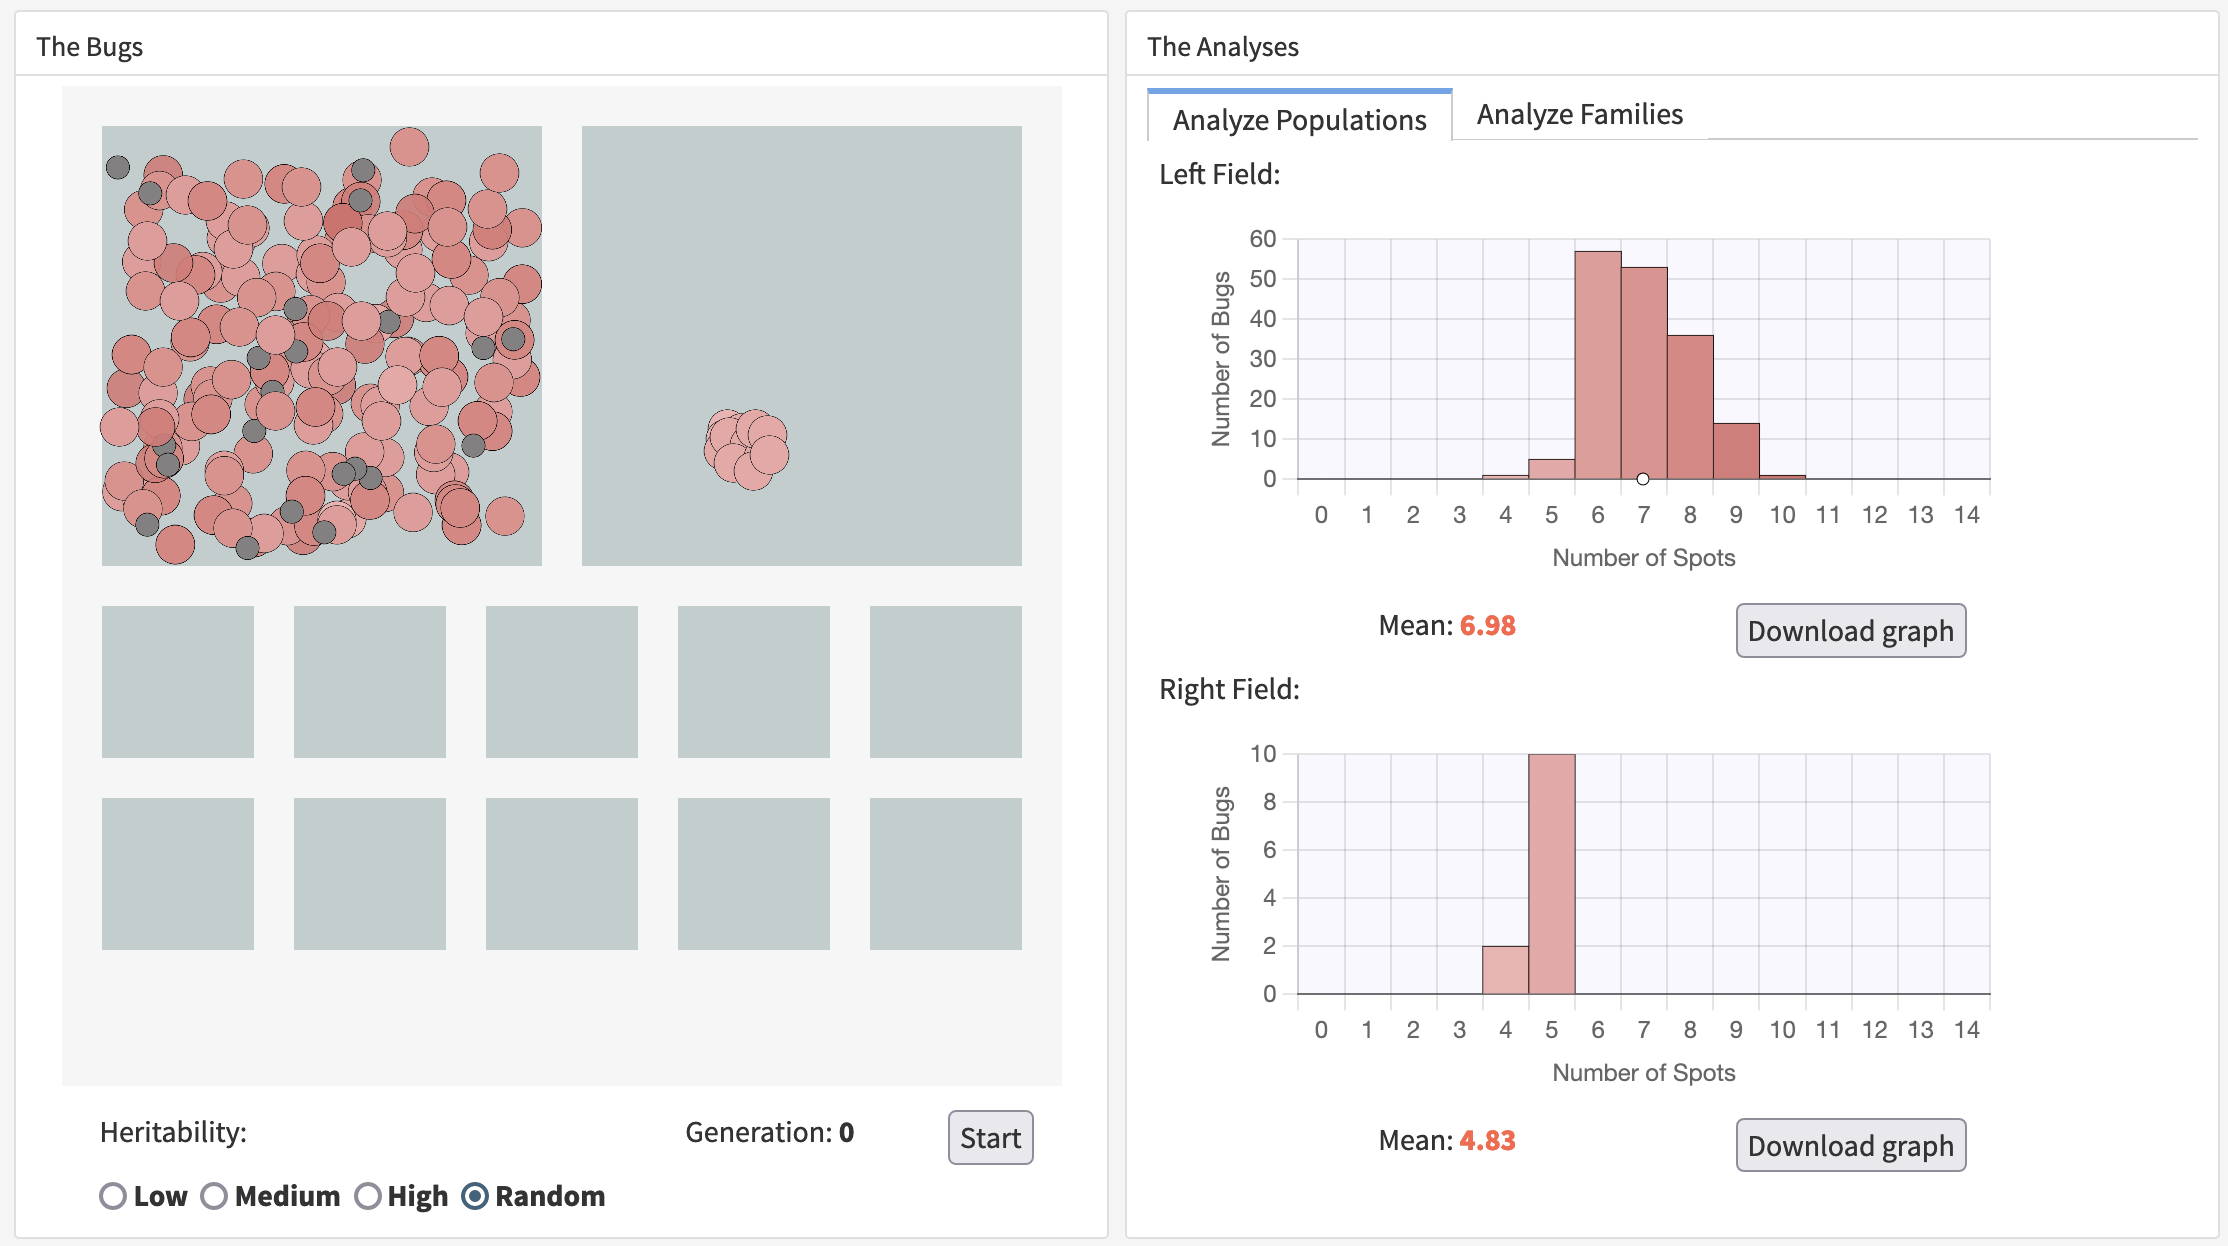
Before you start the simulation, make a note of the mean spot count in your newly-established Right Field population.