3 Analyzing Families
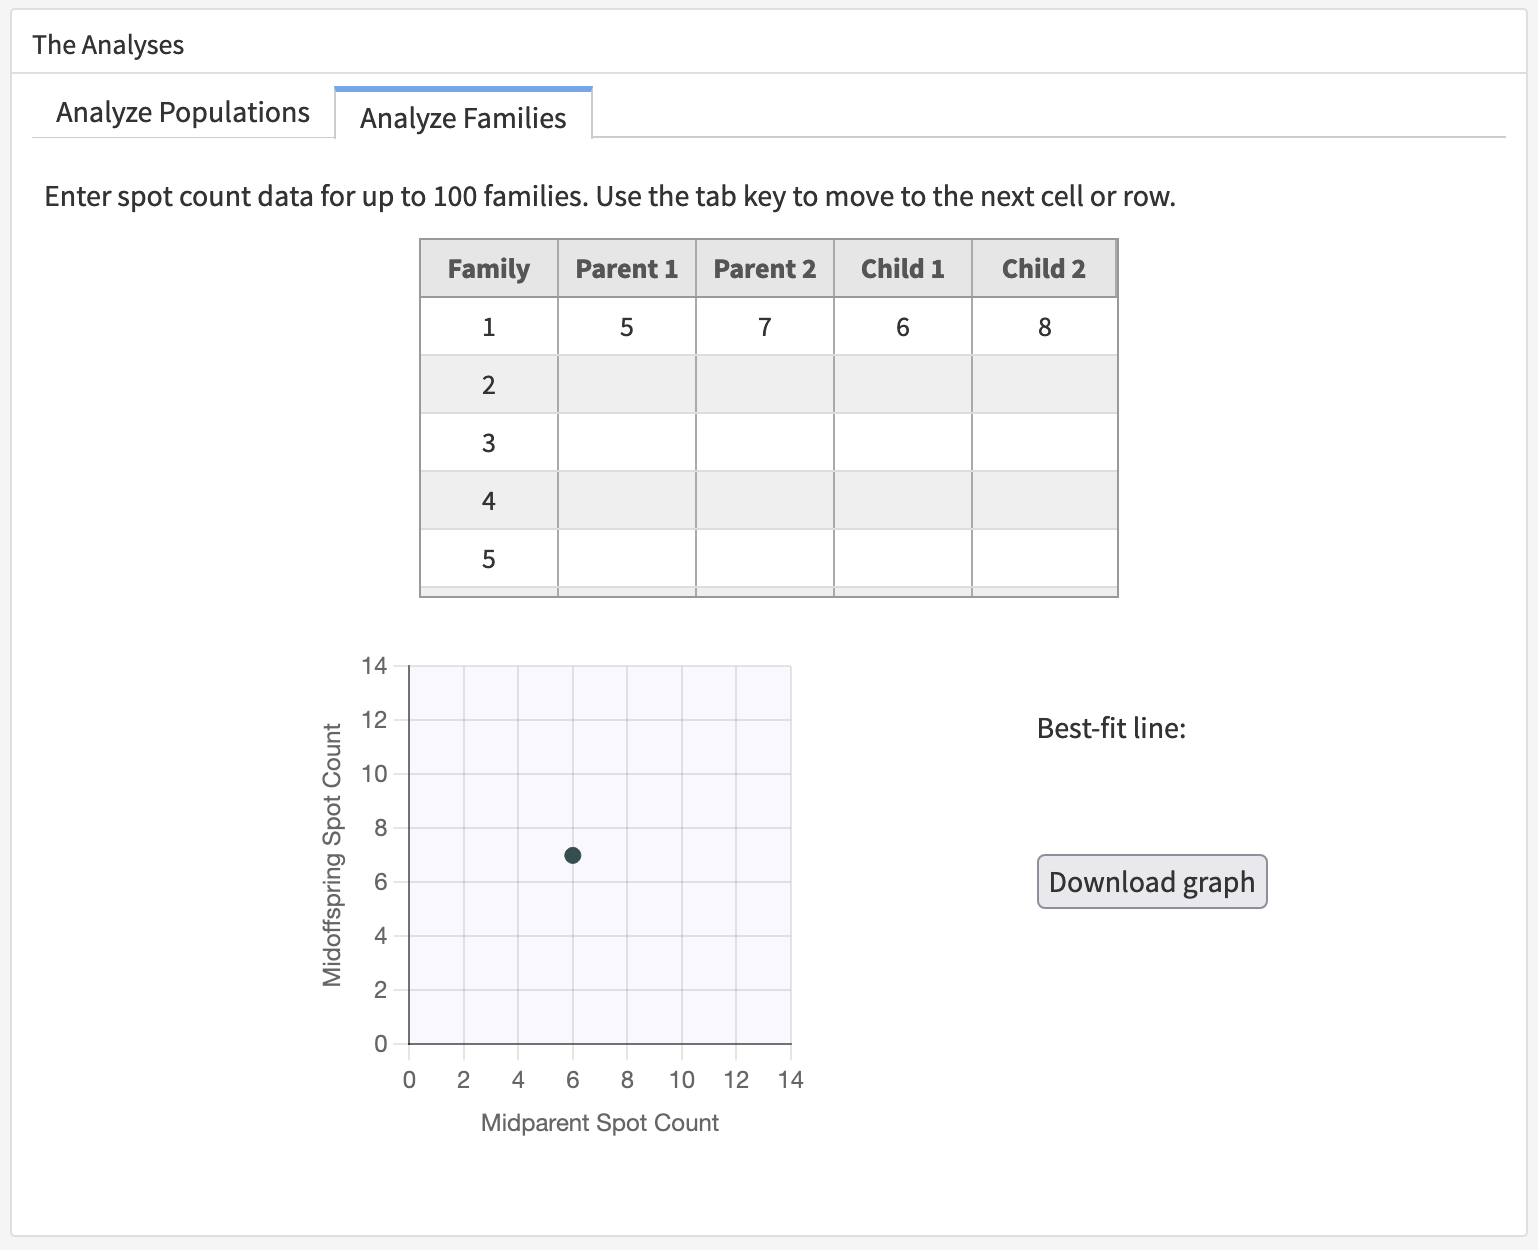
One way to assess whether variation among individuals is due to genetic differences is to let them reproduce, then note whether the offspring resemble their parents. In the Analyses pane, click on the Analyze Families tab. You should see an empty table where you can record data on parents and offspring. And you should see an empty graph.

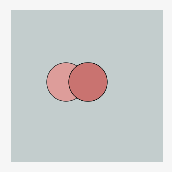
Drag a pair of adults into the first of the breeding pens. Note how many spots each bug has and record the numbers in the Family 1 row of the data table. Make sure the ladybugs are touching each other—so that when you run the simulation, they’ll mate.
You don’t need to worry about which ones are female and which ones are male. Any of our ladybugs can mate with any other!
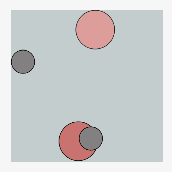
Run the simulation just long enough for your pair to make a couple of larvae, then stop it.
Now move the adults out of the pen—so that when the babies grow up, you don’t lose track of who is who.
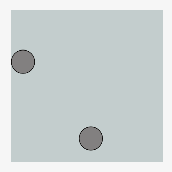
You can return the adults to Left Field if you like, or you can just throw them out by dragging them into the light gray area around the pens.
Finally, start the simulation again and run it just long enough for the babies to grow up.
Note how many spots each adult offspring has and record the numbers in the data table. Once you’ve typed the last number, then pressed the Tab, Enter, or Return key, a dot will appear in the graph showing the average spot count of the offspring, also known as the “Midoffspring” value, versus the average spot count of the parents, also knows as the “Midparent” value.