2 Assessing Variation within Populations
Click on several of the adult ladybugs in Left Field and count their spots.
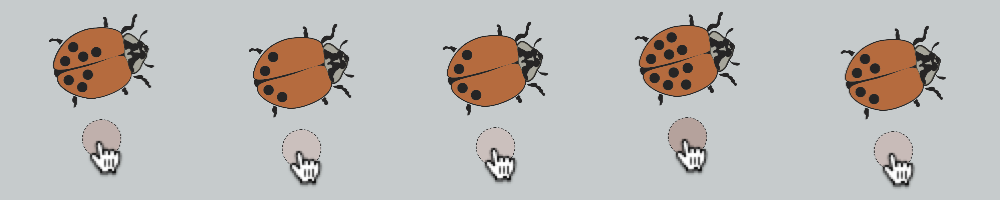
What is the highest spot count you can find? The lowest?
What is a typical number of spots?
Now notice the pane labeled The Analyses. Make sure the Analyze Populations tab is active.
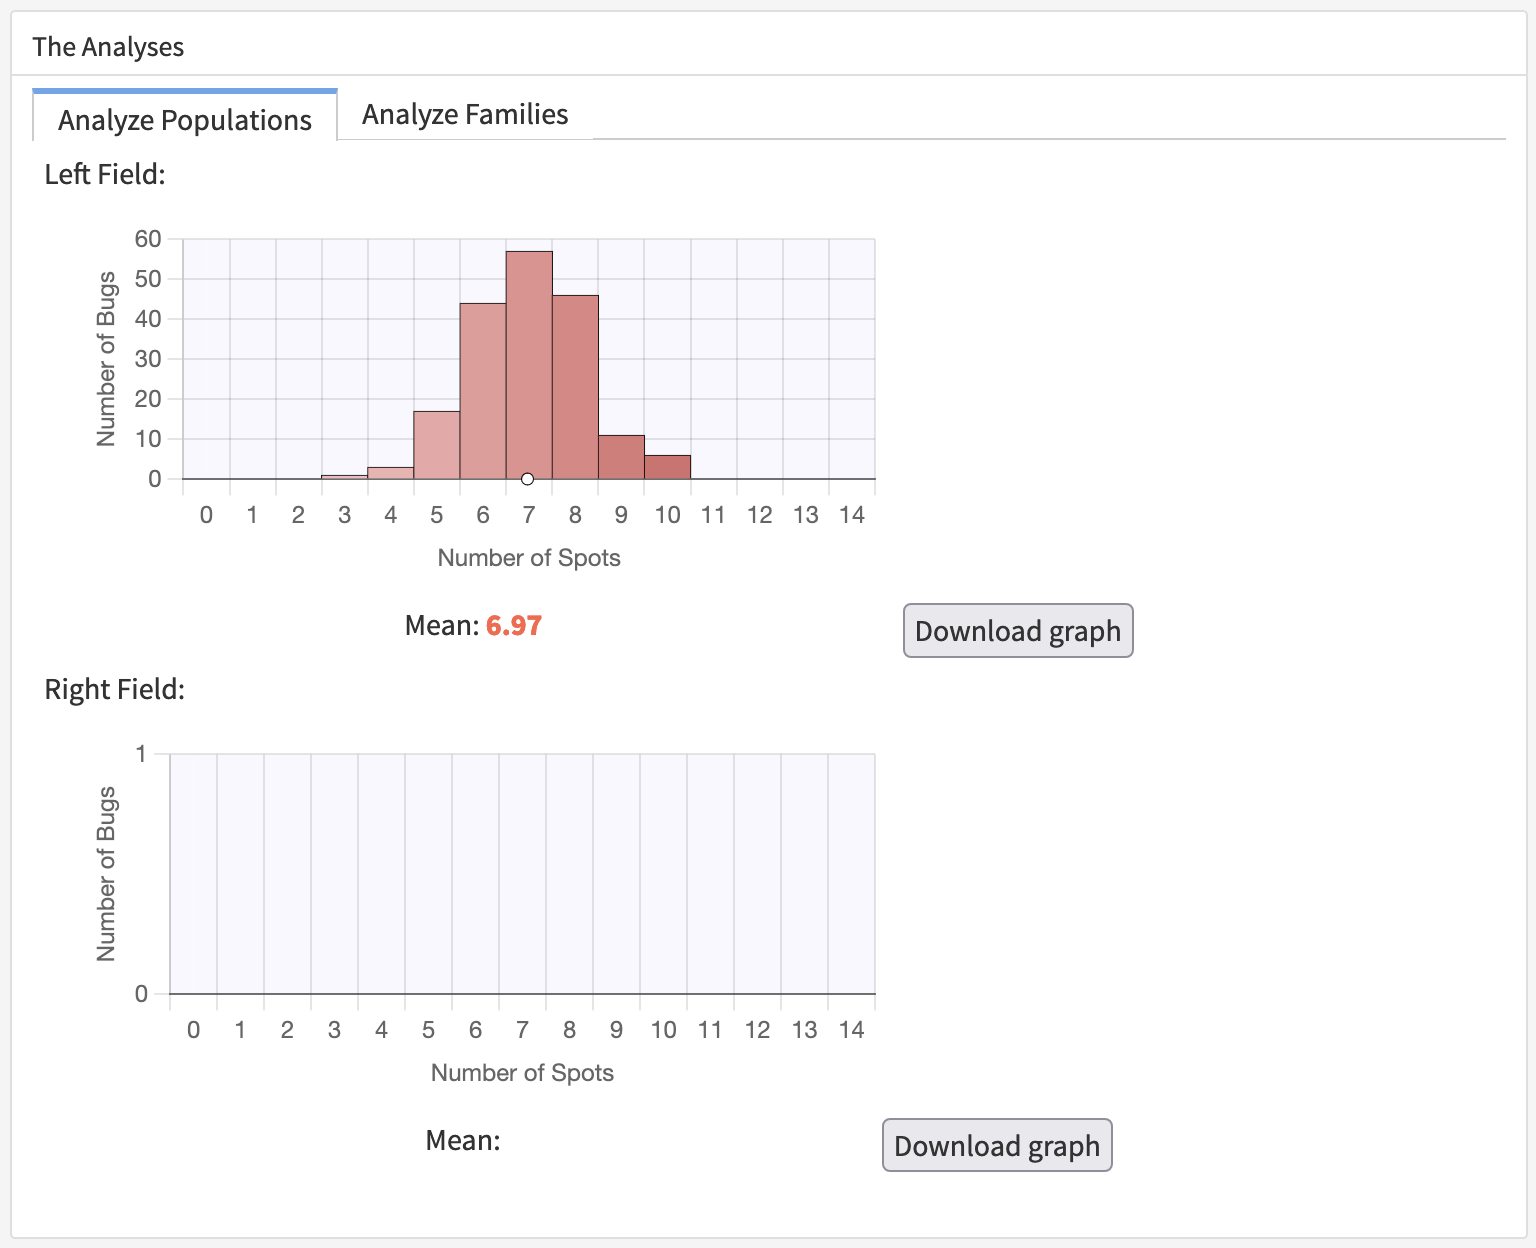
This tab contains histograms revealing the distribution of spot counts in the Left Field population (top) and the Right Field population (bottom). If you drag a few bugs from Left Field to Right Field, you should see both histograms update. If you start the simulation, you’ll see that the histograms update continuously.
Here is the histogram for the current Left Field population on my computer.
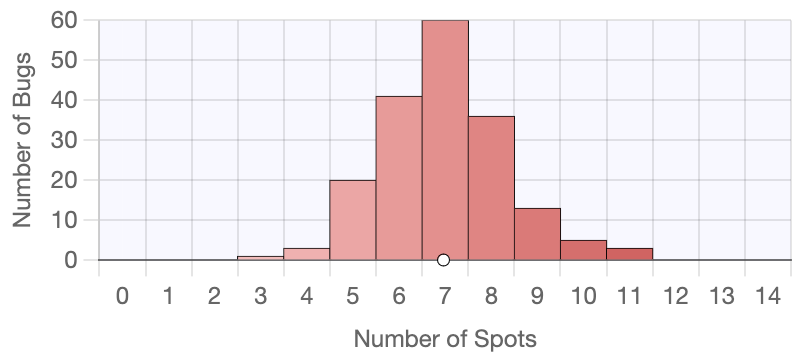
- Looking at your histogram for the Left Field population, does it confirm (or expand) your impression of how how much the bugs in Left Field vary in spot count?
Your next task is to learn how much of the variation among individuals in the Left Field population is due to differences in the genes the bugs inherited from their parents. Before you start, you may want to pick a different heritability or refresh the window. Once you start breeding bugs to get data on families, remember that if your browser refreshes, all your work will be lost.