Transfer
Function
Frequency
Response
Exercise 1 - Basic Concepts
Background
Mechanical waves originate in the forced motion of a portion of a deformable medium. As elements of the medium are deformed the disturbance, or wave, progresses through the medium. In this process the resistance offered to deformation by the consistency of the medium, as well as the resistance to motion offered by inertia, must be overcome.
As it is natural to expect, the local excitation of a medium is not instantaneously detected at positions that are at a distance from the region of the excitation. It takes time for a disturbance to propagate from its source to other positions. This phenomenon of propagation of disturbances is well known from physical experience, and is usually referred as wave propagation.
BACK TO TOP
Objective
In this first lesson we will introduce basic concepts of wave propagation and will present some simple illustrative examples. The propagation of 1-Dimensional shear waves in a half-space will be visualized in real time. Expressions for wave-speed, wave-length and wave-number will be established and its values calculated using Dr. Layer.Things to Do
Wave Velocity Calculations
-
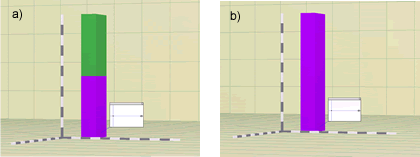
Open the Dr. Layer program. By default we get twelve layers. The top six layers are hardwired into the system with a very high phase velocity. The bottom six layers are hardwired with a very low wave velocity (Figure 1a).
-
Starting with this default configuration, select with the mouse the upper six layers. To carry out this step press the mouse on each sub-layer while keeping the shift key pressed and hold down. Each time you choose a sub-layer, it becomes bigger showing it has been selected. Finally, choose the “very slow” option from the “wave speed” menu. The color of the selected sub-layers will change to confirm the change in wave speed, (Figure 1b).

Figure 1- a) Initial configuration b) Homogeneous Soil Layer -
In the upper left corner of the Dr. Layer tool we find a text window with four different loading conditions; i.e. pulse, sinusoidal, ramp, and earthquake. The first three represent displacement boundary conditions. The earthquake option represents accelerations. In DrLayer, all the boundary conditions are applied to the bottom layer. By default the sinusoidal option is selected. For this particular exercise choose the pulse load from the loading window.
-
Starting with the set up described above, move the cursor to the upper left portion of the screen and press on the time increment button
 to set up the wave motion. You will immediately notice a pulse wave
that travels from the bottom of the layer. To better visualize the
pulse traveling through the layer you can scale the displacements
by pressing the
  bottom.
 -
Determine the time it takes the pulse disturbance to reach the top of the soil layer and take note of the time. For your convenience the time is posted in seconds in the lower left corner of DrLayer. The velocity of propagation of the disturbance (or wave velocity) can be determined by dividing the total length of the layer by the time it takes the disturbance to travel it. This length can be determined using the bars that are provided in DrLayer to represent the axis. Each segment in each bar represents 10 feet. To better visualize the layer, and get a more accurate measurement of the layers’ length, use the pan
 ,
camera orbit
  ,
and zoom
  tools. Assuming the density of the medium to be xxx estimate the stiffness
of the medium. The time it takes the wave to travel along the soil
layer can also be detected using a displacement plot box at the top
of the layer. To do this, select the
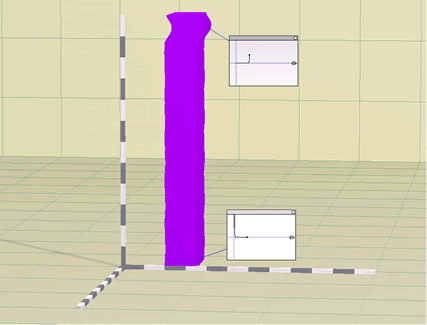
  bottom and clip on any point in the soil layer, Figure 2).

Figure 2 - Pulse shear wave traveling along soil layer
When the disturbance reaches the upper part of the medium it reaches a free boundary. The free boundary condition induces a reflection of the disturbance (Figure 3b). Note the sign and amplitude of the reflected wave. The reflected wave will travel back through the medium and eventually will reach the lower portion of the layer, which is not free to move. This boundary condition represents a fixed boundary condition. Upon reaching this point the disturbance will be reflected again, (Figure 3c). Note the sign and amplitude of the reflected wave. Notice also that the reflections will continue infinitely as time goes on. Its like if the pulse were trapped in the medium. As we will see in further lessons this is an extreme condition hardly found in real cases. Most real situations show some damping and/or radiation of energy.

Figure 3 - Characteristics of reflected waves: a)Incident wave; b)Reflected wave at free top surface; c)Reflected wave at fixed bottom boundary.
Wave Length Calculations
-
Reset the system to time zero by pushing the
 key. Select the sinusoidal loading option from the loading menu window.
-
Push the go
 bottom to start the motion. A sinusoidal displacement
wave will be generated at the bottom of the layer. This input oscillation
(disturbance) can be visualized in the plot box that automatically
appears at the bottom of the layer when DrLayer is opened. The characteristics
of the harmonic disturbance can be obtained by clicking the right
mouse bottom in any point inside the plot. The amplitude of the displacement
and time at the selected point will appear in the lower portion of
DrLayer. Using this capability try to get a good estimate of the maximun
amplitude and time period, T (or frequency f=1/T), of the harmonic
input displacement.
 -
In addition, notice that, as time goes on the disturbance propagates through the layer in the same manner as in previous example. The difference is that in this particular case the particle displacements follow a harmonic shape.
-
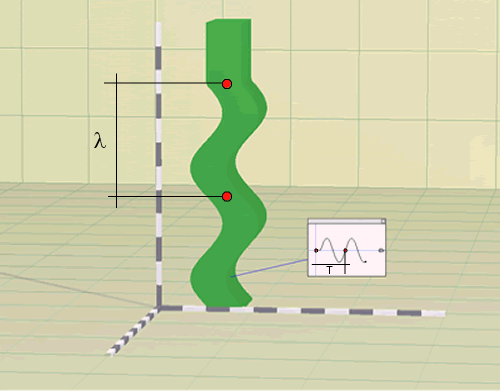
Measure the wave length, l, as the distance to undergo a single oscillation along the soil layer. To this end use the bars that are provided in the DrLayer axis. Each segment corresponds to 10 feet. Notice that since a harmonic wave travels through the layer, the wave length, l, can be determined using a similar procedure as the one used to evaluate the input period. However, in contrast to the input period T, wave length has units of distance.

Figure 4 - Harmonic Motion; Wave-length vs. Input Time Period -
Repeat the test using the same harmonic motion but different soil stiffness. To carry out this step, use the “select all” option from the “Edit” menu, and choose the “Slow”, “Medium”, “Fast” or “Very Fast” option from the “Wave Speed” menu. In DrLayer each wave speed is associated with a different stiffness.
-
Setback the motion to zero by pressing the
 key and restart the motion using the
  key. Determine the wave-length following the same procedure as described
above. Notice the change in wave-length as the stiffness changes.
 -
Repeat the test for different input amplitudes and frequencies. To carry out this step use the scrolling bars for frequency and amplitude that are provided in the upper right portion of DrLayer. Note the change in wave-length as the amplitude and frequency of the harmonic input motion are varied.
-
Another concept related to wave-length is that of wave-number, k, that accounts for the number of wave lengths over 2p. By definition k=.... Using your calculations from the previous step estimate the corresponding wave-number values. Notice that the wave number is inversely proportional to the wave-length. Then, an increasing wave-length implies a decreasing wave-number.
BACK TO TOP
Observation
Wave Speed- Upon reaching a free boundary, reflected waves show the same
amplitude as incident waves but opposite sign. This is a characteristic
of free boundary conditions and can be proved mathematically.
- Upon reaching a fixed boundary, reflected waves show the same amplitude and sign as incident waves. This is a characteristic of fixed boundary conditions and can be proved mathematically.
- Notice that for a selected harmonic input motion, the wave-length
increases as the soil stiffness (or wave speed) increases.
- Notice that increasing the harmonic input motion amplitude the wave-length
does not change. However, the wave-length is affected by changes in
frequency. Increasing the harmonic motion frequency the wave-length
decreases. These findings are in agreement with the theoretical definition
of wave-length that says:
where vs is the shear wave velocity, T is the motion period, f is the motion frequency, w is the circular frequency and k the wave number. (1)
(1)
On Your Own
- Using a pulse displacement
input motion, estimate values of wave speed for all possible DrLayer
soil conditions. How does wave speed relate to soil stiffness??
- Release the base
and observe the characteristics of the reflected pulse wave.
- Using the default values of amplitude and frequency determine the wave-length for all possible values of soil stiffness.
BACK TO TOP
Last
Updated:
12/27/00
Contact us at: parduino@u.washington.edu