8 Testing The Analytical Model
After completing the previous section, you may be wondering about the accuracy of the mathematical prediction we’ve made. I certainly hope that you are! That’s because I designed Ducks & Gators to let you assess the accuracy of the mathematical model for yourself—by running your own experiments.
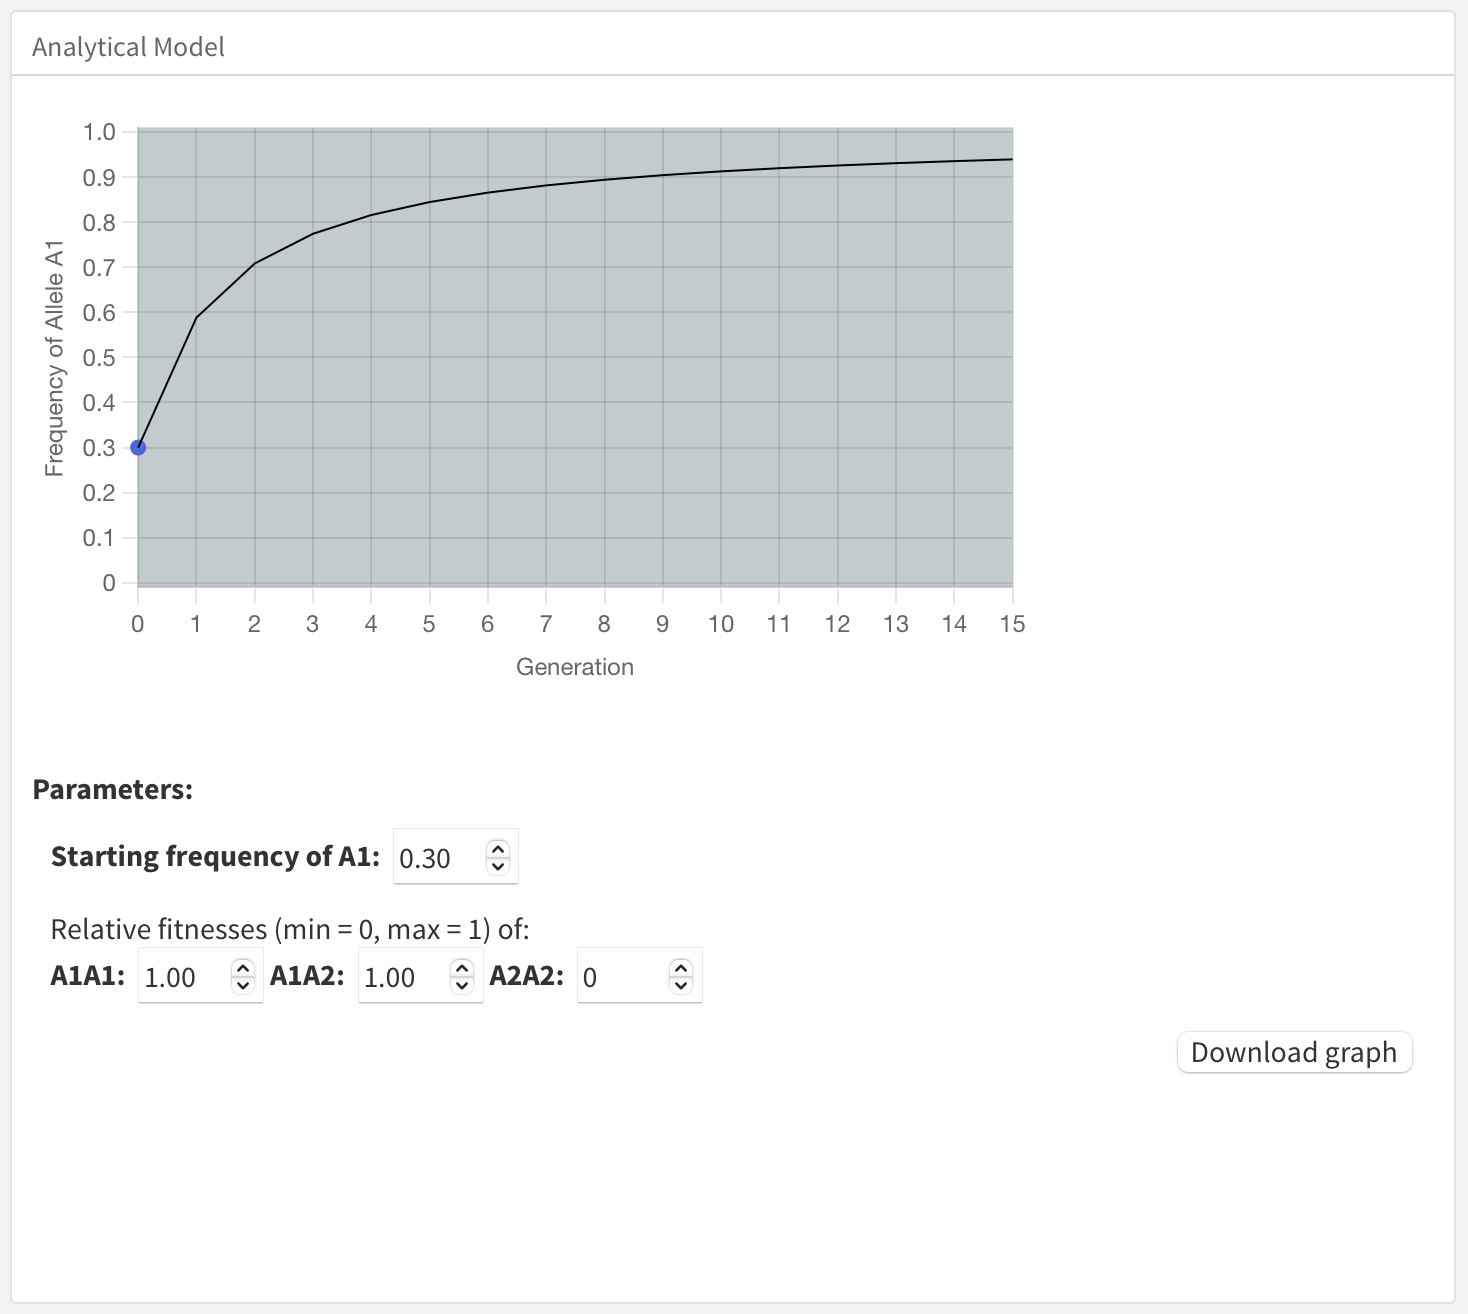
You’ve already worked with the model duck population in the Duck Pond panel, and watched it evolve across generations. The Analytical Model panel will do the arithmetic for you to predict precisely how quickly the duck population will change. All the analytical model needs is a starting frequency for allele A1 and fitnesses for the three genotypes. Given these parameters, the analytical model will do calculations like the ones we just did for the songbirds in the previous chapter. The analytical model will repeat the calculations, over and over, to predict how the frequency of allele A1 will change over 15 generations:
But what are the fitnesses of the three genotypes? You need to measure them for your genetic model, in your pond, with your collection of alligators arranged as they are around the lake. Here’s how.
In the Duck Pond panel, set up a genetic model that you like and a number of gators you like. Then:
Make sure the Measure Fitness tab is selected.
Pick a genotype to assess using the radio buttons.
Click the New ducks button to make sure your population contains 100 ducks.
Click the Start button. The ducks will swim around the pond for 360 timesteps—which equals one generation. Some of the ducks will get eaten.
The fraction still alive when the simulation stops is a measure of the fitness of ducks with the genotype you are testing. Make a note of it.
Assess and make note of the fitnesses of the other two genotypes as well.
Be aware that if you change anything about your model—the phenotype associated with each genotype, the number of gators, or where the gators are sitting—the fitnesses of the genotypes will also change. This means you’ll have to measure them again.
You are now in a position to check how well the theory of population genetics can predict how your duck population will evolve across many generations:
Select the Monitor Evolution tab. Adjust the starting frequency of allele A1 in your ducks. You can also change the population size. You can get a new population by clicking on the New ducks button.
The line on the graph in the Analytical Model panel shows the prediction for how the duck population will evolve. This prediction is made using the arithmetic of the Hardy-Weinberg Equilibrium Principle.
Set the starting frequency for the prediction to match what it is for your virtual ducks.
Set the fitnesses of the three genotypes to match the values you measured for your ducks.
- Note whether the graph predicts that the frequency of A1 will rise or fall—and how quickly.
Finally, click the Start button. The blue dots and dashed lines on the graph will show how the frequency of A1 actually changes across 15 generations.
- How accurate was the prediction for your ducks? How might you improve it?
Try another genetic model and/or another starting frequency. Try a model in which the frequency of A1 rises and a model in which the frequency of A1 falls.
- How well, in general, does the theory of population genetics seem to work?
I expect that the answer will generally be “pretty well.” If that’s not your impression, I suggest going back through the instructions and trying again.