5 Genotype and environment and fitness
Before working on this section, click the Reset link at the upper-right corner of your Ducks & Gators window.
Set up a complete genetic model in which each of the three genotypes has a different color phenotype. Measure the survival of each genotype with different numbers of gators, so that you can start to sketch a graph showing survival versus number of gators for all three genotypes on a single graph:
- Does changing the number of gators by a given amount (say, from 3 to 9), have an equally large effect on the survival of all three genotypes? Why or why not?
This graph shows my results using the default genetic model:
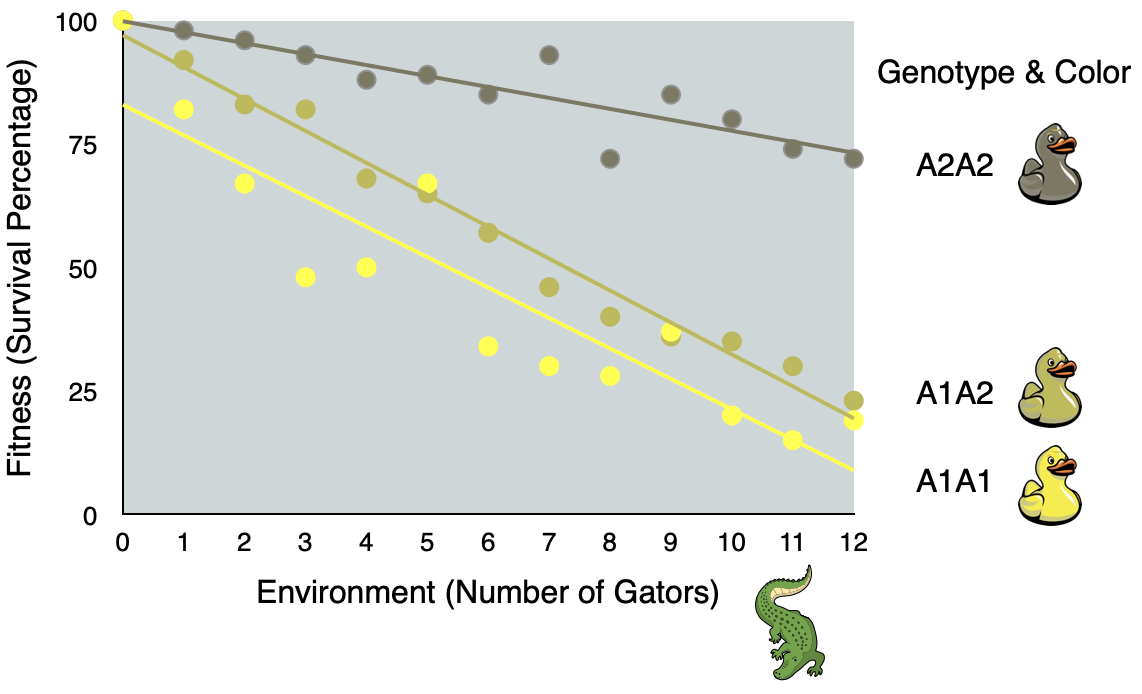
The effect of changing the number of gators is not the same for all three genotypes.
The effect is about the same for A1A1 versus A1A2 ducks. The survival rates are generally higher for A1A2 ducks than for A1A1 ducks, but changing the number of gators increases or decreases survival by about the same amount for both of these genotypes. That is, the best-fit lines through the data for A1A1 and A1A2 ducks are roughly parallel.
But the best-fit line through the data for A2A2 ducks is not parallel to the other two. Changing the number of gators has a smaller effect on survival for A2A2 ducks than it does on A1A2 or A2A2 ducks.
Evolutionary biologists describe this difference among genotypes in the slope of the best-fit line as genotype-by-environment interaction for fitness.