3 Genotype and Fitness
Before working on this section, click the Reset link at the upper-right corner of your Ducks & Gators window.
At the bottom of the Duck Pond panel, there is a set of tabs that allow you to chose one of two kinds of experiment to run: One in which you can measure the fitness (= the survival rate) of a particular genotype, and one in which you can monitor a duck population as it evolves across many generations:
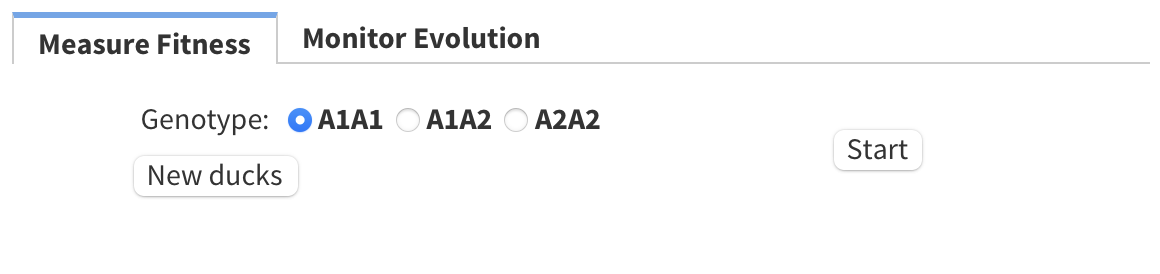
Make sure the Measure Fitness tab is in front. Note that, at the moment, all the ducks in your pond have genotype A1A1. Use the Duck Phenotypes popup menu to change the color of ducks with genotype A1A1. Click the New Ducks button to get a new population of 100 ducks. Click the Start button. The ducks in your pond will swim around for 360 timesteps (= one generation). Some of them may get eaten by gators. Repeat this procedure several times, each time assigning a different color for A1A1 ducks.
- In general terms, how does a duck’s color influence its chances of survival? Why?
Now define a complete genetic model for how genotype influences color. Use the Duck Phenotypes popup menus to pick colors for each of the three genotypes. Set up a genetic model in which each of the genotypes has a different color, and heterozygotes have a color intermediate between each of the two homozygous phenotypes.
Make sure the Measure Fitness tab is showing, and that you are measuring the fitness of A1A1 ducks. Click the New Ducks button, then the Start button. Once the ducks are finished swimming around, note that a label to the right of the duck pond reports the exact number of survivors (out of the 100 ducks you started with.)
Record the number of survivors, then repeat for the other two genotypes. Be sure to click the New Ducks button before each run, to make sure you start with 100 ducks each time:
Number of surviving A1A1 ducks:
Number of surviving A1A2 ducks:
Number of surviving A2A2 ducks:
Are your results consistent with the answer you gave to Question 6?
This graph shows my results, using the default genetic model and the default number of gators:
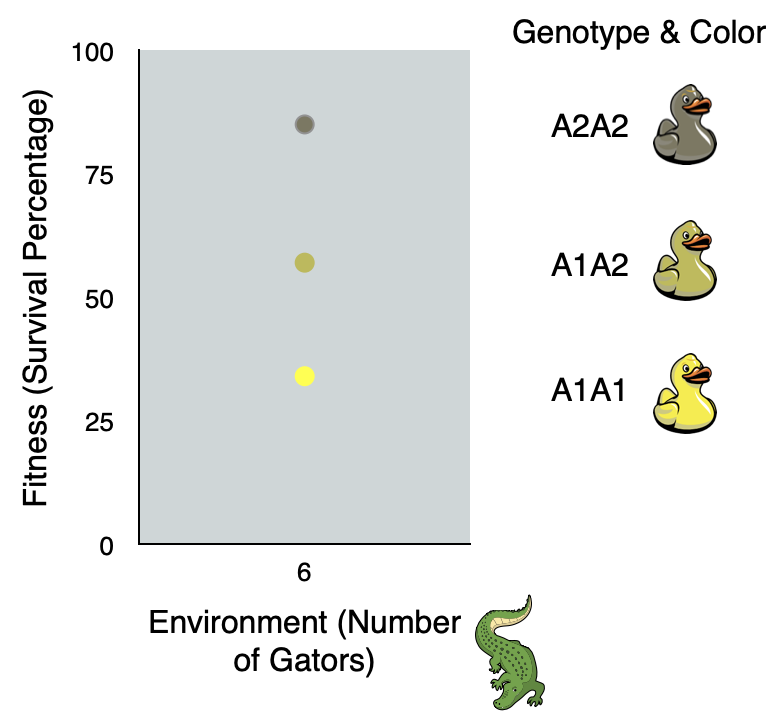
(Note that if you repeat this experiment yourself with the same settings, your numbers may be a bit different than mine. Why?)
These results demonstrate genetic variation for survival in our virtual duck population.