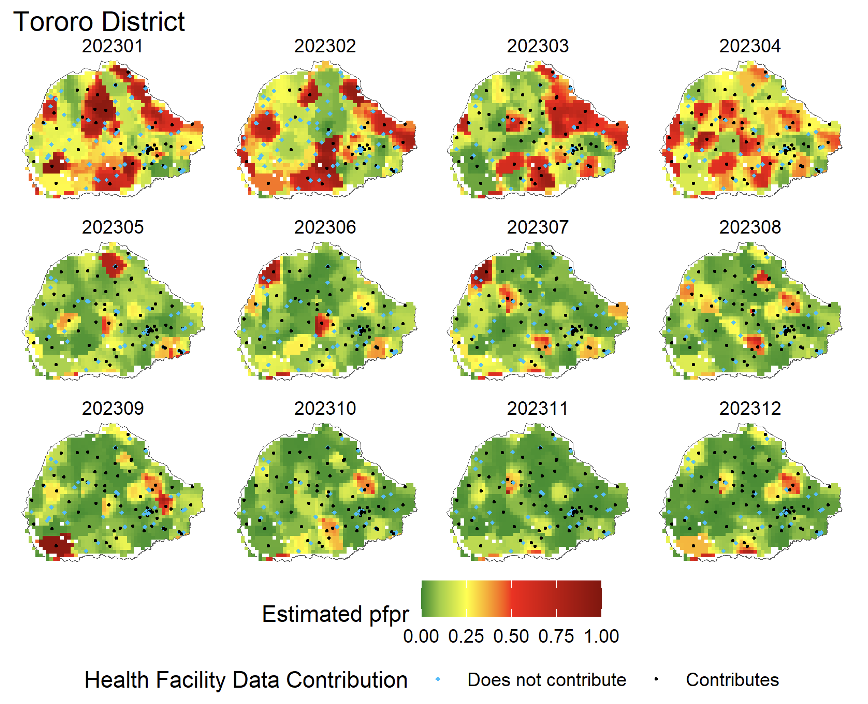
Mapping Prevalence
Mapping Malaria in Uganda
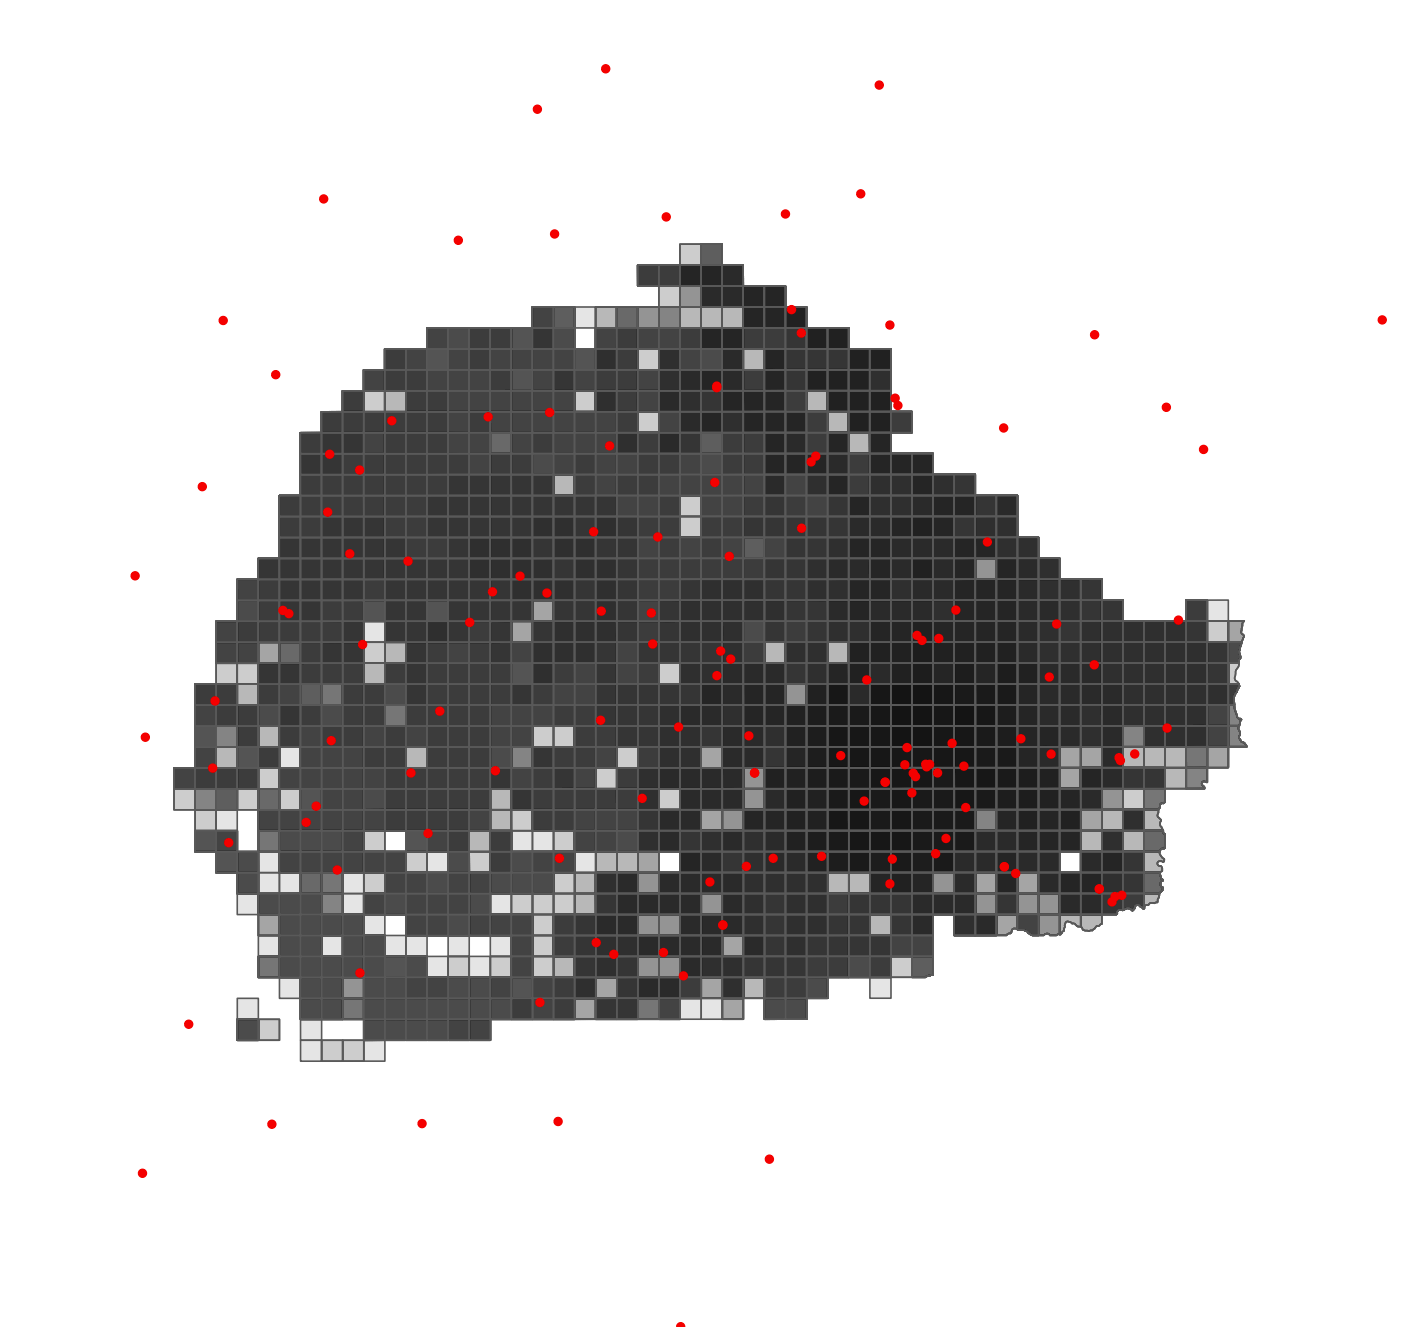
We have developed algorithms to map virtually any quantity as a raster, or aggregated to sub-county, district, or region. The algorithm uses MAP’s 1 km \(\times\) 1 km raster and many MAP products.
To develop high resolution maps of malaria quatities using the facility data, we compute the value of a metric at pixel level by taking a weighted sum of the nearby facilities.
The weights are generated by a spatial kernel, a flexible function with a shape that assigns weights by distance. The following is a map of the PfPR generated using this algorithm: