Cross Walking
Test Positivity at Clinics and Malaria Prevalence
TPR \(\rightarrow\) PR
Facility data provide the most abundant source of information about malaria in Uganda, but since the data are collected passively (ie, without an active study design) – some sort of algorithm is needed to relate facility data to malaria metrics that have been collected with an active study design (eg, a randomized cluster survey).
In the following, we developed an algorithm to predict malaria prevalence around a health facility using the test positivity rates from a nearby facility. We pooled data from both the malaria indicator survey 2018 and the demographic housing survey 2016, generating district-level monthly observed PfPR estimates. We also retrieved health management information system data from the DHIS2 tool, specifically district-level confirmed malaria, total malaria tested, and inpatient malaria. We defined the test positivity rate (TPR), as the proportion of those tested for malaria who were confirmed with malaria, and the proportion of severe malaria as the number of inpatient malaria divided by all confirmed malaria. We then generated a district-level paired PfPR and TPR data, as our training data.
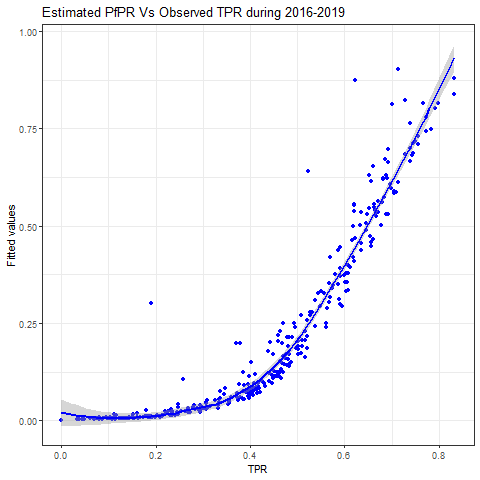
Of note, all district level TPR which was 0 was replaced with the minimum district level TPR (obtained when 0 values were excluded within each district) and similarly, TPR of 1.0 or more were replaced with maximum district level TPR (obtained when 1.0 or more values were excluded within each district) from 2016 to 2019.
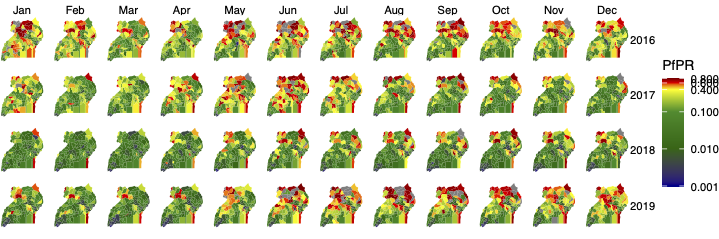
This TPR \(\rightarrow\) PR transformation makes it possible to develop monthly maps of malaria prevalence at various resolutions. The algorithm
Code
The code runs a generalized linear model that can be updated whenever the
\[ x = \beta \; T+ \psi X + \gamma Z + \epsilon \] where the terms are:
- \(x\) - malaria prevalence
- \(T\) - test positivity rate
- \(\beta\) - fixed-effects regression coefficient for test positivity rate
- \(X\) - matrix of covariates
- \(\psi\) - vector of fixed-effects regression coefficients of all the covariates
- \(Z\) - design matrix for the random effects for district level nested into region
- \(\gamma\) - random effects
- \(\epsilon\) – error term, residuals, that part of PfPR that is not explained by the model that includes TPR, proportion of severe malaria, and random component of the district nested into the region
Versions
Current
Previous
Dev
Describe known concerns and plans for updating.
Visualization