 | ||||||
| Surviving Fraction |
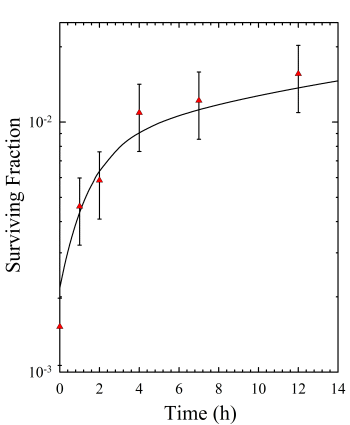
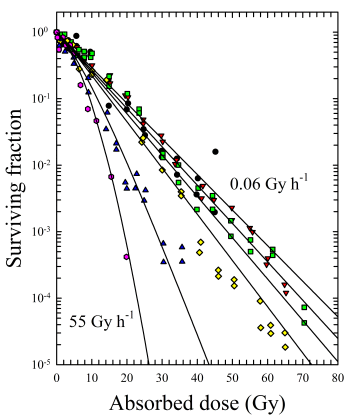
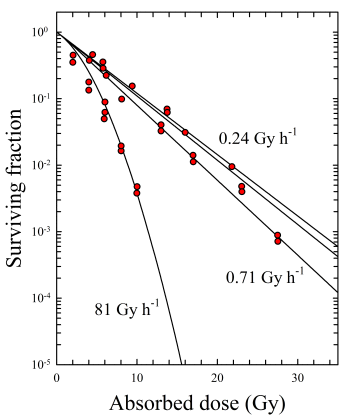
| Figures 1 through 5 show comparisons of measured and RMR or TLK predicted survival data as a function of dose and dose rate. For CHO 10B2 cells (Figure 1b), survival data for a 16 Gy (8 Gy + 8 Gy) split-dose irradiation scheme are also available. For each type of cell, a single RMR or TLK model parameter set does an adequate job at explaining the observed cell survival data. | |
Figure 1a. Survival of CHO 10B2 cells as a function of dose and dose rate | Figure 1b. Surival of CHO 10B2 cells after a split-dose radiation exposure (click on figure to enlarge)  |
| Figure 2. Survival of C3H 10T1/2 cells as a function of dose and dose rate (click on figure to enlarge)  | Figure 3. Survival of AG1522 normal human fibroblast cells as a function of dose and dose rate (click on figure to enlarge)  |
Figure 4. Survival of RT112 human bladder carcinoma cells as a function of dose and dose rate | Figure 5. Survival of HX 118 human tumor cells as a function of dose and dose rate |
| School of Health Sciences Purdue University Disclaimer | Last updated: 10 June, 2011 |