ETP Review work

ETP review work

A miscellaneous collection of figures made while writing the review of East Pacific circulation (Jan-Mar 2003).
  1. SST
    1. Statistics of Reynolds SST (weekly, 1981-2001):
      (Also see 8e below)
      1. Standard deviation of weekly SST
      2. Standard deviation of annual SST
      3. Ratio of annual to total SST RMS
      4. Standard deviation of non-annual SST
      5. Standard deviation of interannual SST
      6. TMI SST: Mean (3-yr)    Mean (5-yr)   RMS (3-yr)   RMS (Overlay mean)
           RMS in bands:  Unfiltered   Annual cycle   Interannual   High-pass
           Same thing from Reynolds:  Unfiltered   Annual cycle   Interannual   High-pass
    2. Climatological SST:
      1. Bimonthly SST:  Values       Demeaned
      2. Harmonics:  1 cpy      2 cpy
      3. SST annual RMS, scaled by zonal average RMS: Tropical strip   ETP   Overlay mean   
    3. Interannual SST maps (20 years of SST by month):
                                              1982-91                           1992-2001
           Large area:             Jan   Apr   Jul   Oct             Jan   Apr   Jul   Oct
           Detail:                    Jan   Apr   Jul   Oct             Jan   Apr   Jul   Oct
           Demeaned:             Jan   Apr   Jul   Oct             Jan   Apr   Jul   Oct
    4. Correlations with center of Costa Rica Dome (Interannual variability):
      1. Time series: Along 89.5°W: Values   Anomalies   Lowpass   Along 9°N: 3 MRM   Lowpass
      2. Correlations with 9°N, 89.5°W: Lowpass   Highpass   Highpass TMI
              Correlations with Eq, 95°W: SWCA region   To 140°W   100 years from Kaplan SST   Topex SL   SST annual cycle
              Check small correlation Eq-15°N (time series): Lowpass anomalies   Scaled anomalies         Eq vs 15°N
      3. CR Dome Jan-Feb SST profiles: Anomalies from climatology   Values   Checkplot
              Contoured Januarys: Along 9°N   Along 90°W   Anomalies
      4. Kaplan SSTA time series
    5. Other interannual figures:
      1. BMRC Z20 at CR Dome for OND seasons 1980-2002
      2. Topex variance in frequency bands     Variance fractions
      3. Reynolds and TOPEX interannual: RMS   Correlations
      4. Topex anomaly currents:
             Meridional sections: 120°W   110°W   100°W   90°W
      5. Topex+XBT anomaly maps: 1997   1998
      6. Topex movie (9 Mb)

  2. ADCP sections:
    1. Shipboard ADCP cruise maps:   All 10 cruises      Detail for Eq-crossings E of the Galapagos
    2. Zonal current sections from above cruises:   P19 (86°W)      P19 (raw)      EP692: 0.9°S-0.8°N, 90°W      Ironex2: 2°S-1°N, 89°W
    3. N.B. Palmer section near 86W (Click contour for section)
    4. Topography around the Galapagos:   Broad-scale       Detail
    5. Zonal pressure gradient along the Equator:  
      1. Thermostad topography:   Z14       Z20       Thickess       Mean T(Eq,z)
      2. DH and Integrated P       Balance P_x = Tau-x

  3. ERS/Quikscat winds and Sverdrup transport:
    1. Mean vectors
    2. Curl(Tau)      Overlay Tau-x < -.02
    3. Sverdrup streamfunction       Overlay transport vectors       Extend to 30°S-30°N
    4. Quikscat variance ellipses (annual cycle)
    5. Quikscat windspeed (2001-2002 from CERSAT):
      1. Mean   JFM   JAS   OND   
      2. Time series off Tehuantepec
    6. Angle of winds: Mean   Annual cycle along equator
    7. Paul's relief map (300Kb pdf)

  4. Drifter circulation:
    1. Mean velocity       Overlay magnitude       Streaklines
    2. Near-Eq velocity and count
    3. Comparisons: Johnson ADCP   G/C model
    4. Drifters in eastern Eq region:
      1. Drifters along Equator:  Vectors    u    v
      2. Drifters AMJ/OND seasons in east Eq region:  Counts    Vectors    u    v
    5. Drifter annual cycle
      1. Seasons (a la Wyrtki)       Overlay magnitude       Streaklines       Seasonal anomalies
      2. Along 110°W: Velocity   Overlay count   Compare G/C model
        Compare Johnson ADCP and GC: 110°W   95°W
      3. 4 average seasons: Simple averages   (Detail near Guerrero)   1 cpy harmonic   (Detail near Guerrero)   
    6. Drifter and geostrophics circulation   "Ekman" (u_d-u_g) and geostrophic surface circulation

    7. Estimates of Effective Beta: u_yy/beta   beta-u_yy   Fractional RW speed change: beta/(beta-u_yy)

  5. TAO ADCP at 0°,110°W:
    1. Values:  u   v   u(140°W)
    2. Annual cycles:  u   v   u(140°W)
    3. Anomalies:  u    u(140°W)

  6. Geostrophic circulation:
    1. Mean DH and u_g at the surface and at 100m
    2. Mean DH across the Pacific (AOML+K90)

  7. Annual cycle (also see drifters, and climatological SST above):
    1. Annual cycle RMS: Z20   SST
    2. Rossby wave model:
      1. (x,t) comparisons:  6.5°N, 10.5°N, 14.5°N, 18.5°N   4.5°N, 8.5°N, 12.5°N, 16.5°N
      2. RW model reconstruction: 6 bimonths   4 seasons
      3. Observed Z20 comparison: Obs alone (4 seasons)   Side-by-side comparison   Differences
              Curl and Ekman pumping: Curl and Ekman pumping   Compare Ekman pumping vs RW model solutions
              Total values: Model mean is Sverdrup h   Model mean is obs Z20 h
      4. Amp-phase comparison: Maps   Vectors   Difference   Quikscat winds
      5. Checking RW model parameters: 1-9-2.0 (original)   1-9-2.5   2-9-2.5   1-6-2.5   1-24-2.5   1-9-3.0   
              Quikscat winds 1-9-2.5
      6. RW model wind vs BC parts: 
        1. Harmonic amplitude and phase: Maps   Vectors
        2. 4 seasonal maps: BC and interior   Undemeaned   Velocity   Detail of CRCC   
        3. (Also see section 7.d below "Coastal BC based on tide gauge stations")
      7. RW and model Z20 RMS
    3. Wind harmonics: Taux   Tauy   Curl   Curl(Tau/f)   All 4 (vectors)
            4 seasonal maps of wind vectors and wind speed
            4 seasonal maps of wind vectors and curl near the Panama Bight
    4. Coastal BC based on tide gauge stations:
      1. 1 cpy Harmonics of sea level:
        1. UHSLC tide gauges:  Station locations    Variance fraction    Amplitude    Phase
        2. TOPEX/JASON:  Sampled locations    Variance fraction    Amplitude    Phase
             Topex data itself: 30°S-30°N   8°N-30°N (Compare Z20 plot in 11.3.ii below)
             Topex interannual data: Data   Interannual anomalies
        3. TOPEX and Tide Gauge overlays:  Variance fraction    Amplitude    Phase
      2. Account for SL phase by Ekman upwelling?:
        1. Alongshore and offshore wind components: Mean   Annual cycle
        2. Alongshore and offshore Ekman transport   Annual cycle
        3. 1 cpy harmonic: Offshore winds    Alongshore winds
    5. 4 seasons of DH and Ug
         Analogous figure from K90   Extend to 180°   Anomalies

  8. Some figures made while preparing for the EPIC review talk:
    1. Salinity maps from Levitus: Surface   100m   250m   
    2. Mountain-gap winds at the jet exit regions: Tehuantepec   Papagayo
    3. Mean depth of 14°C: AOML XBT   K90 XBT
    4. Winds along the coast of Peru:
            Total
            Annual cycle
            Interannual
            Average 15°S-5°S   Tauy only
            Tauy and XBT temperature annual cycle   Compare CR Dome   Both together   Add 0°,95°W
    5. Reynolds SST along the Peru coast: (Also see 1.1 above)
            Maps: Mean   RMS   Annual cycle RMS   Non-annual RMS
            Sections along Eq and coast: Anomalies   Values   Detail near coast   
    6. Peru coast upwelling in the G/C model
    7. Circulation below the thermocline   (Add 14°C depth)
    8. pdf figures for Keynote: ERS curl and vectors   Quikscat curl and vector winds   Ekman currents (Quikscat yr1)   DH and u_g   Ekman and pseudo-Ekman currents (u_d-u_g)   Pseudo-Ekman and u_g   Circulation below thermocline
            And some gif figures: Ekman currents   K90 DH and ug   (Bigger)   (Even bigger)
    9. Reynolds and TOPEX correlations with 0°,95°W (update of Fig 10)

  9. SST and OLR (Why does the ITCZ dip south?)
    1. Mean OLR and SST
    2. Annual cycle RMS: OLR   SST
    3. Annual cycle along 100°W: Values   Anomalies

  10. Figures with Shang-Ping:
    1. Mean DH   Finer contour levels
    2. Mean T along 8.5°N   Levitus T and S along 8.5°N
    3. V off Tehuantepec in frequency bands with variance
    4. (u,v) along 95°W. Daily vs monthly:  2000   2001   2002   
    5. Variance ellipses of Quikscat wind

  11. Figures made while revising the paper:

    1. Checking the CRCC:
      1. Sections extending SW from Guerrero:
        1. A section extending SW from Guerrero (shows map)   Seasonal cycle
        2. Seasonal cycles of u_g at various depths: 0m   50m   100m   200m   300m   
      2. Compare Shipdrift and SVP drifters:
        (Labels may be wrong. Pretty sure the drifter Gaussian mapping had scales 2°lon x 1° lat x 2 months)
        1. Fig 4 (Drifter circulation) from ETP review   Analogous figure from shipdrift   Shipdrift/2
        2. Overlay
        3. Difference: Complete   Every 5°longitude   Shipdrift/2   Magnitude
        4. Shipdrift, drifter and u_g
        5. Shipdrift climatology   Detail of CRCC   Compare drifters   Zonal component

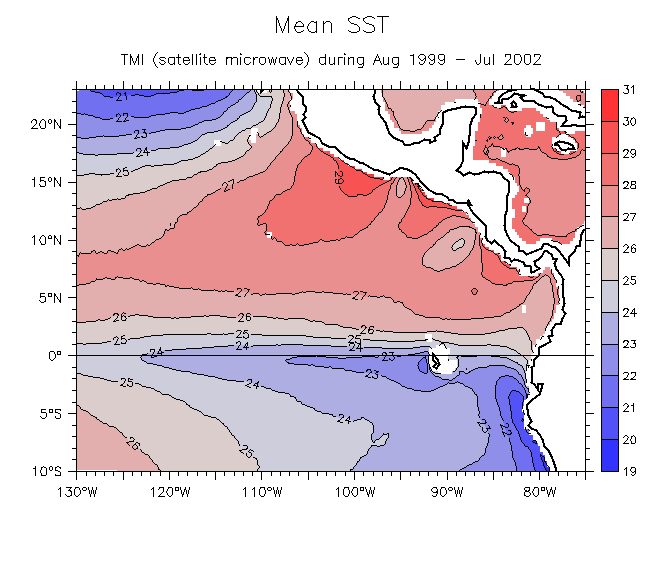
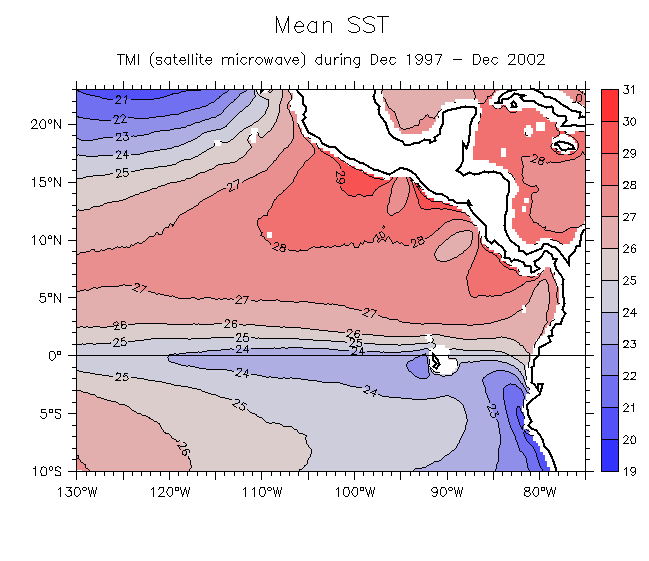
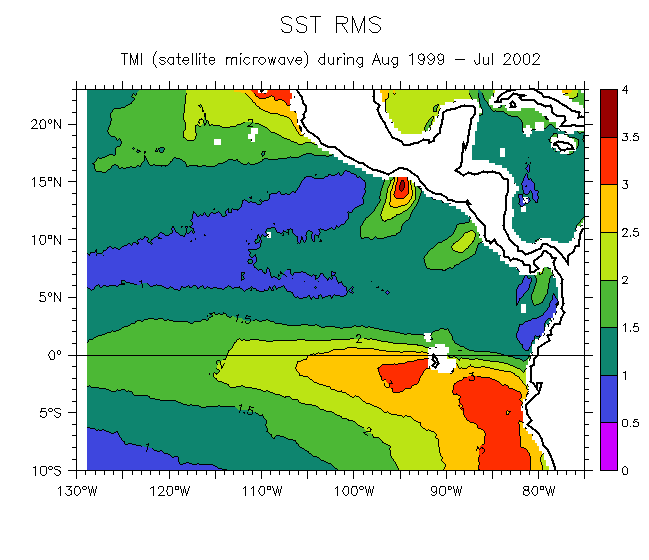
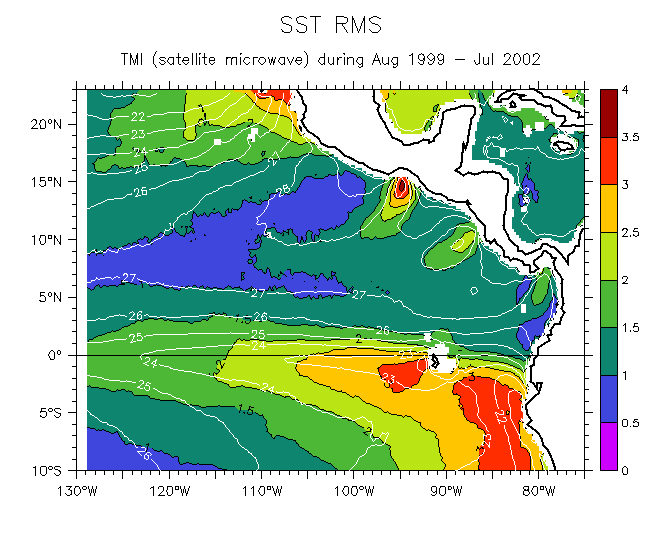
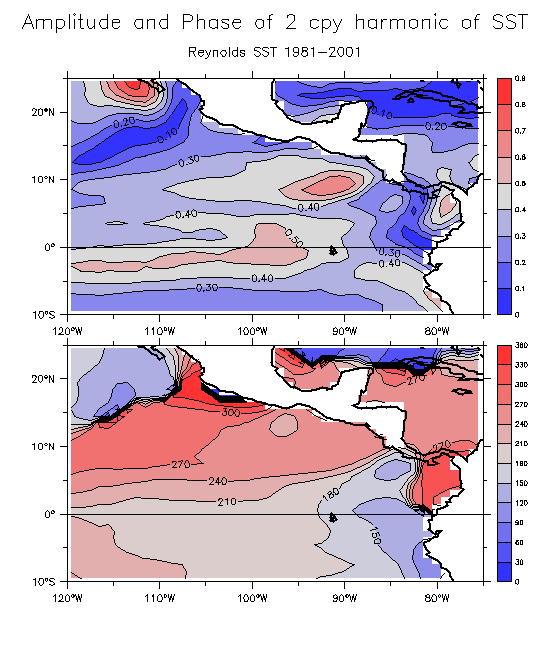
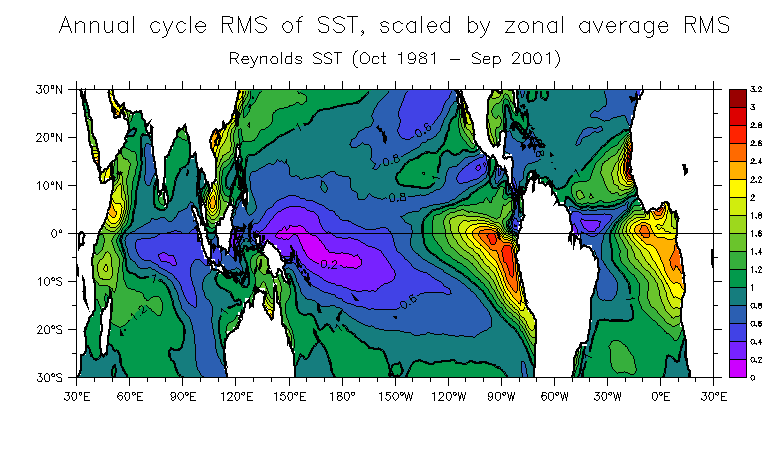
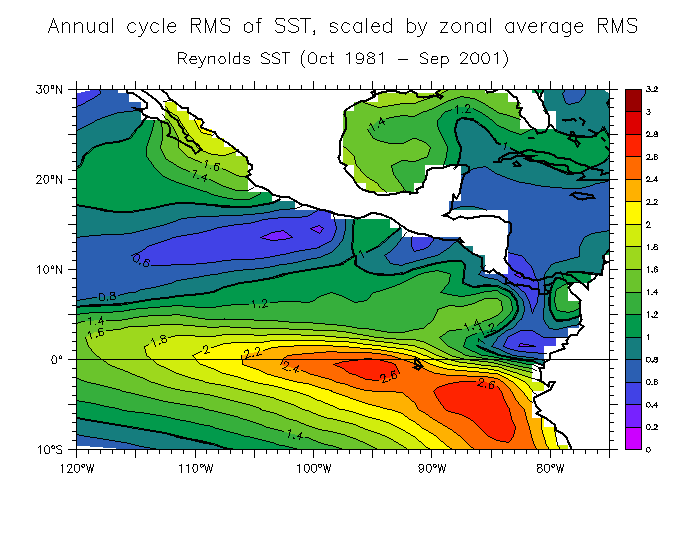
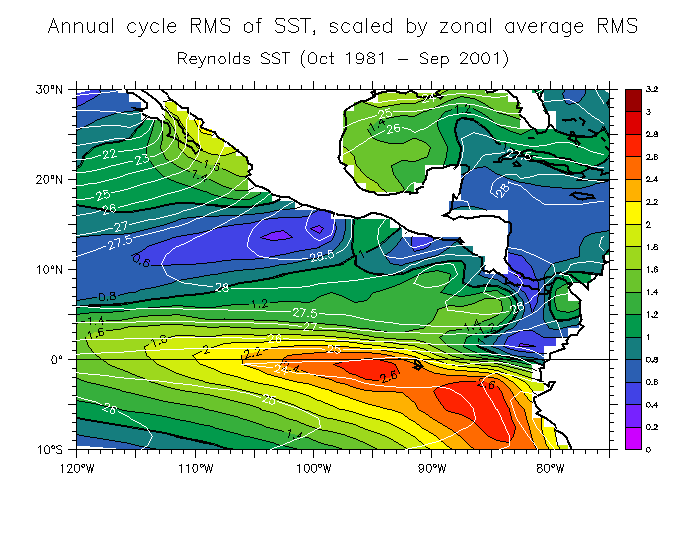
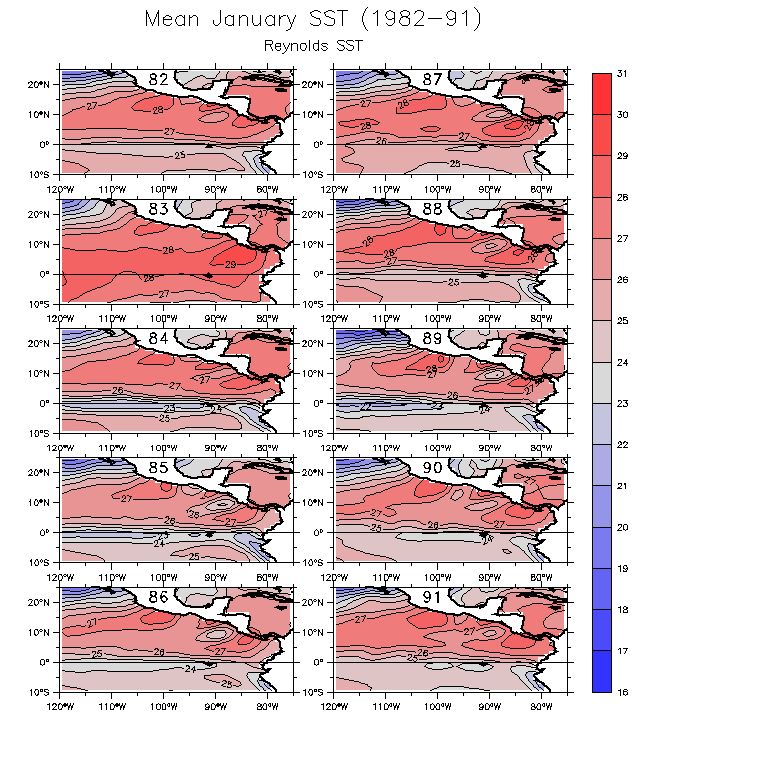
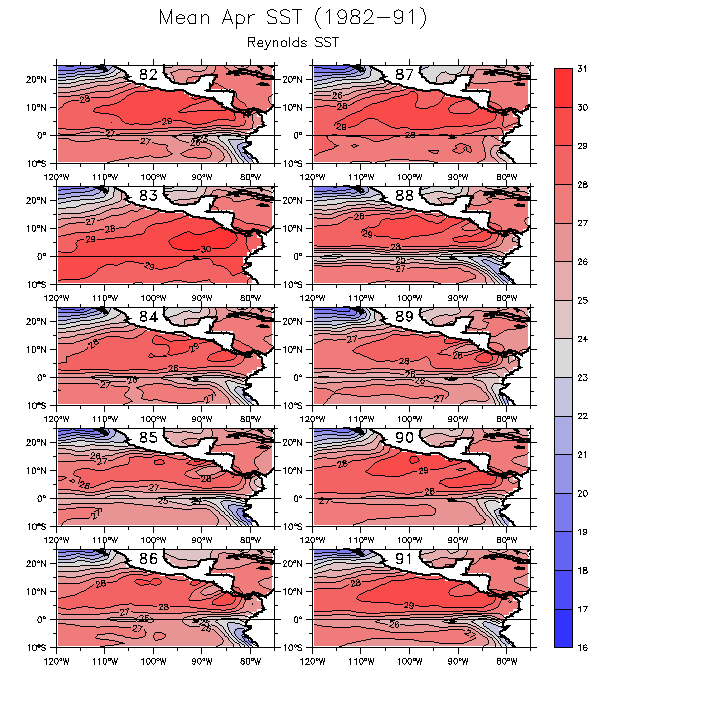
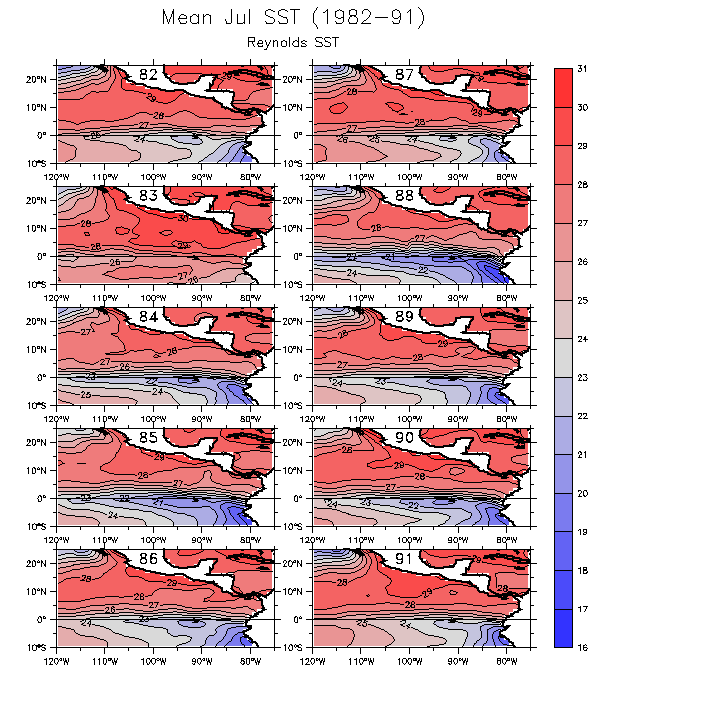
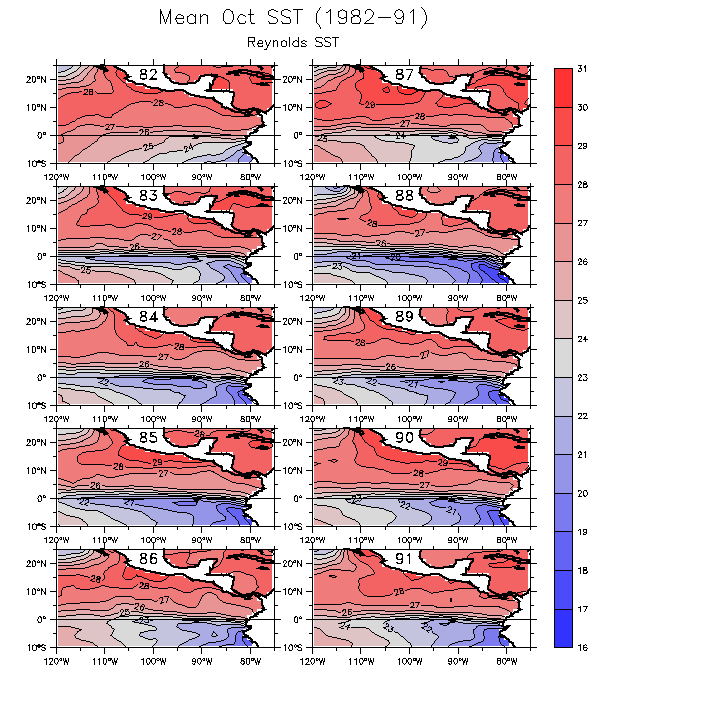
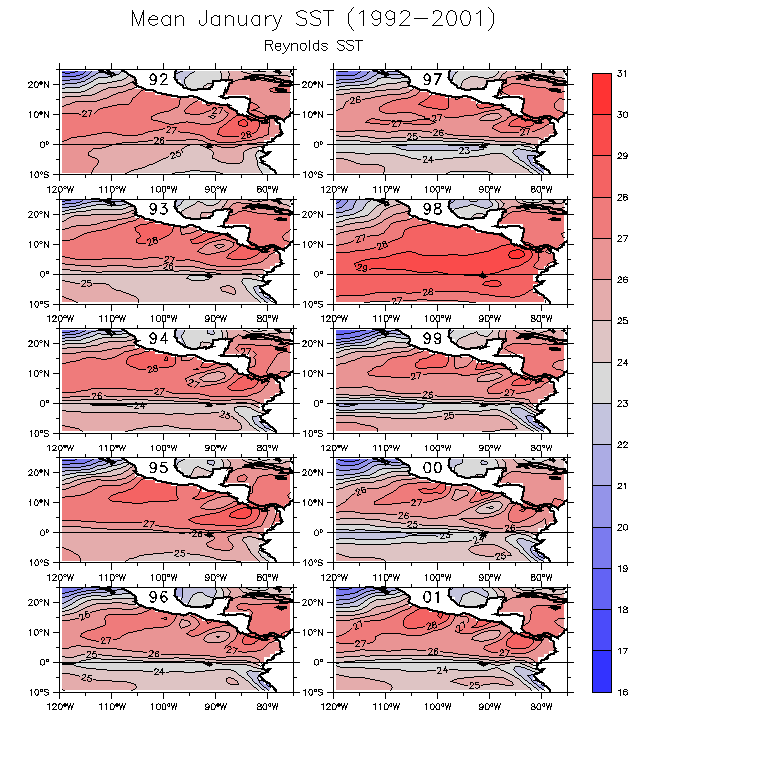
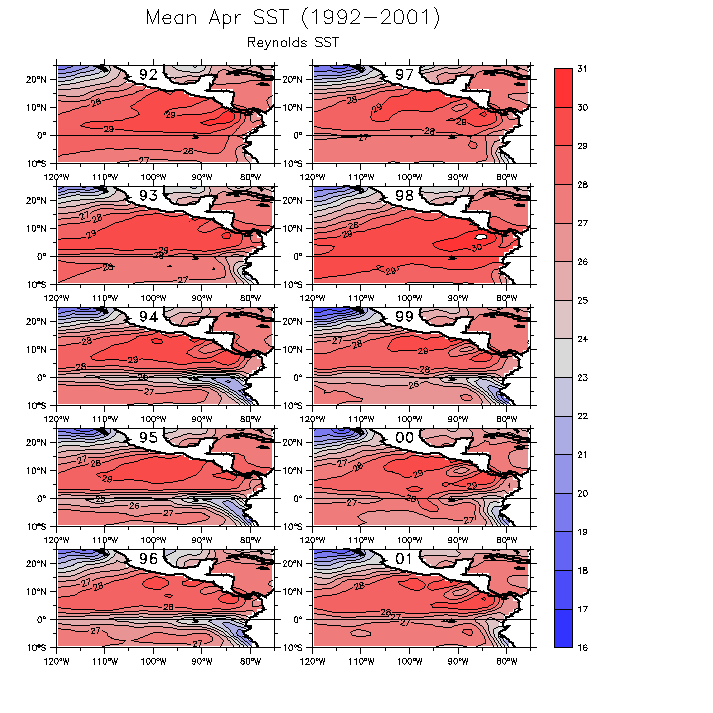
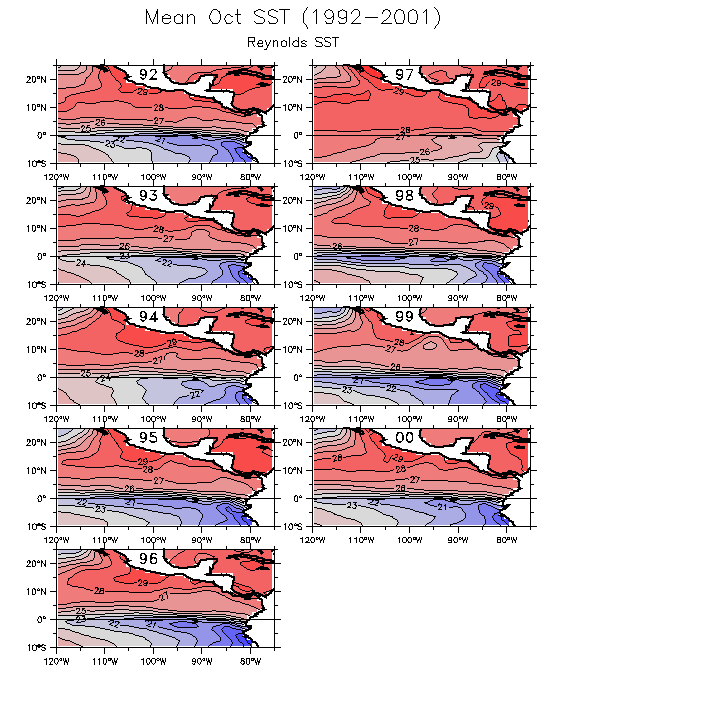
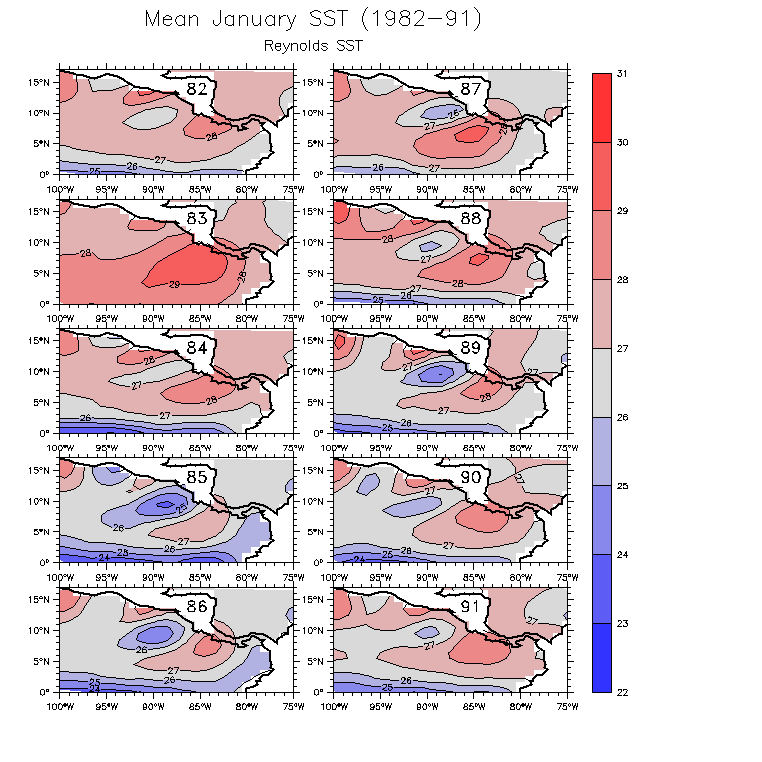
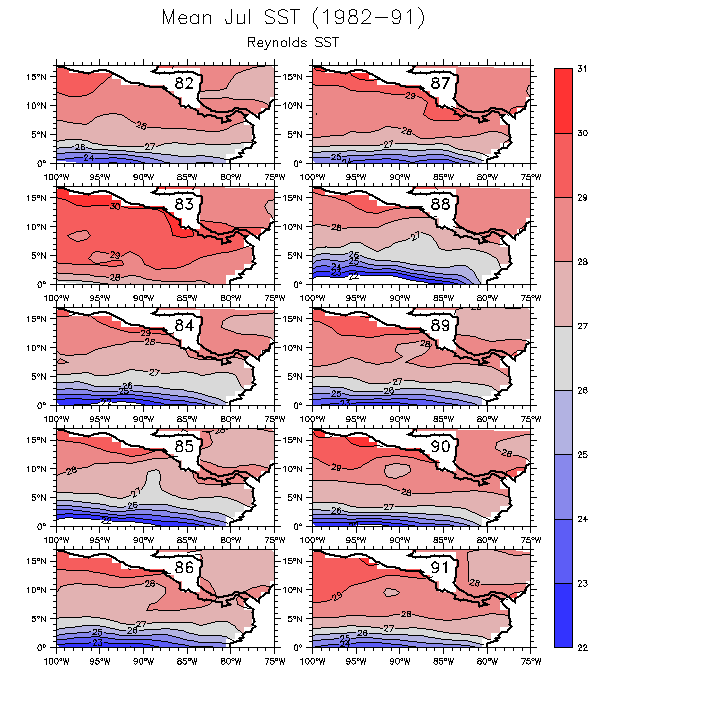
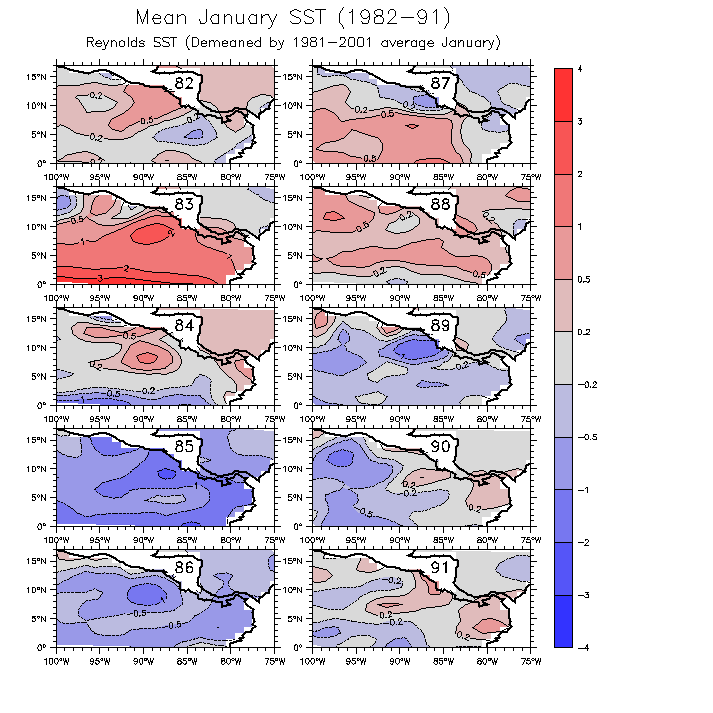
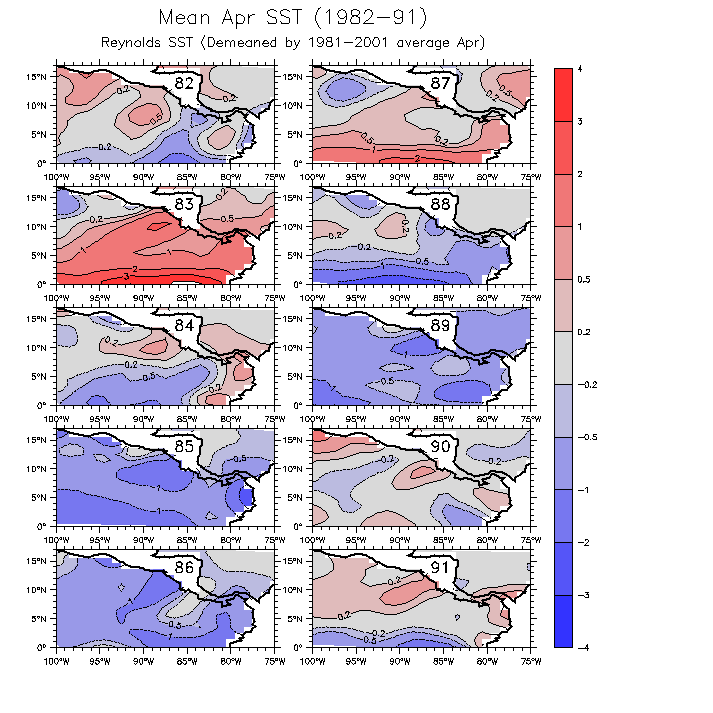
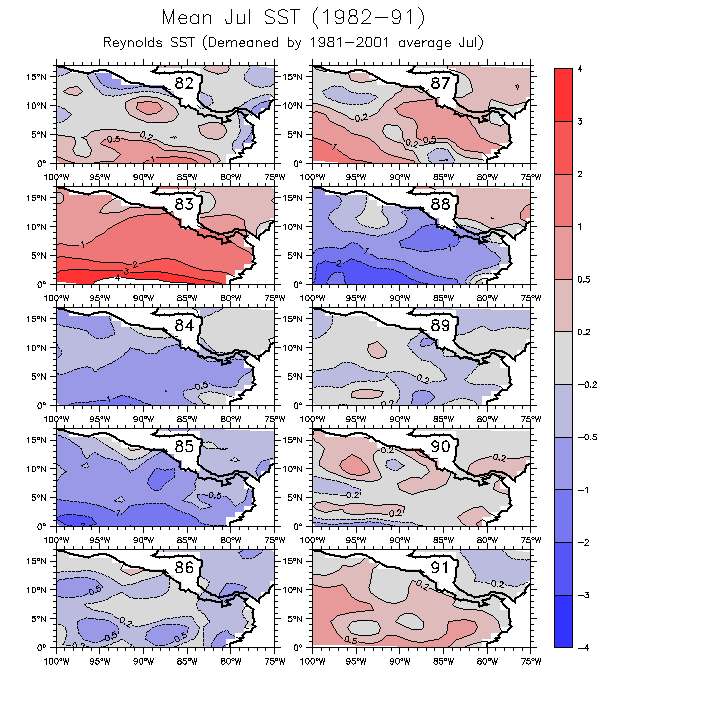
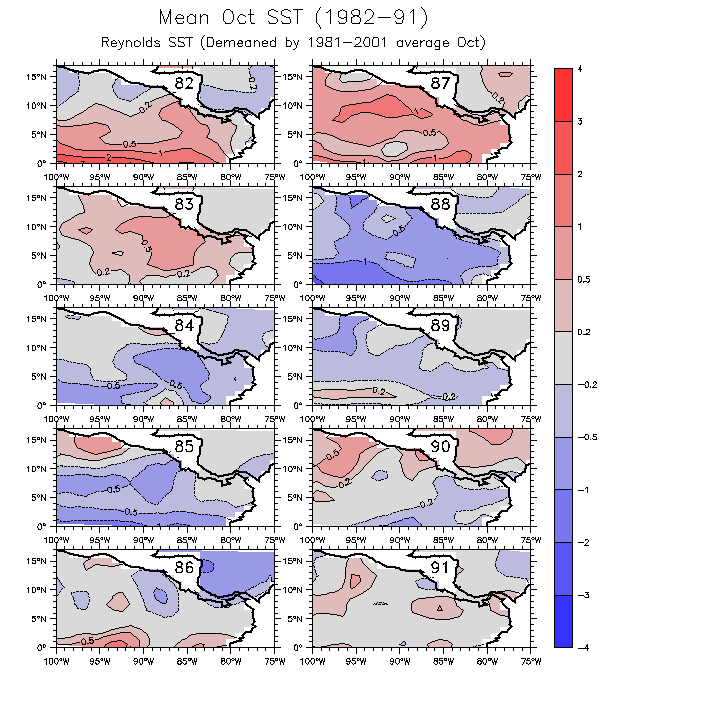
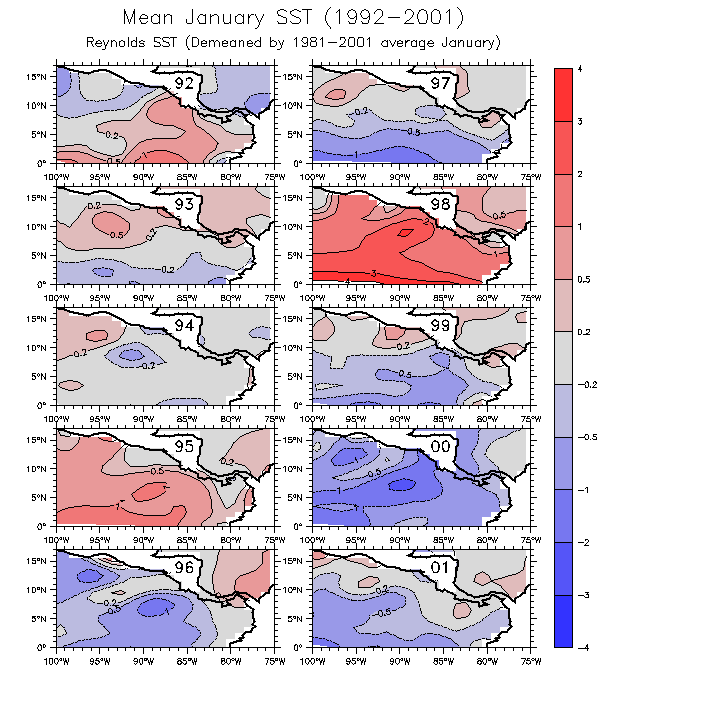
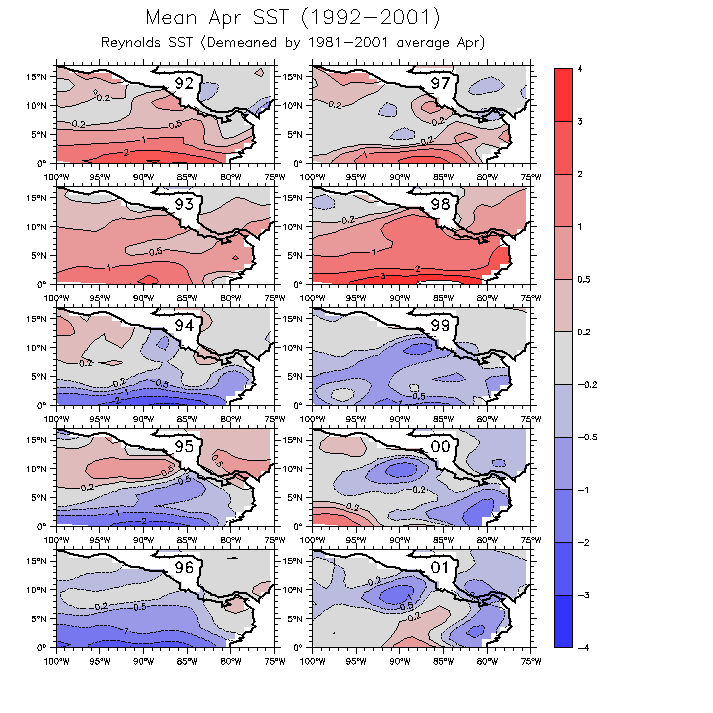
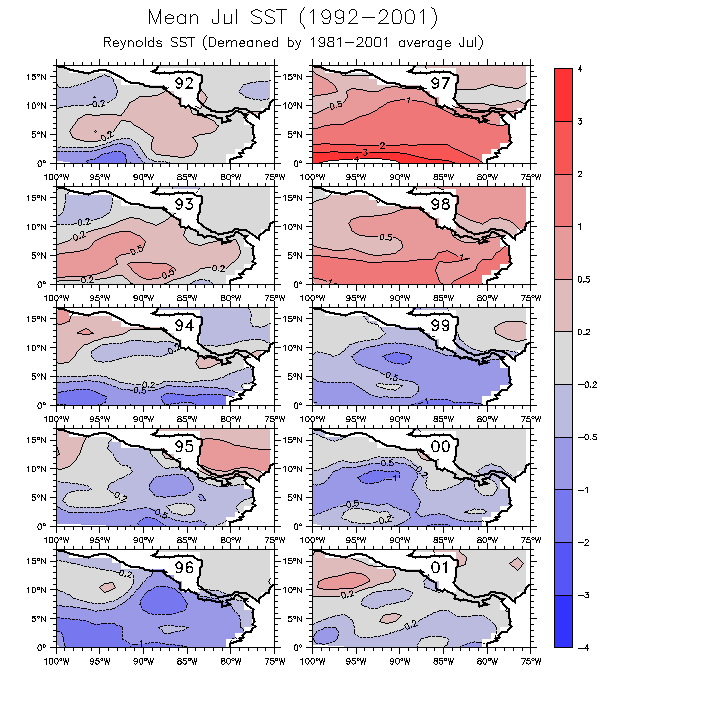
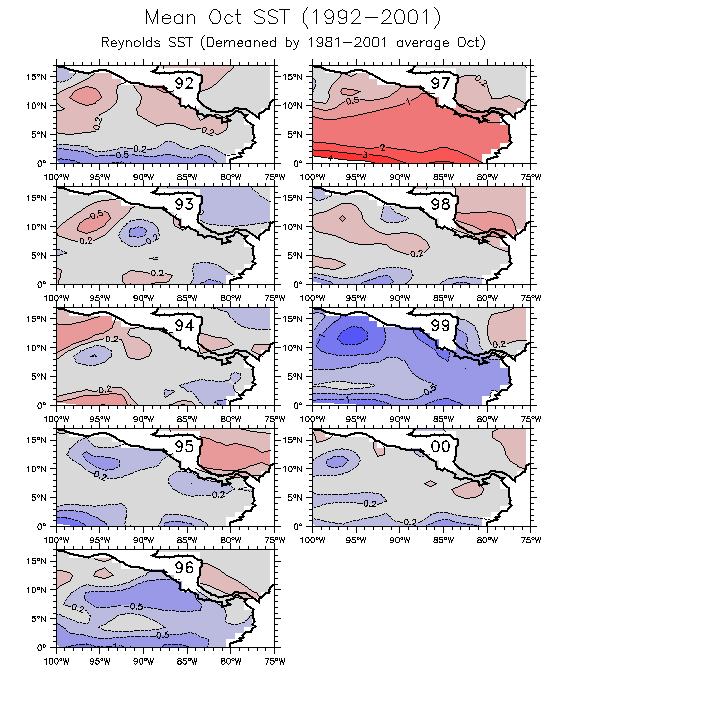
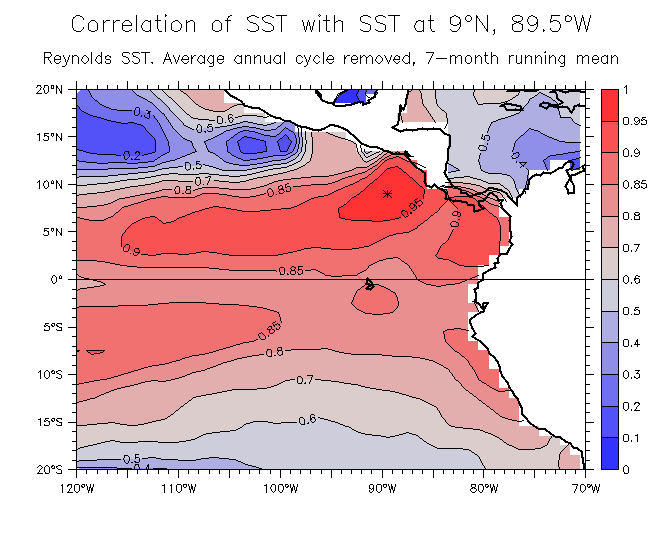
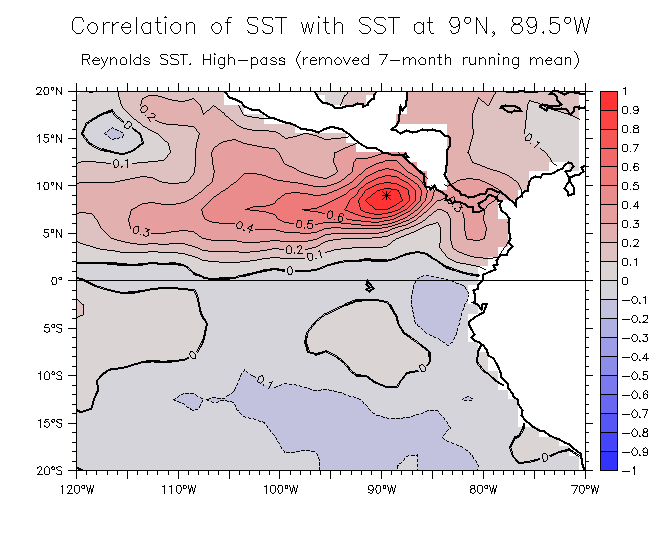
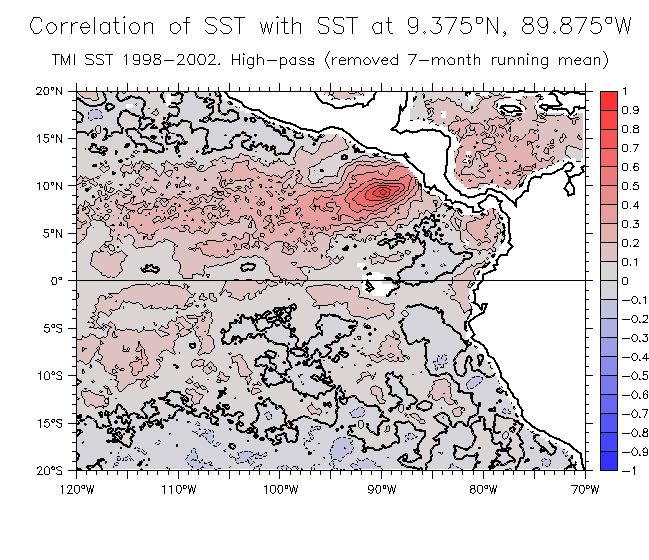
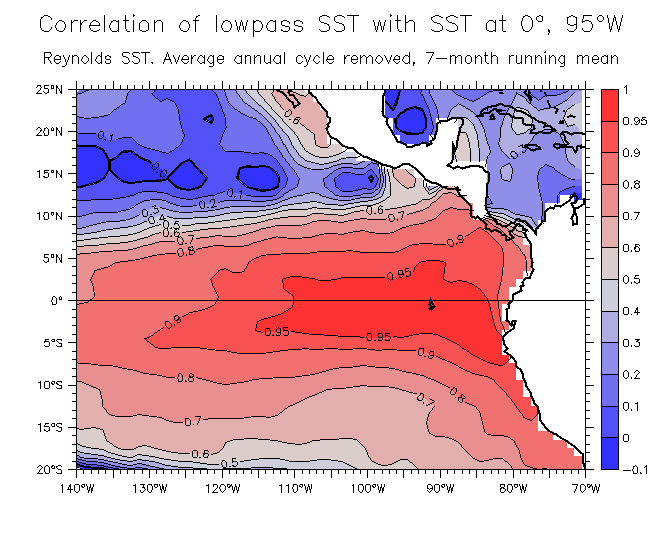
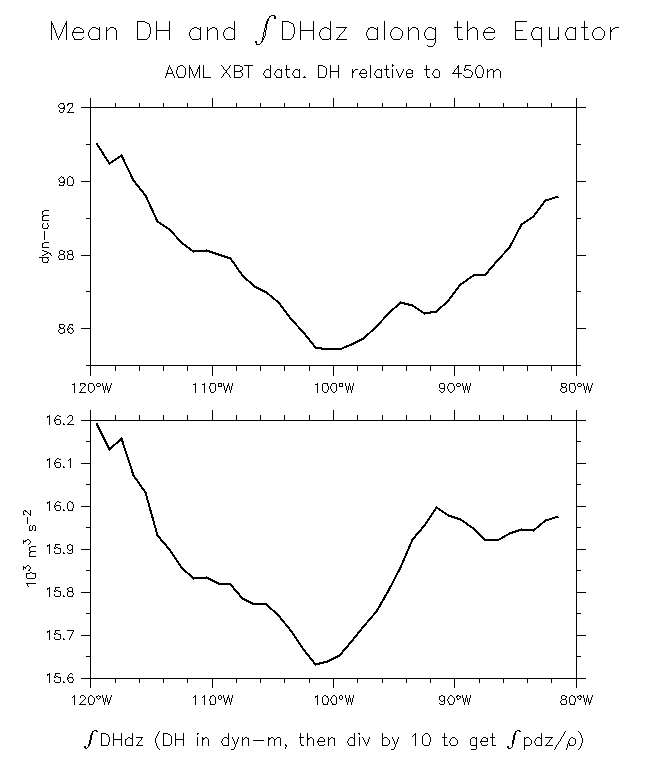
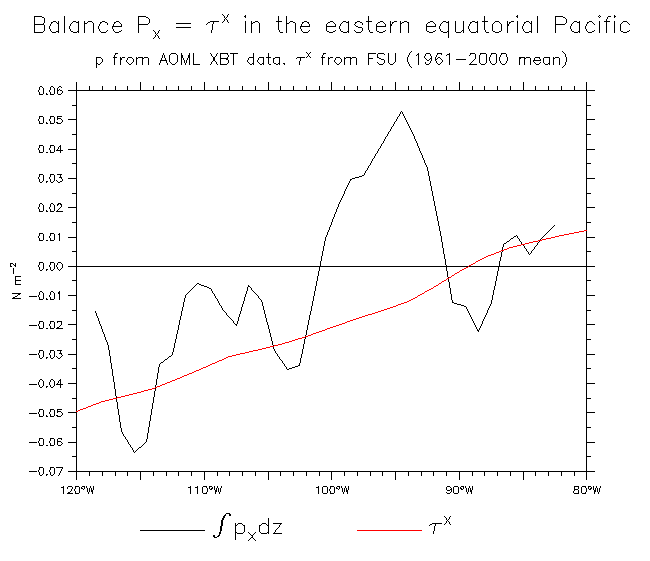
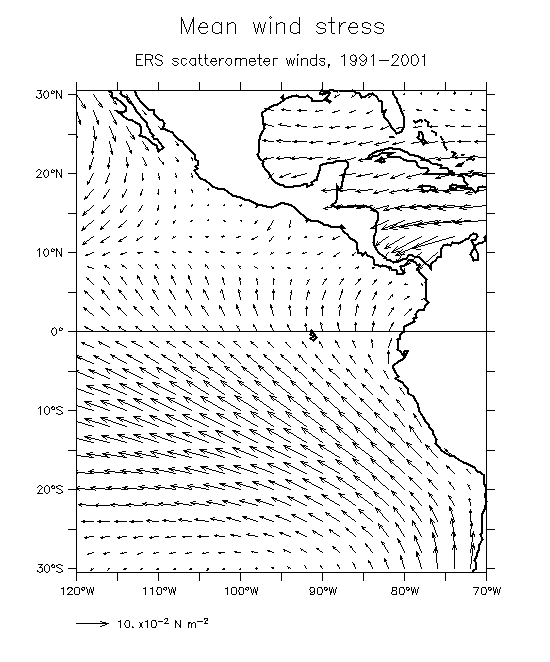
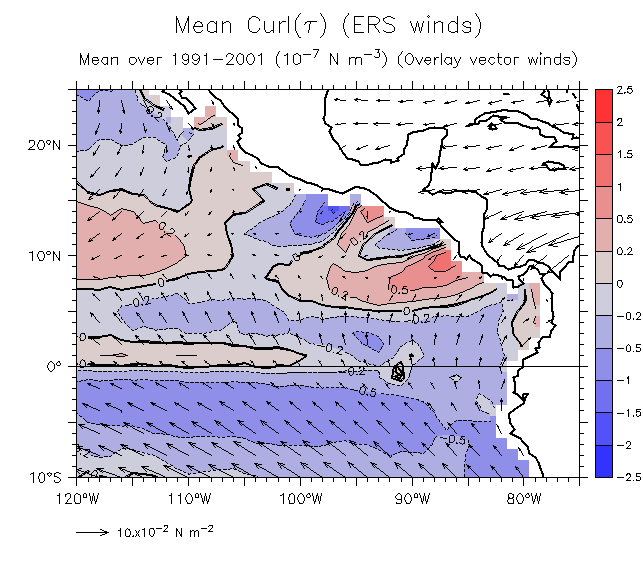
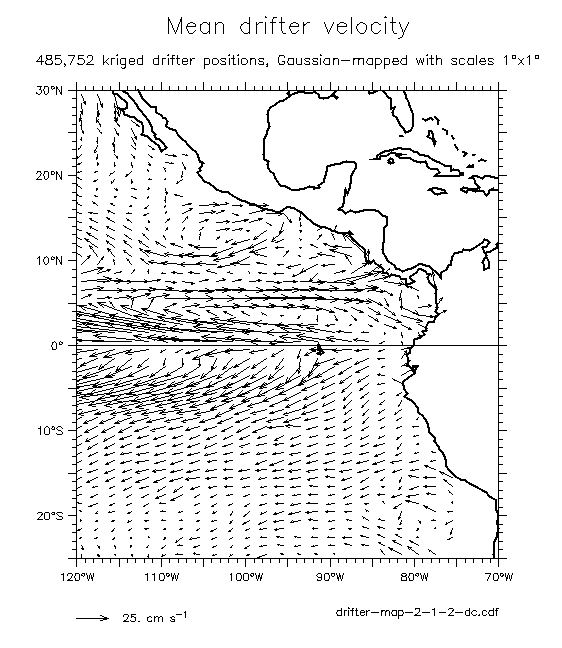
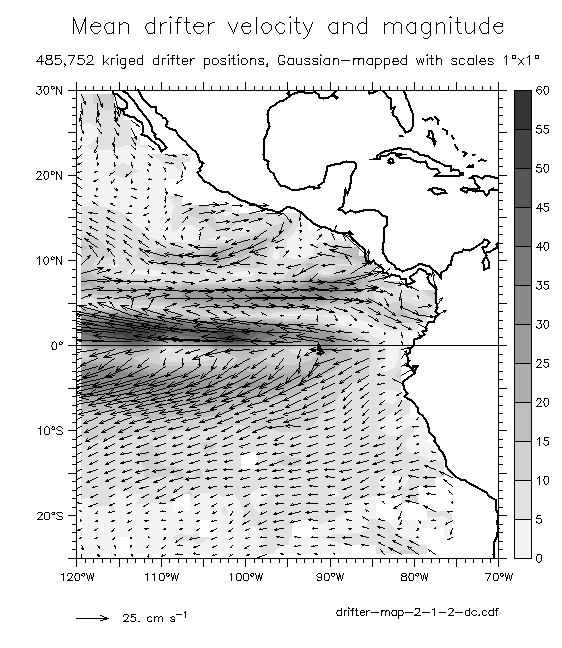
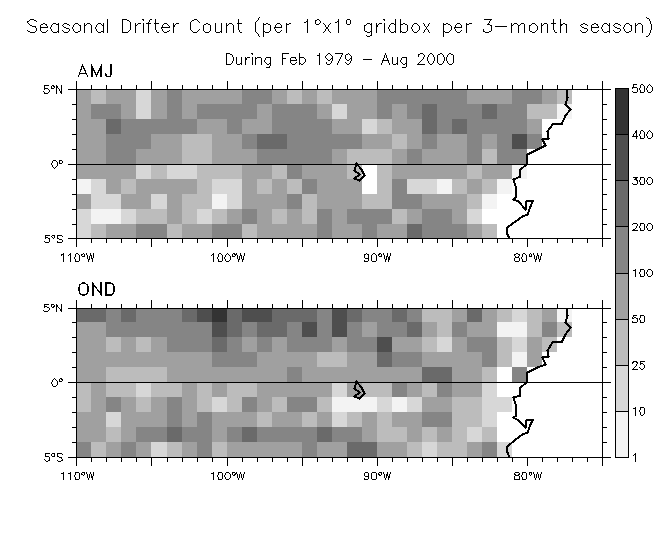
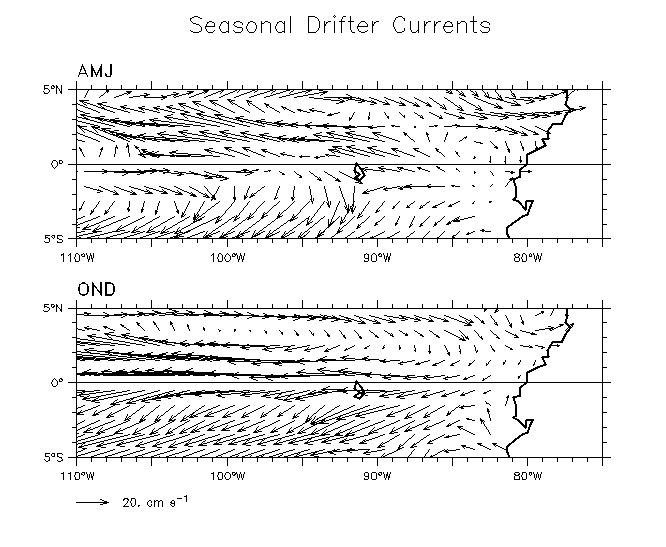
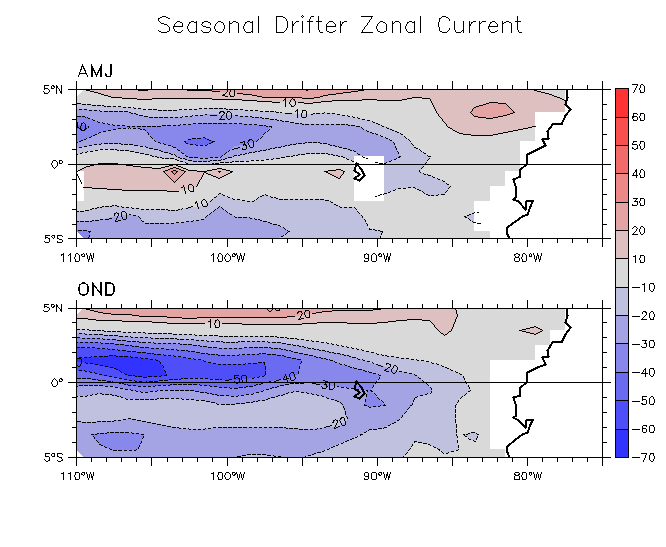
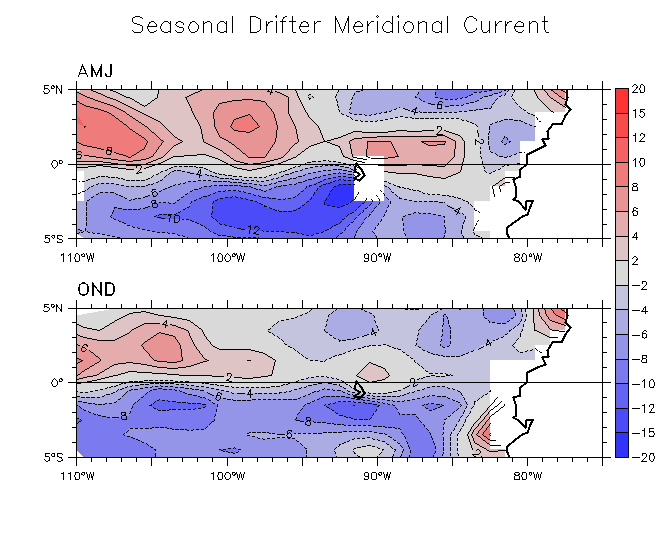
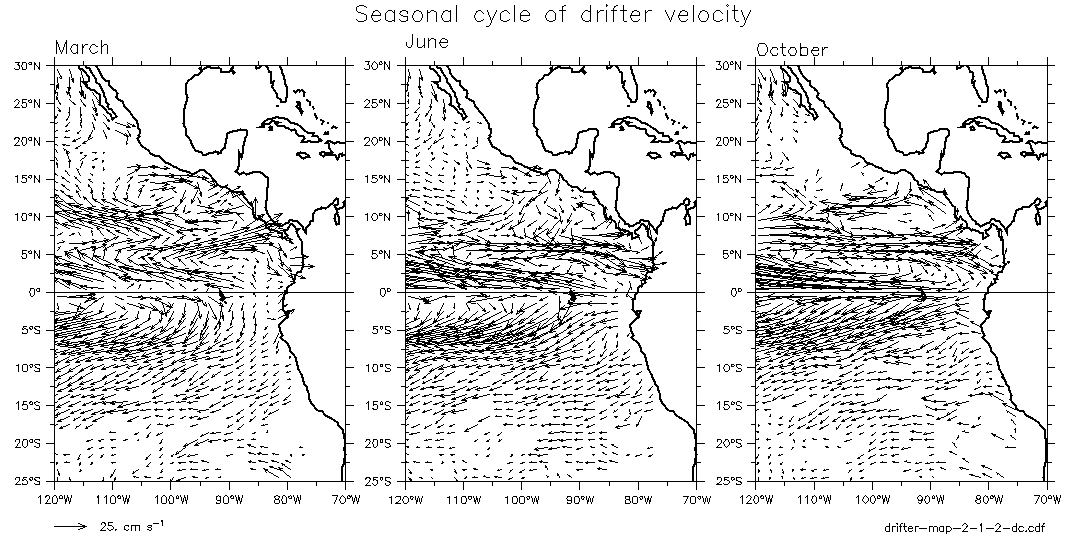
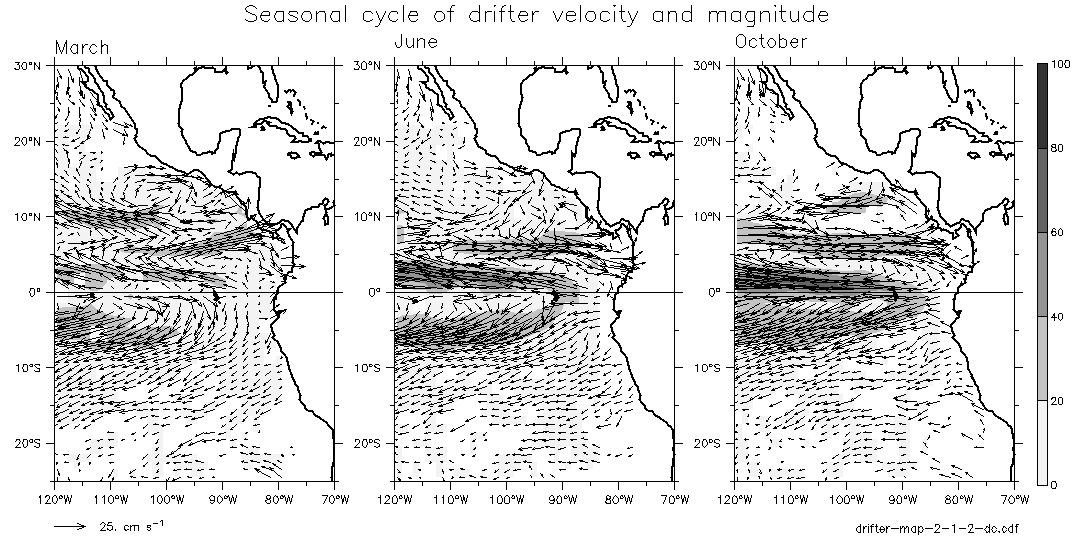
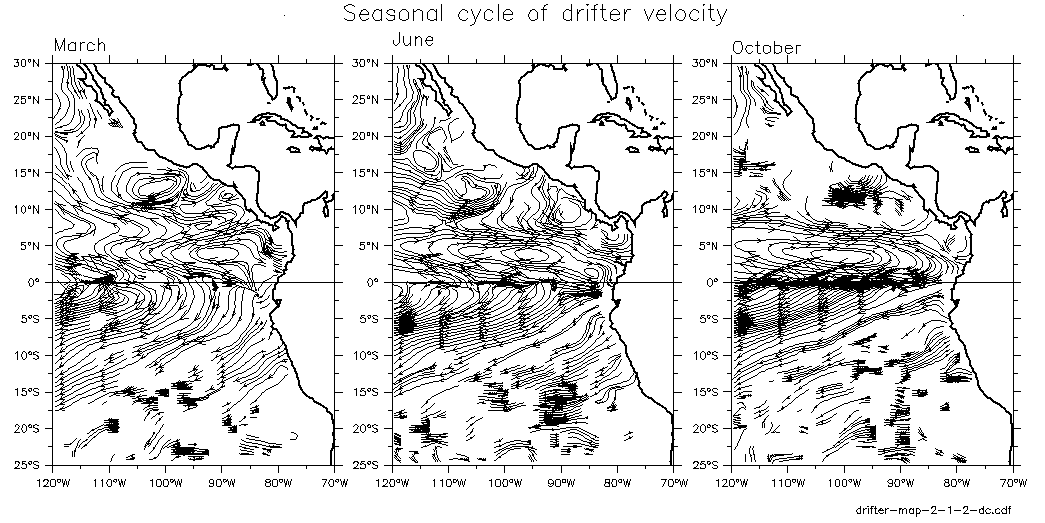
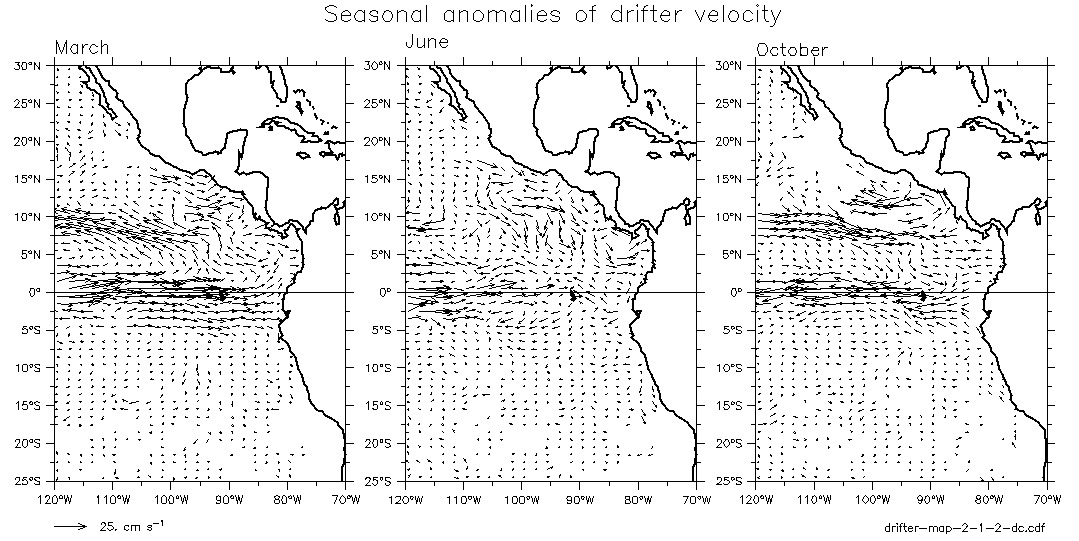
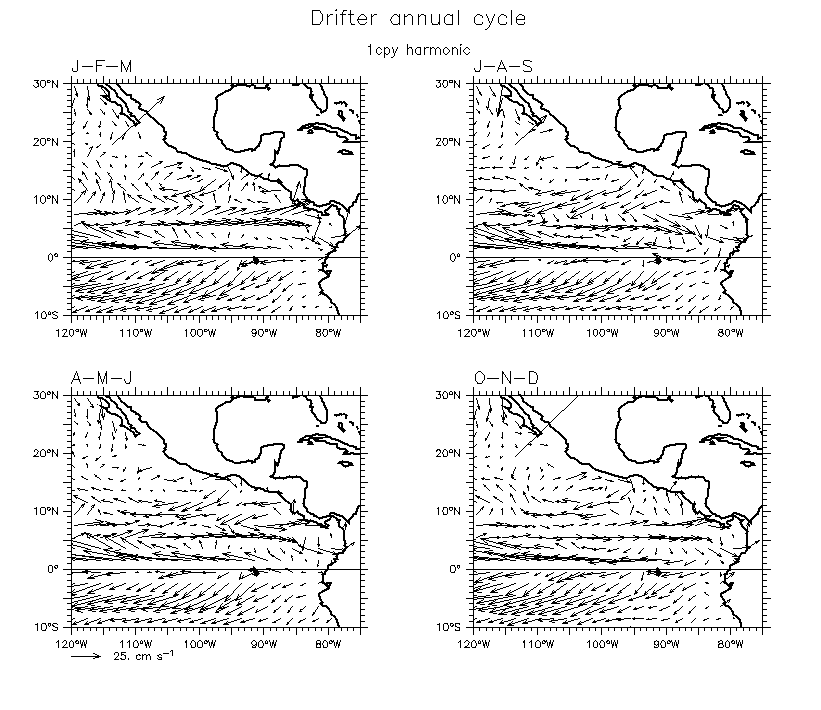
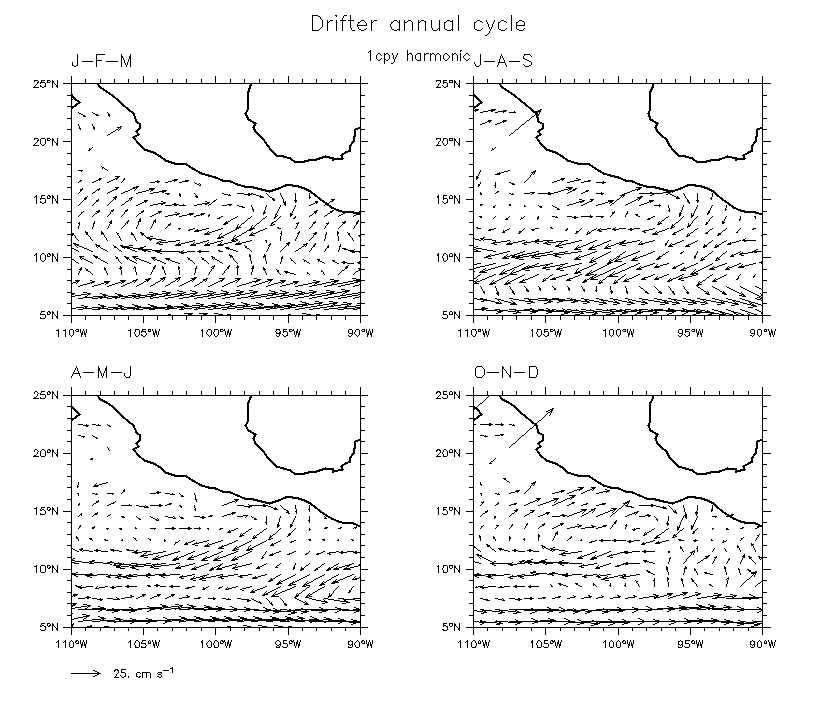
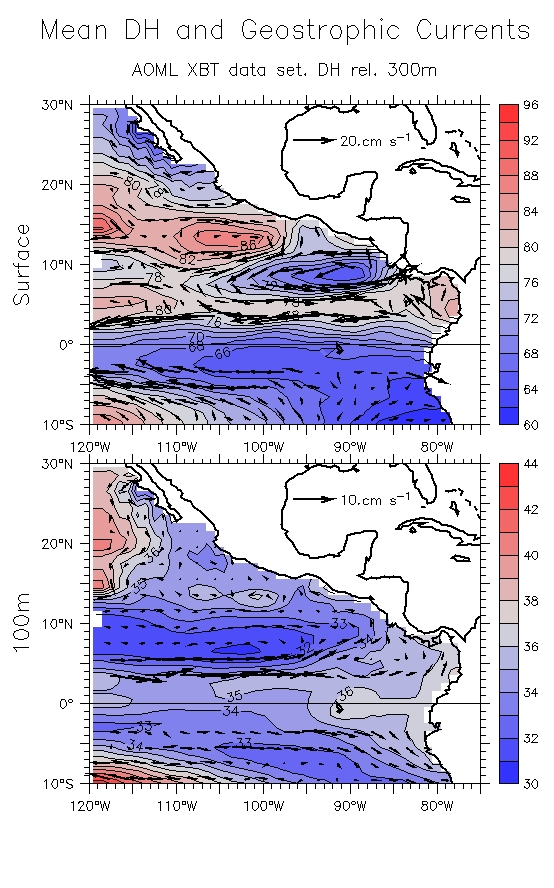
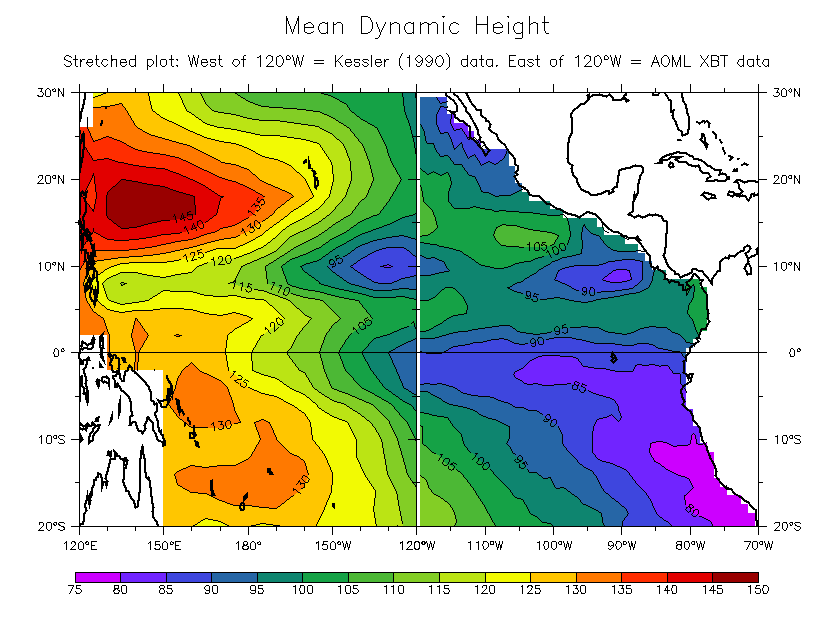
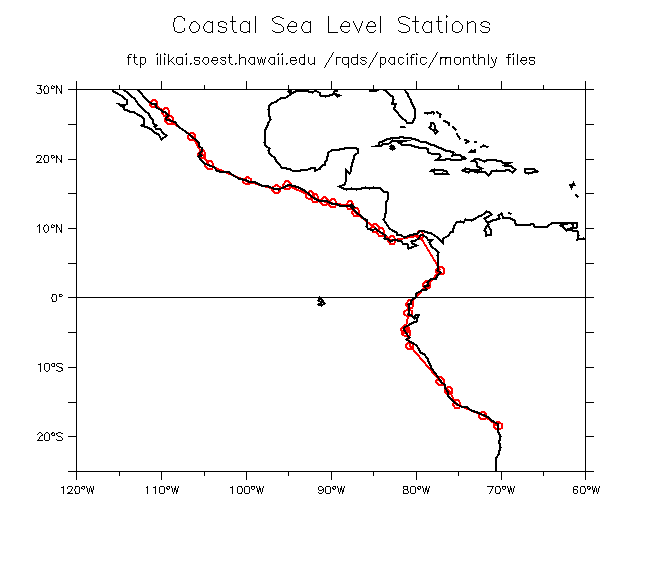
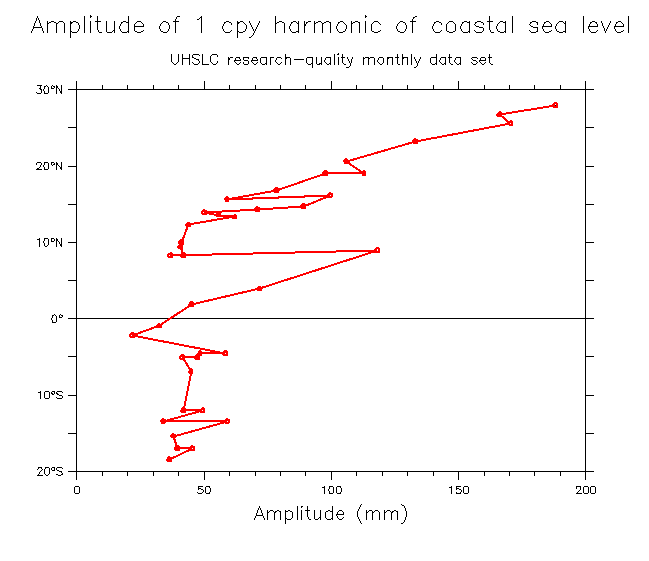
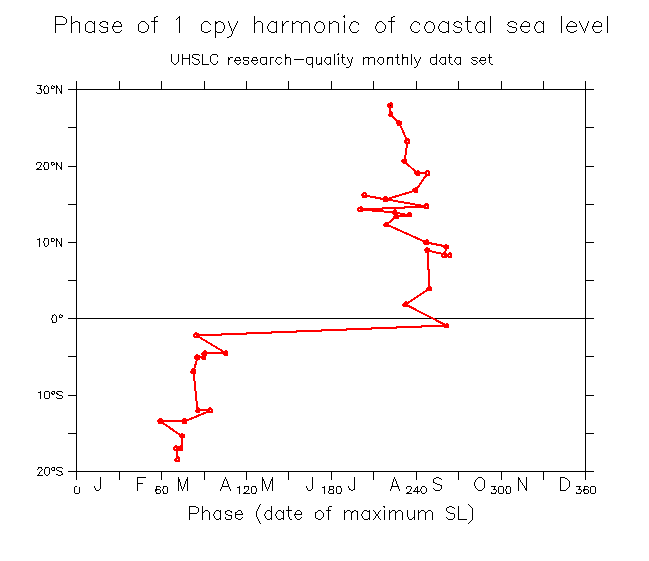
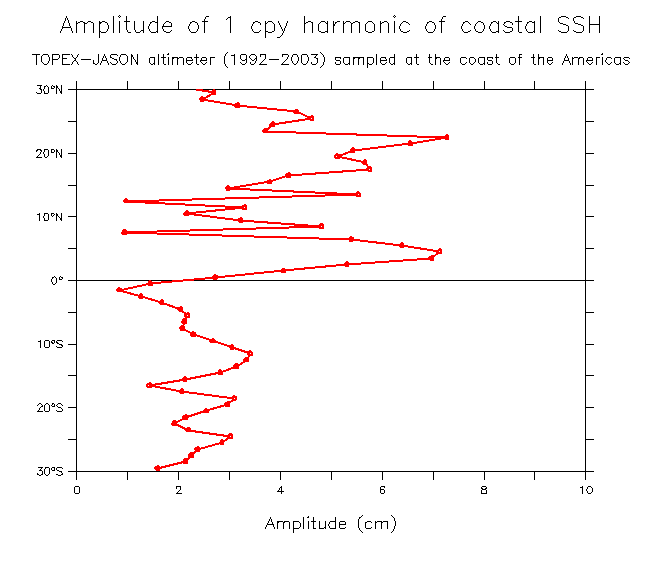
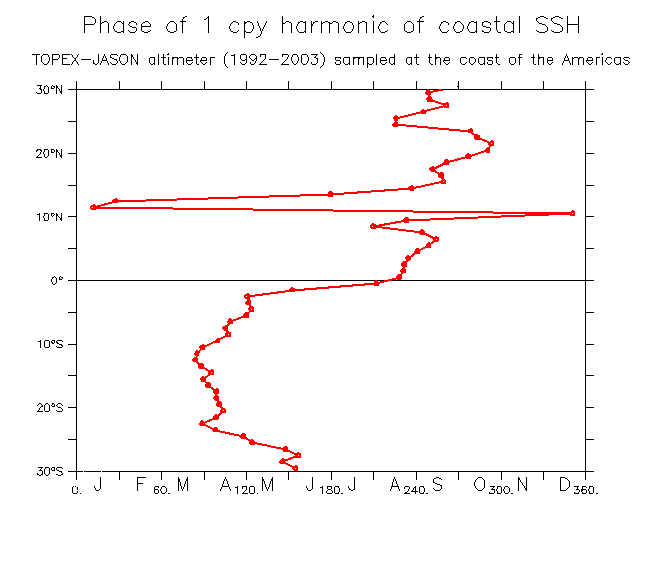
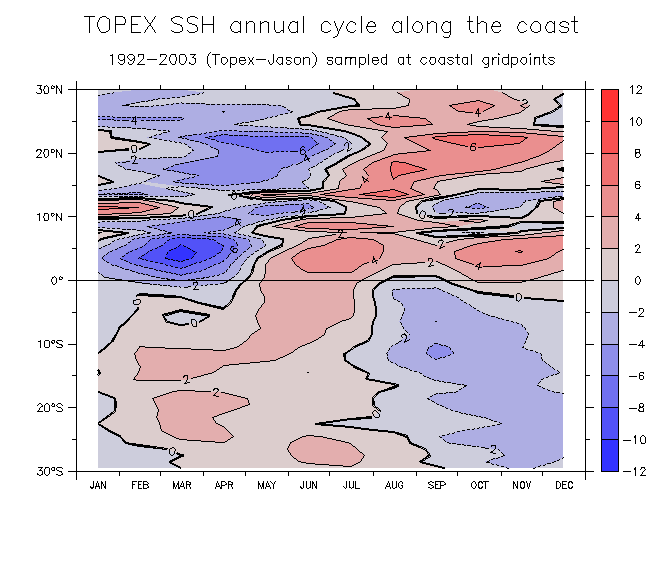
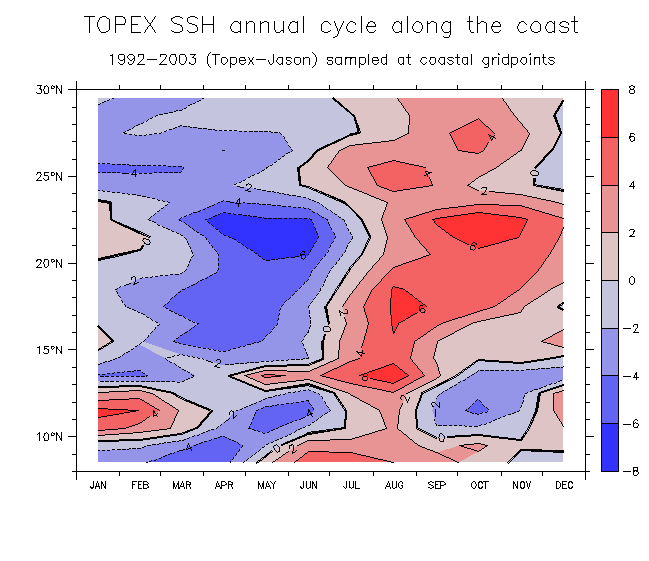
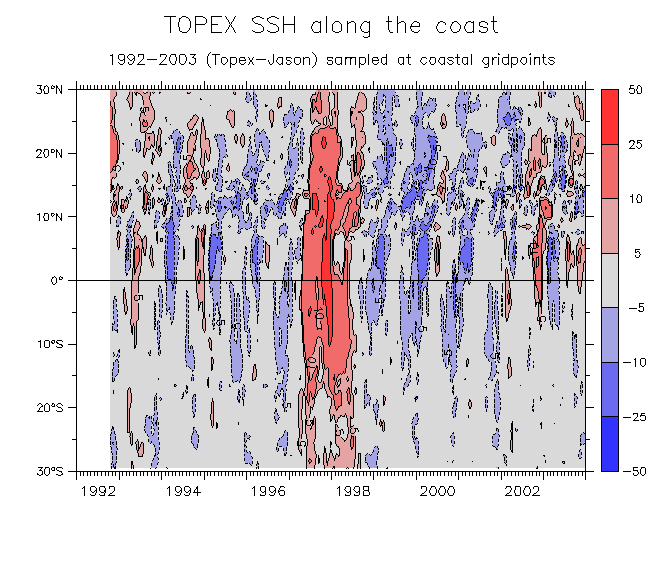
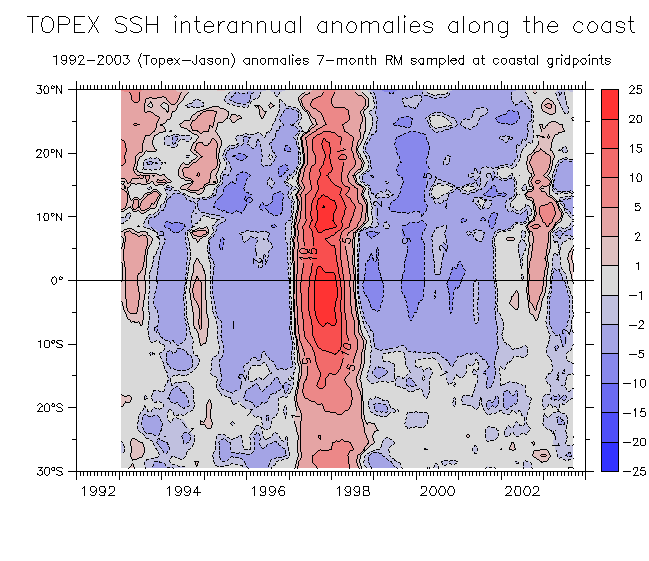
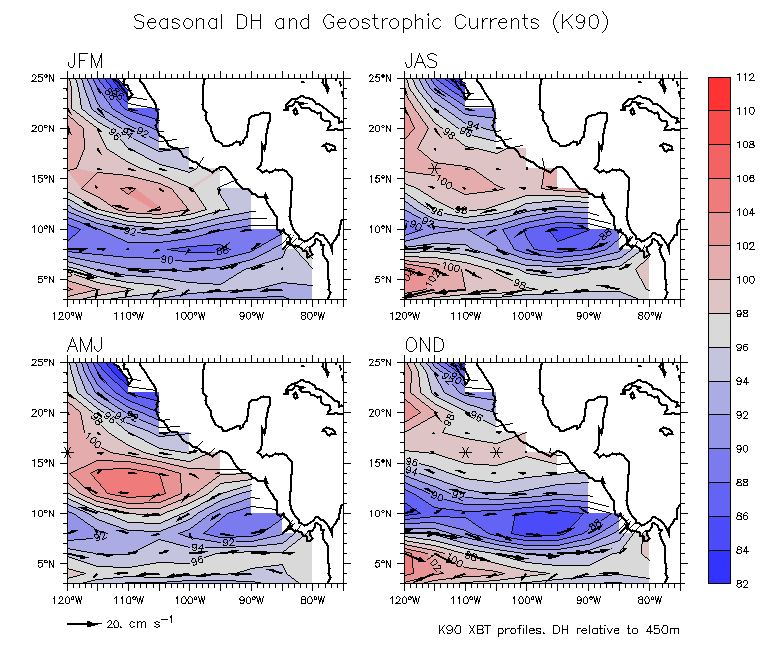
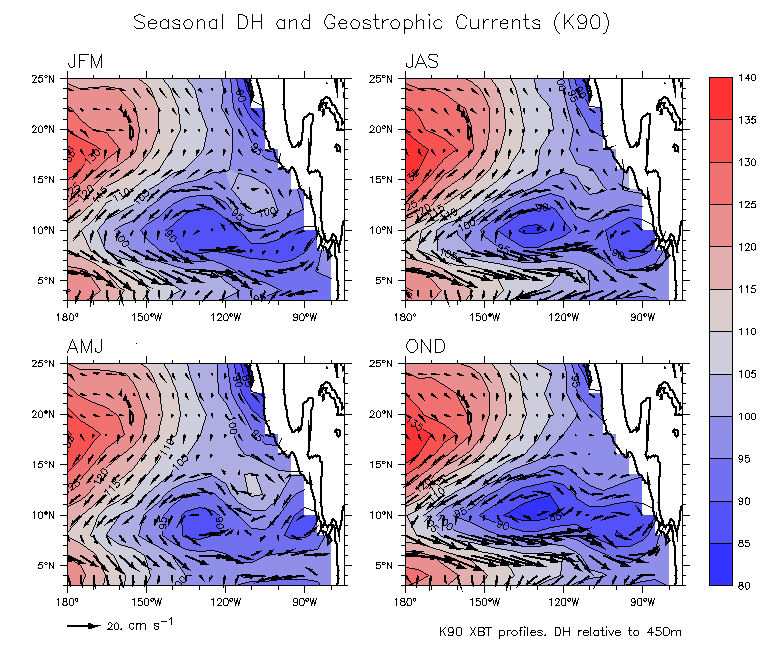
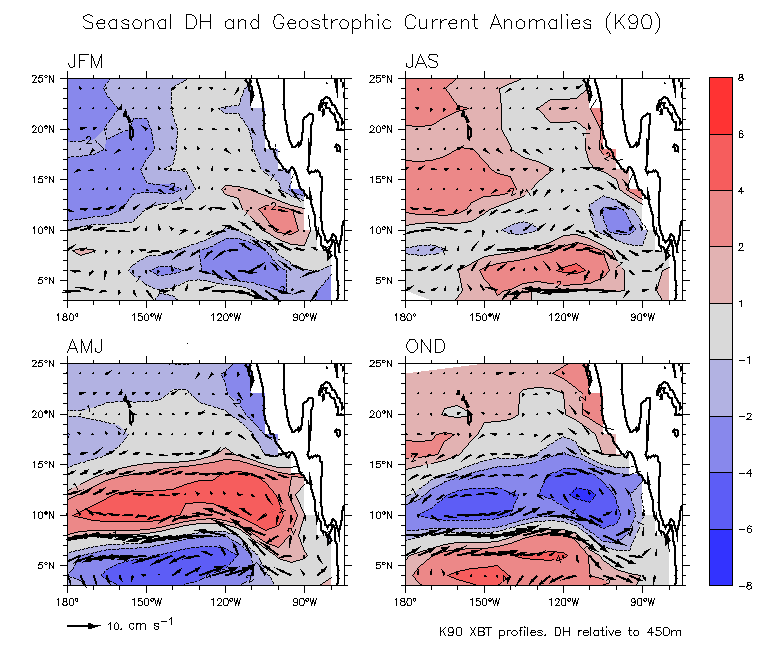
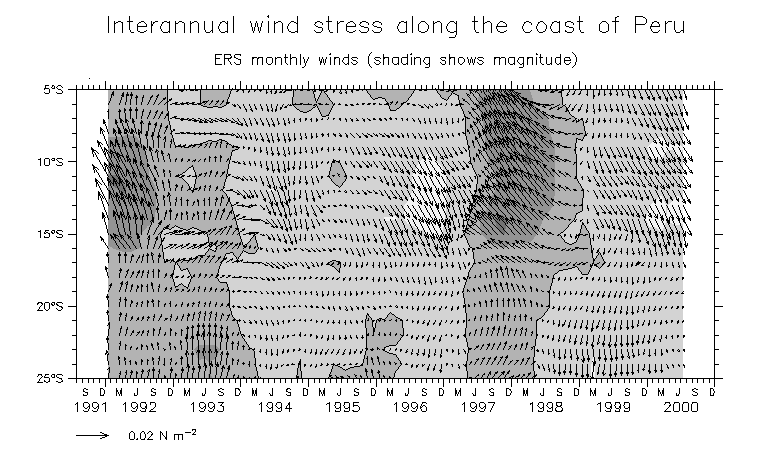
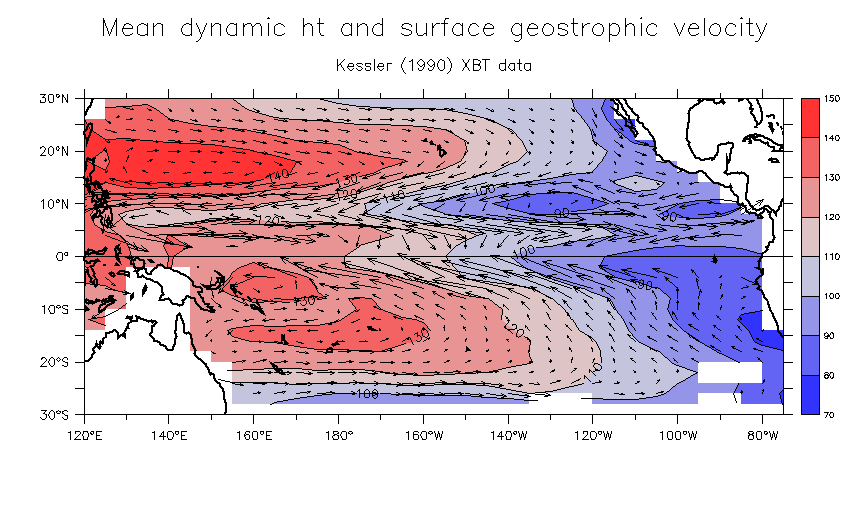
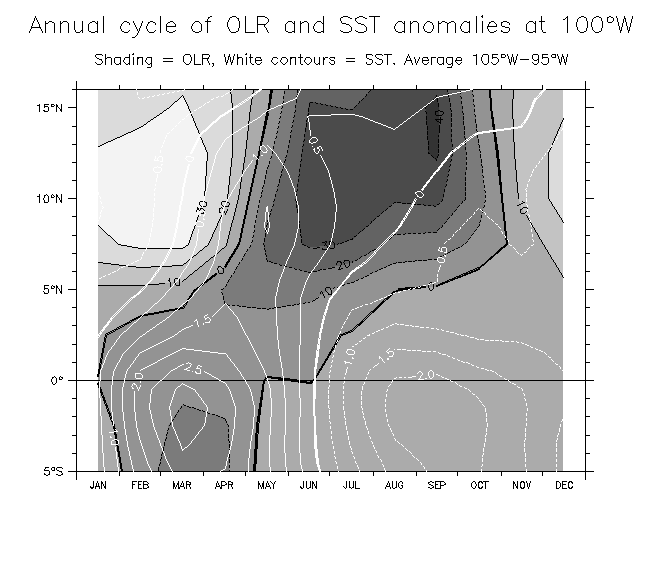
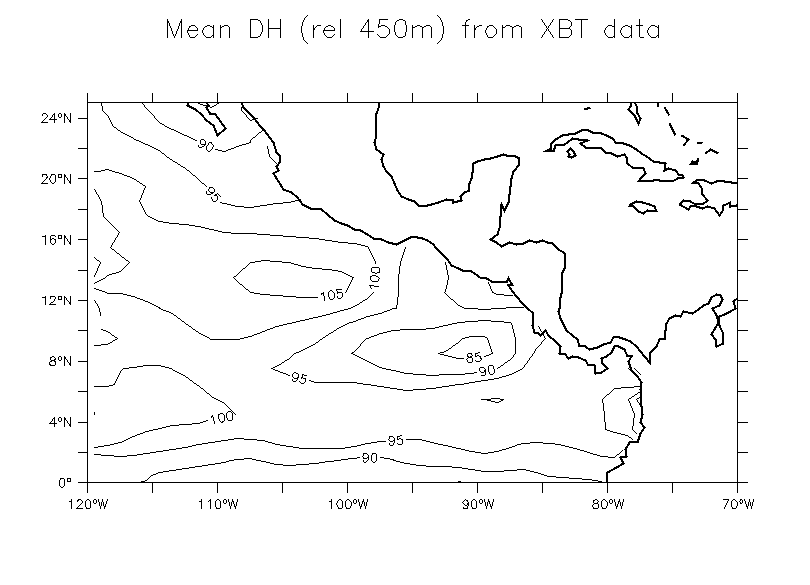
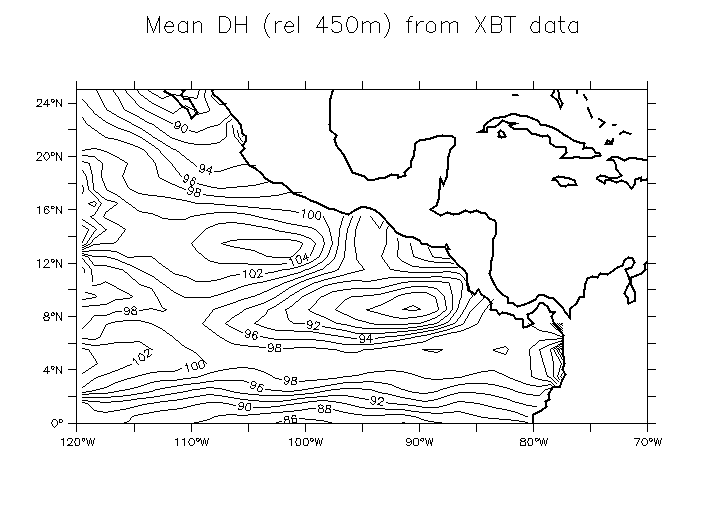
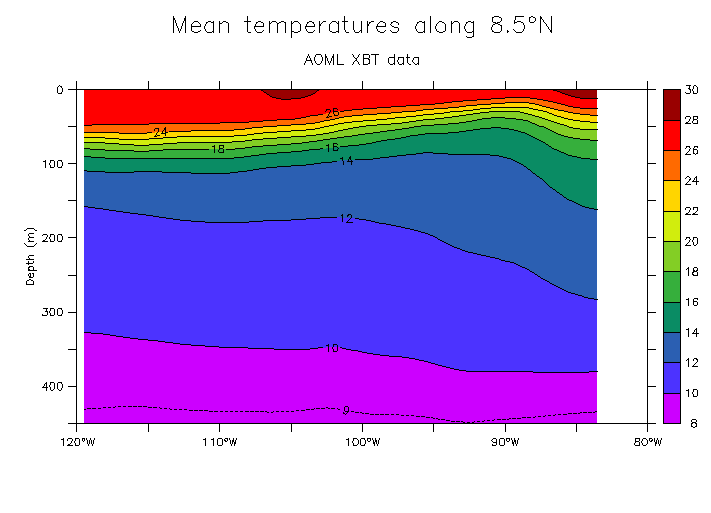
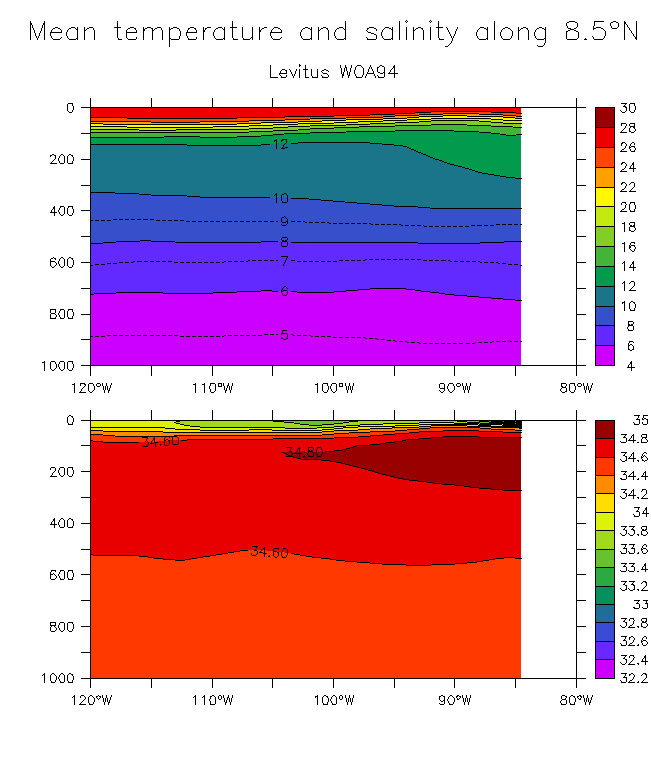
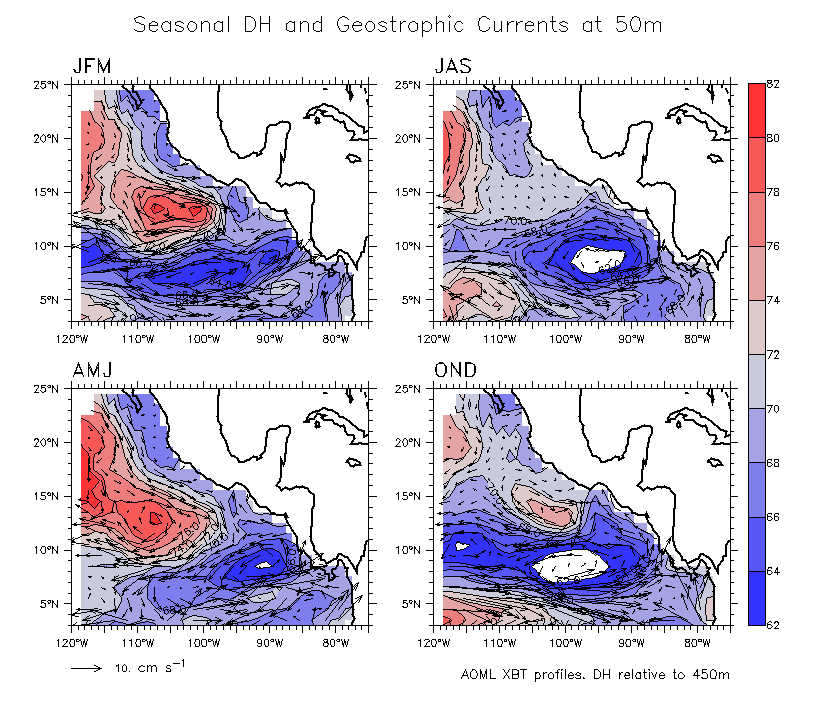
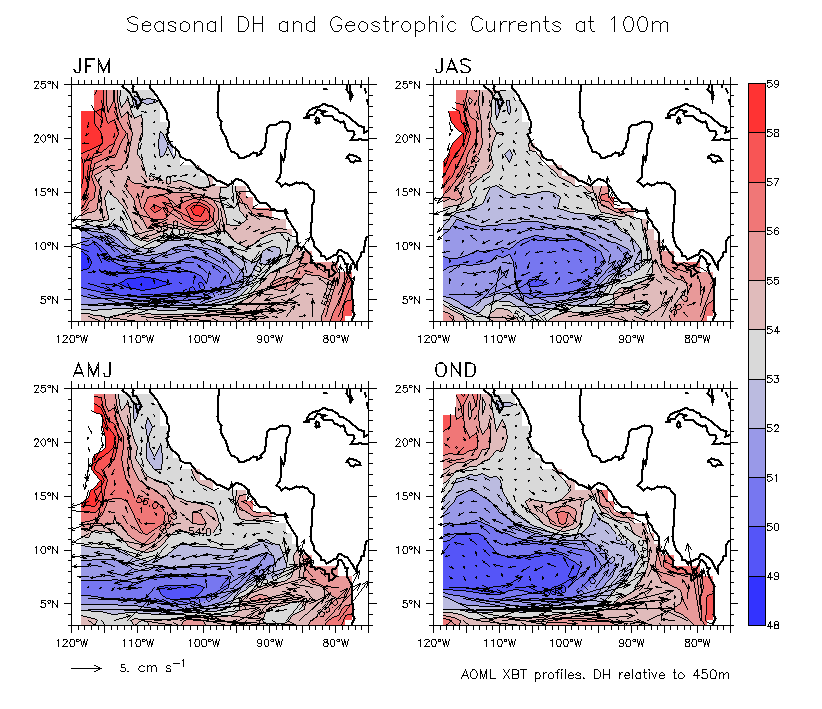
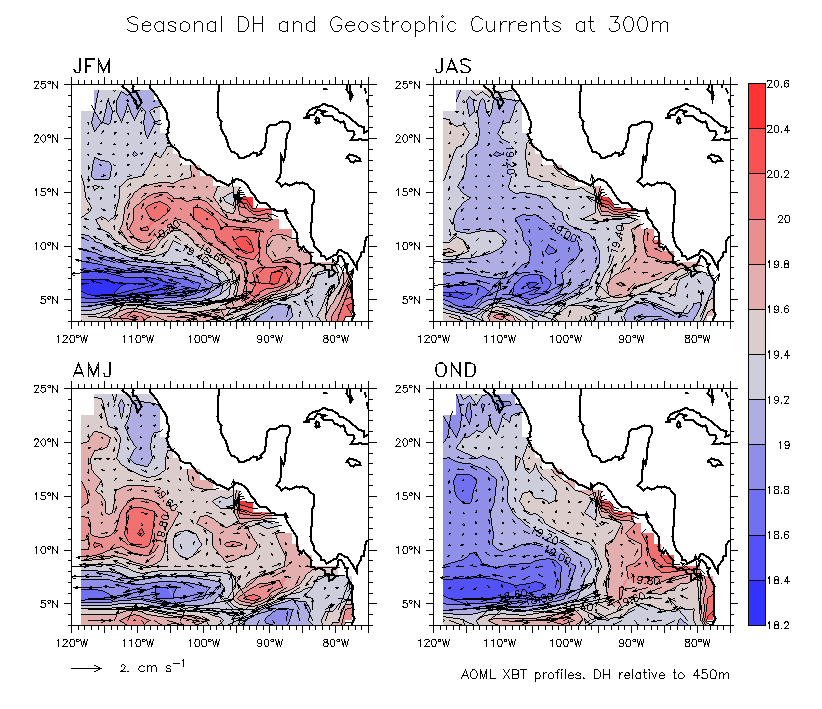
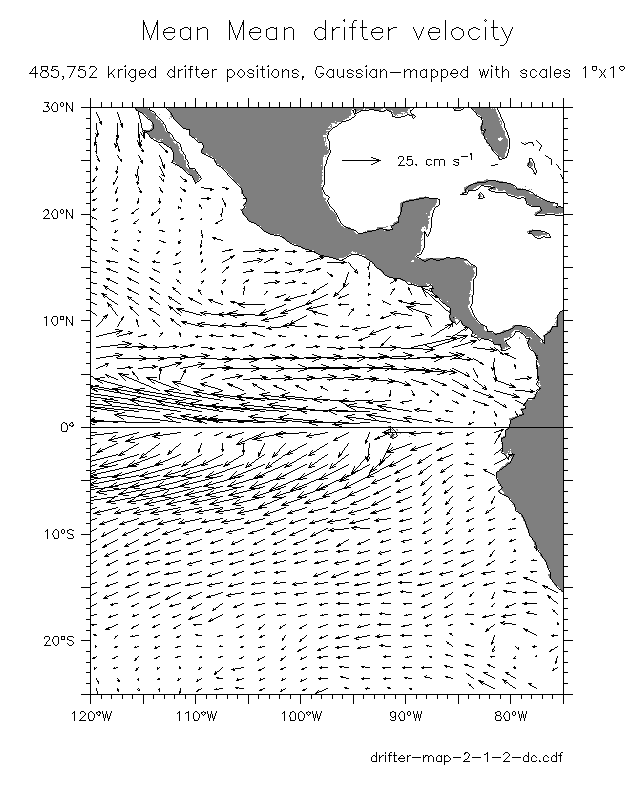
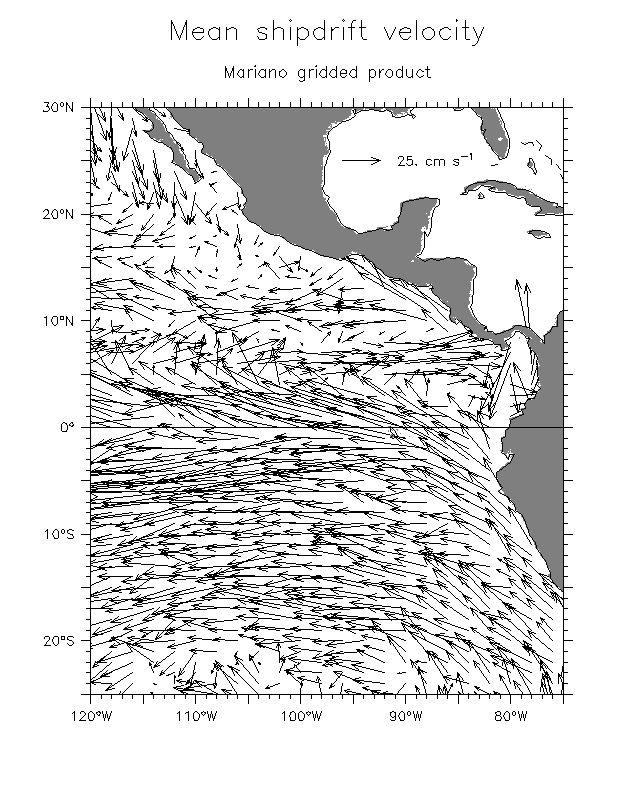
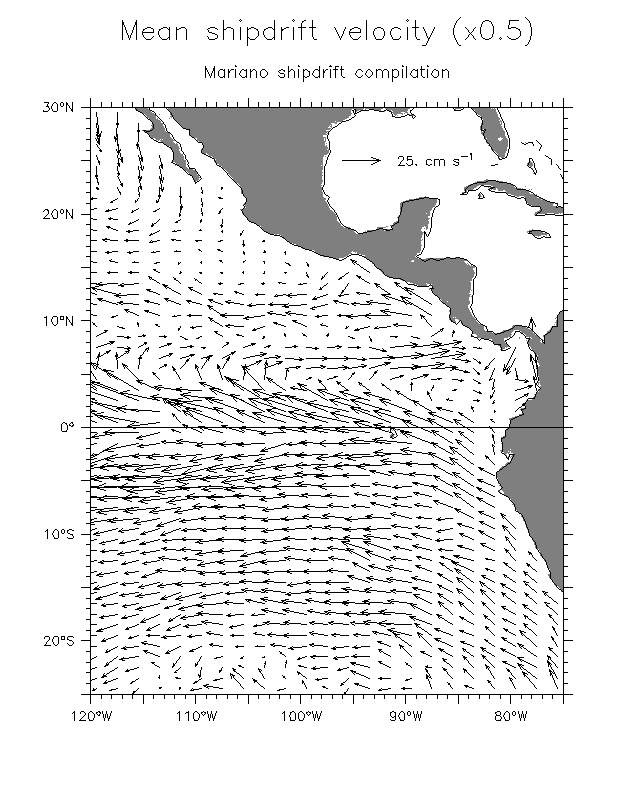
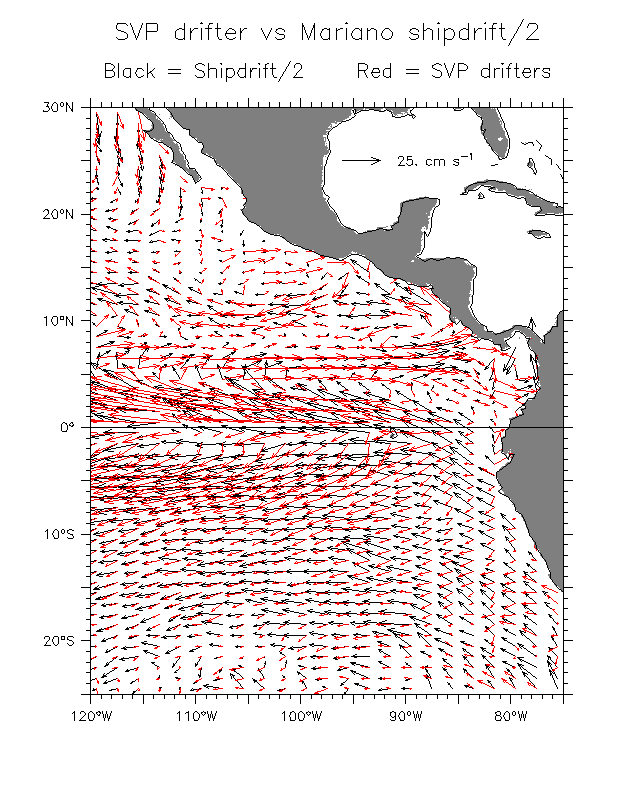
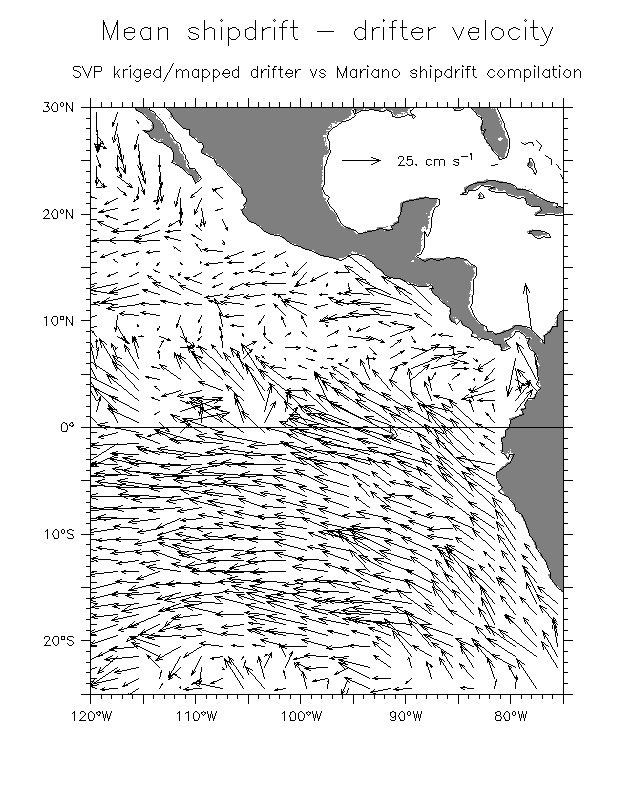
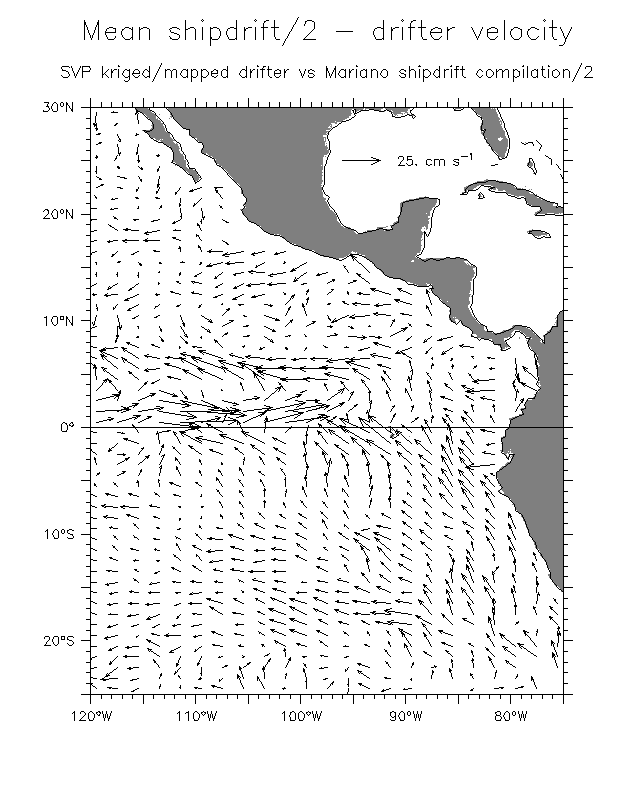
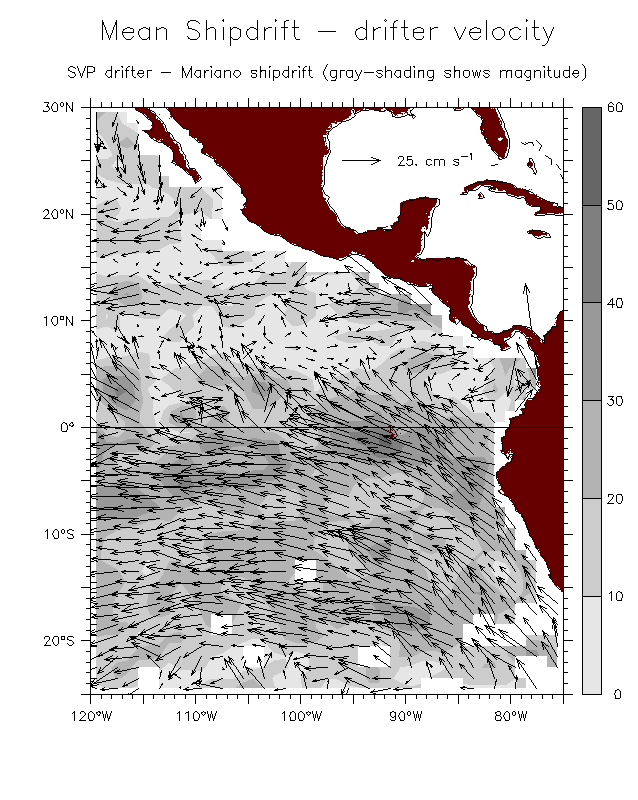
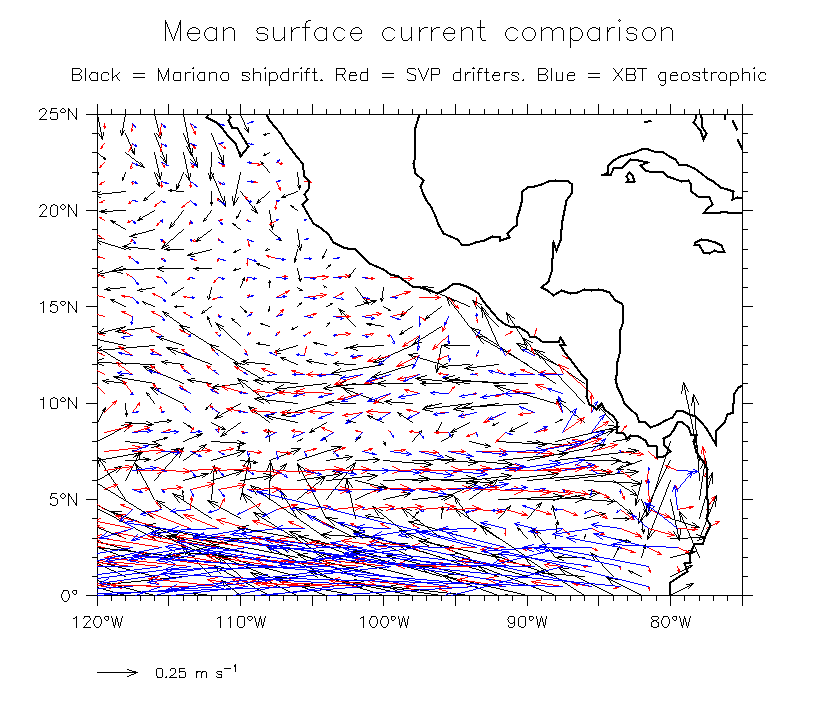
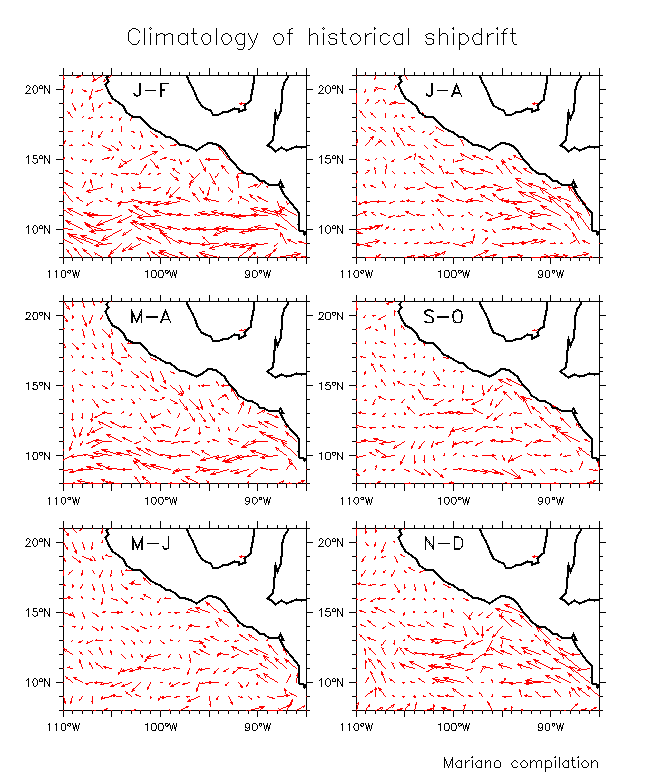
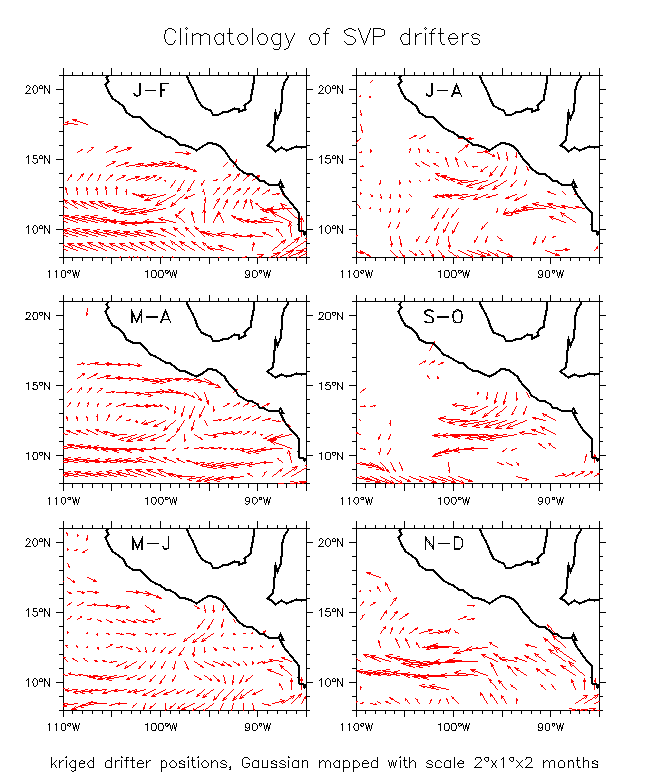
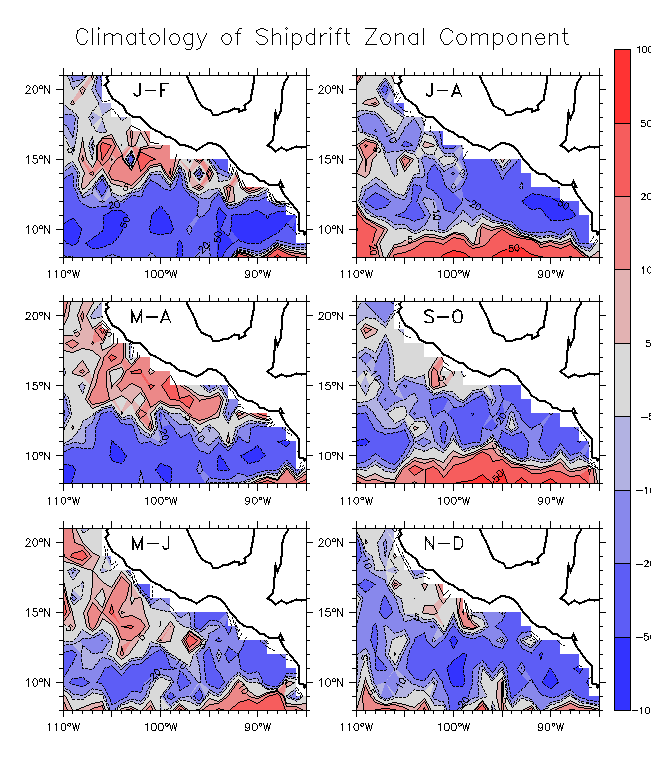
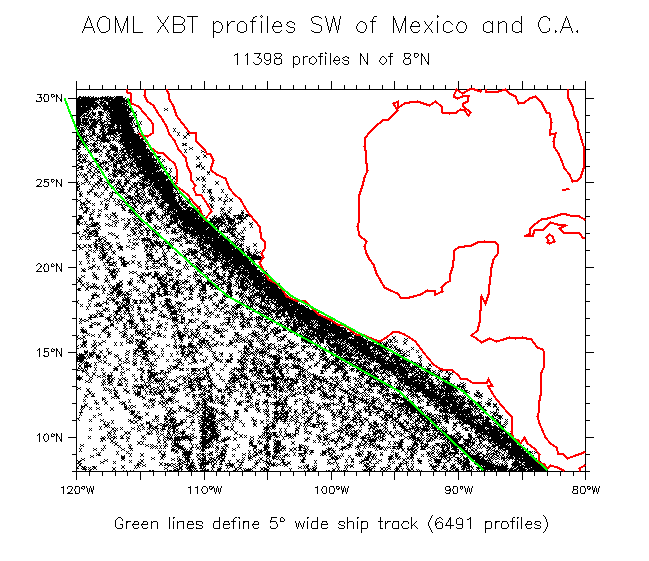
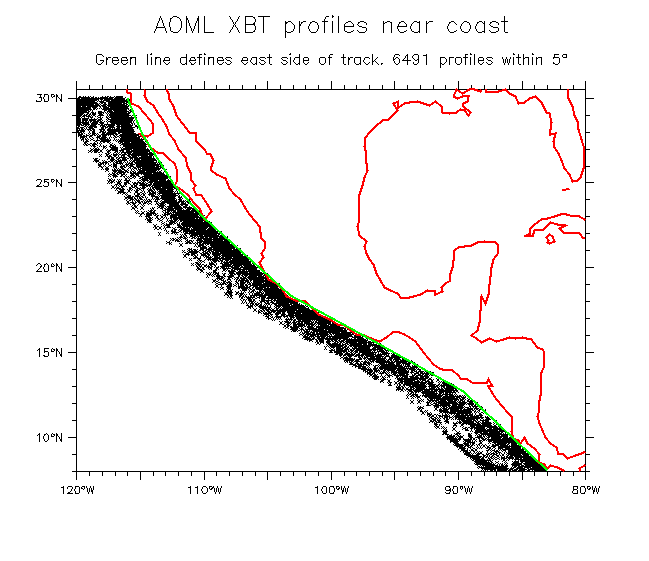
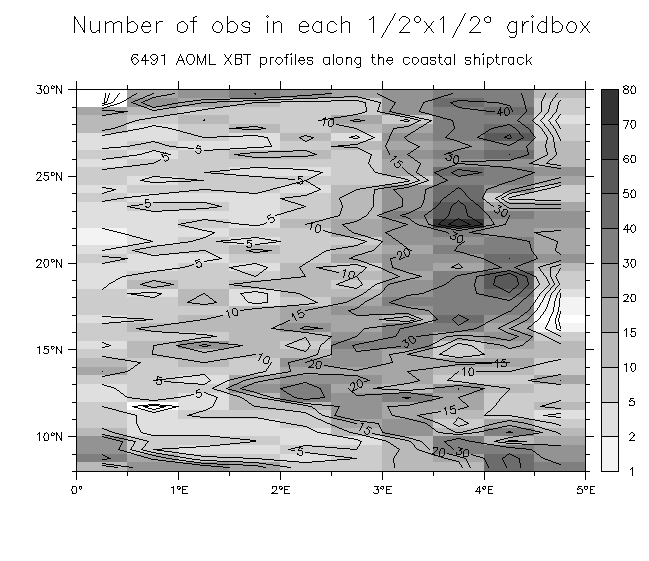
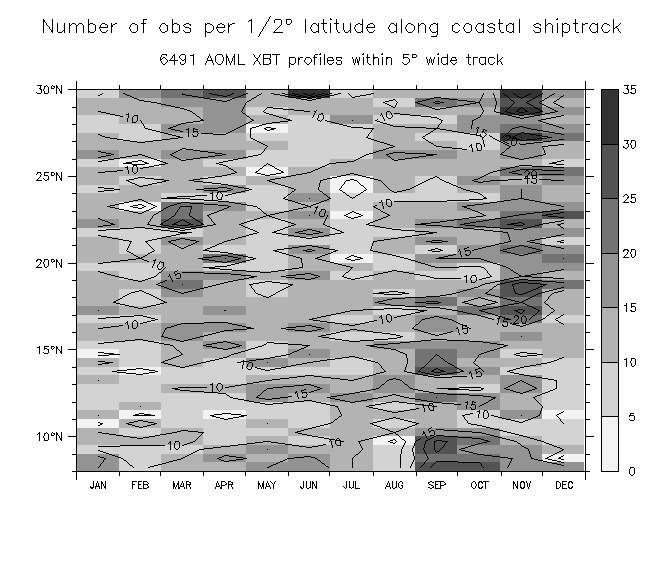
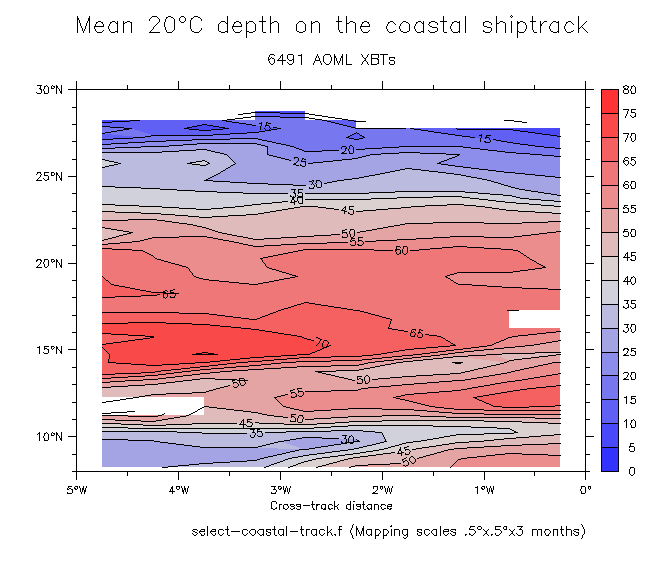
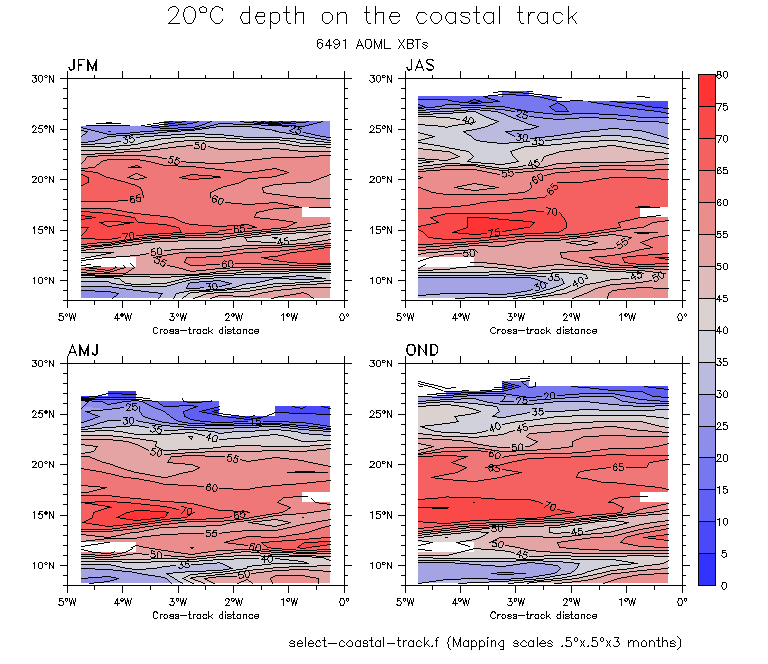
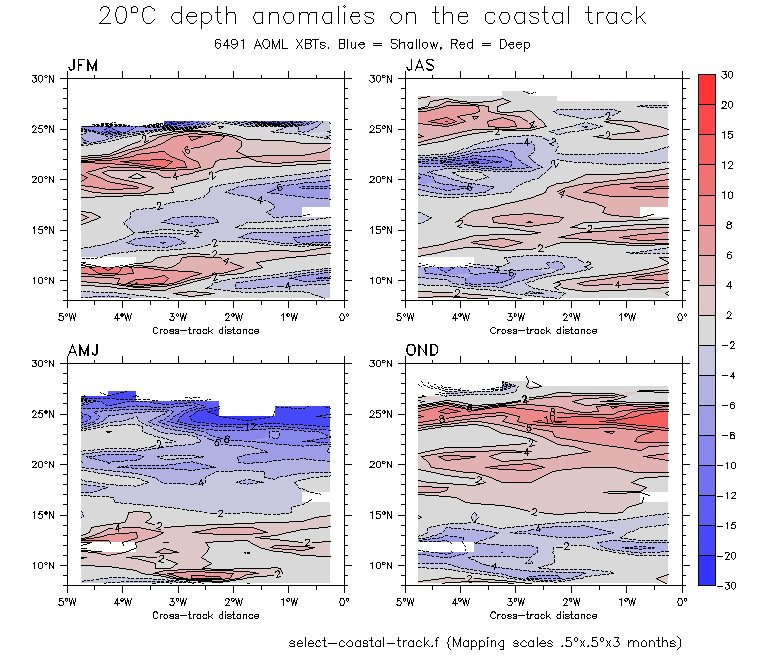
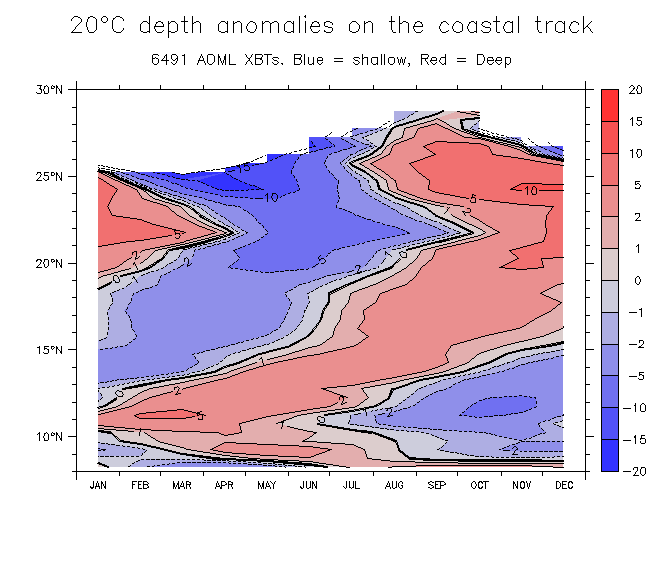
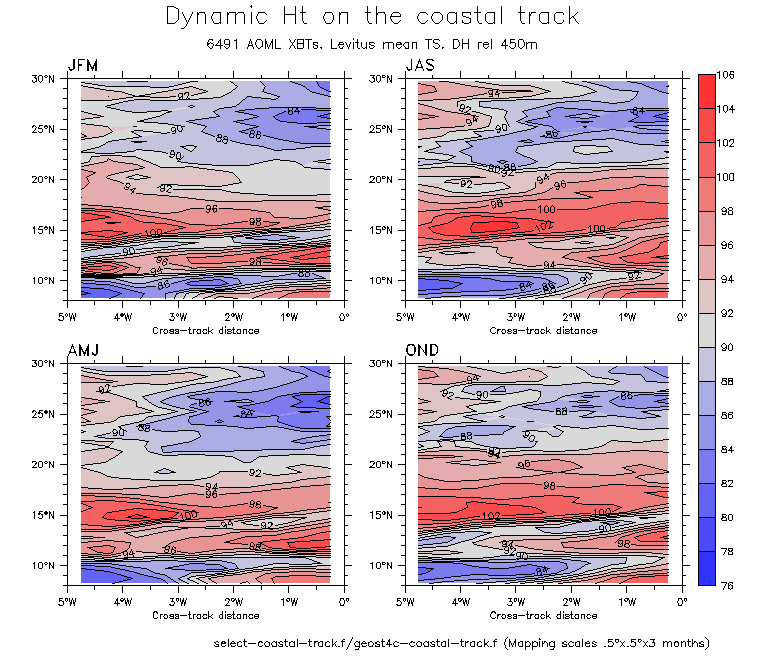
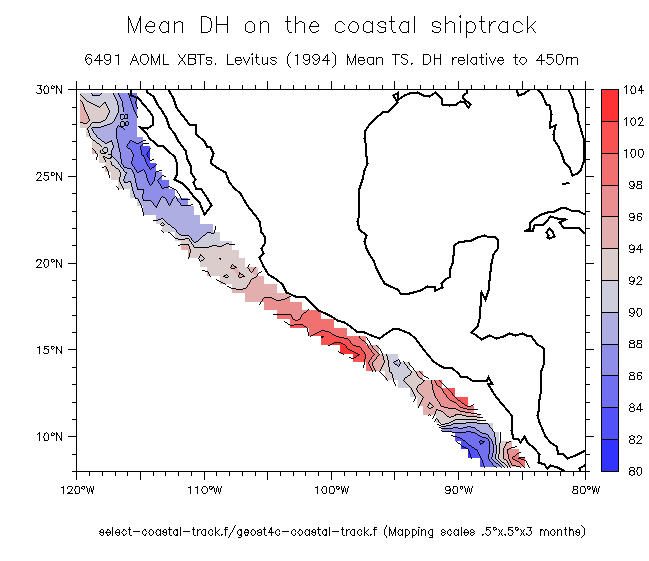
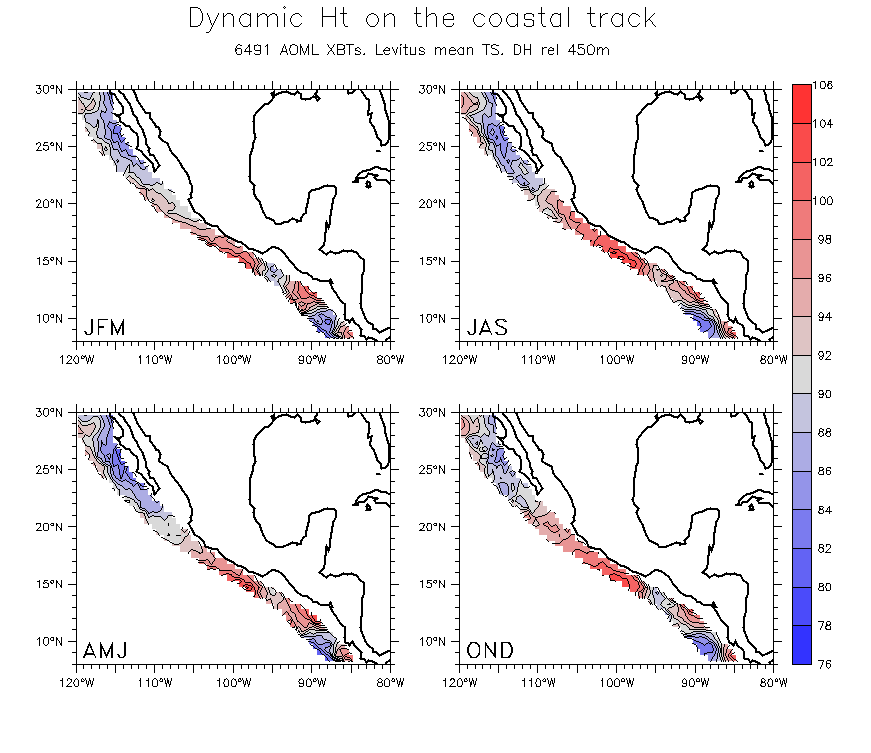
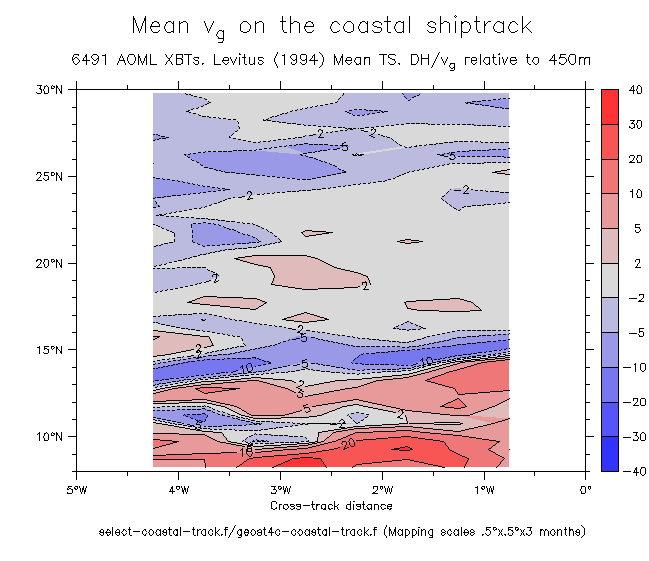
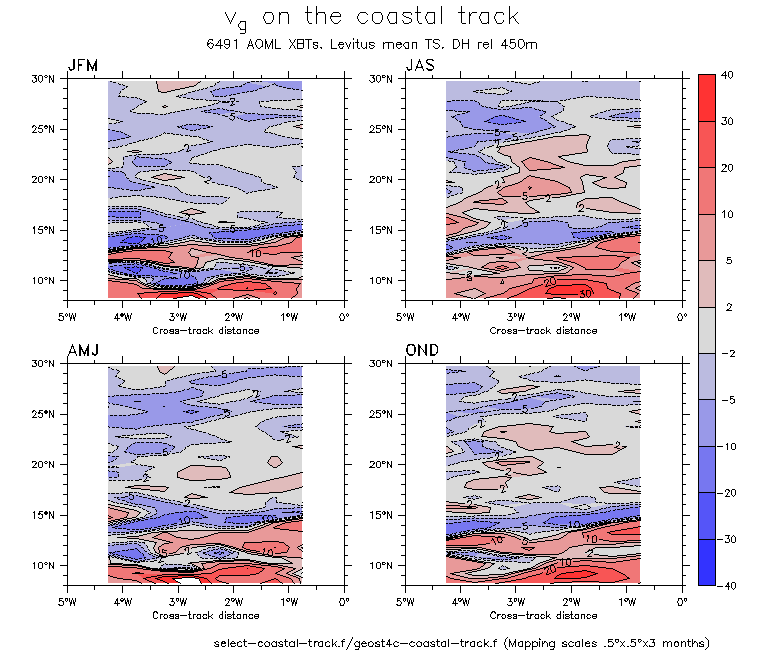
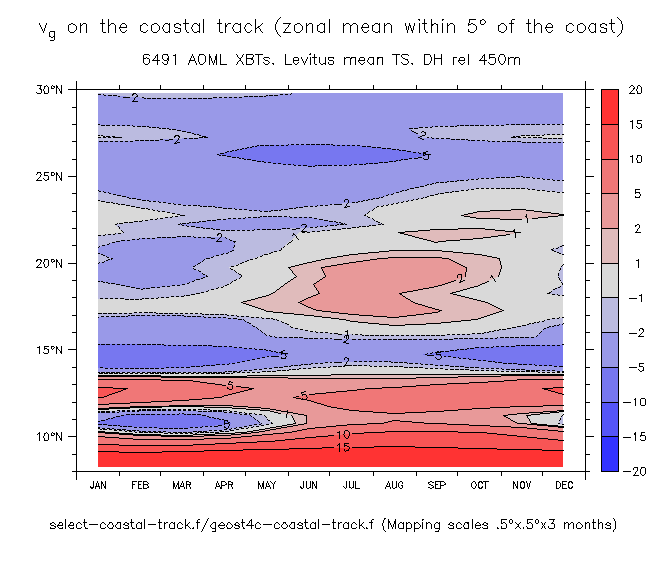
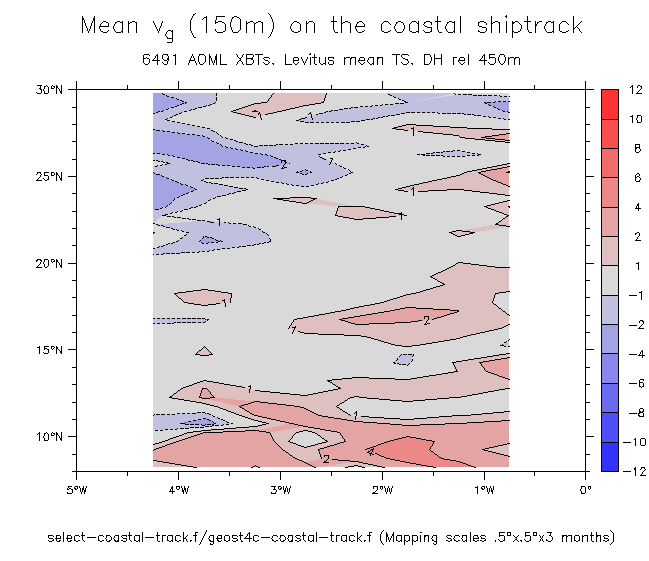
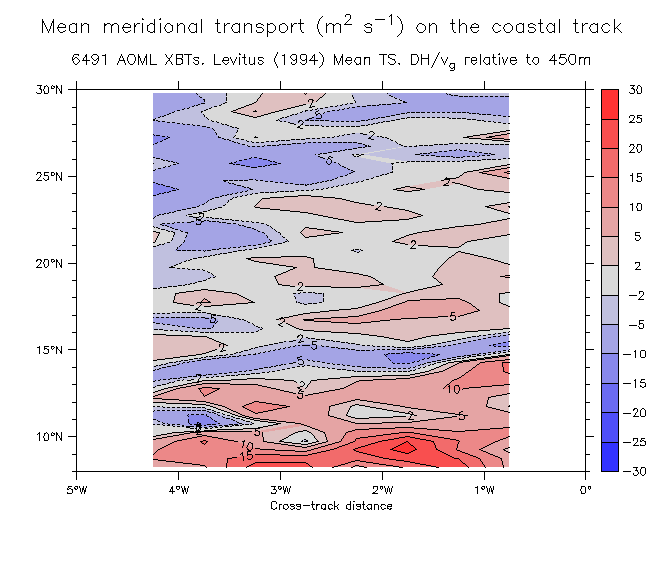
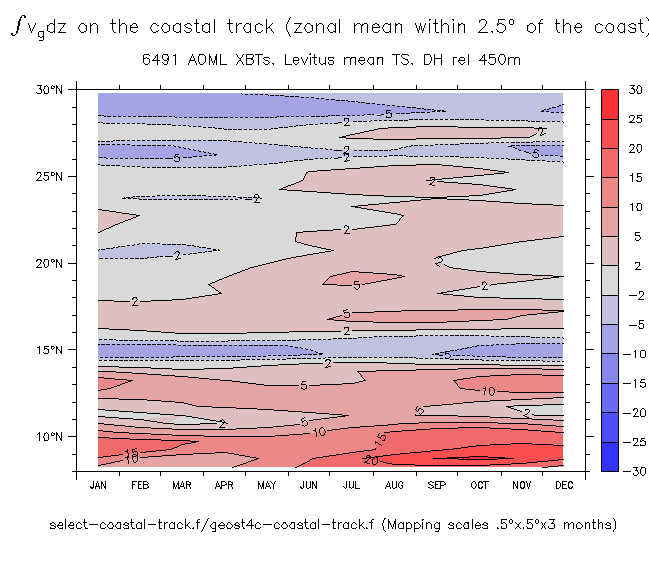
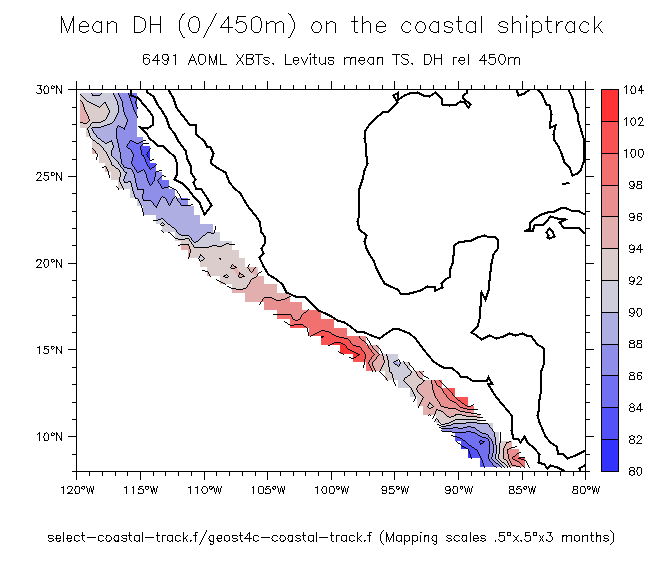
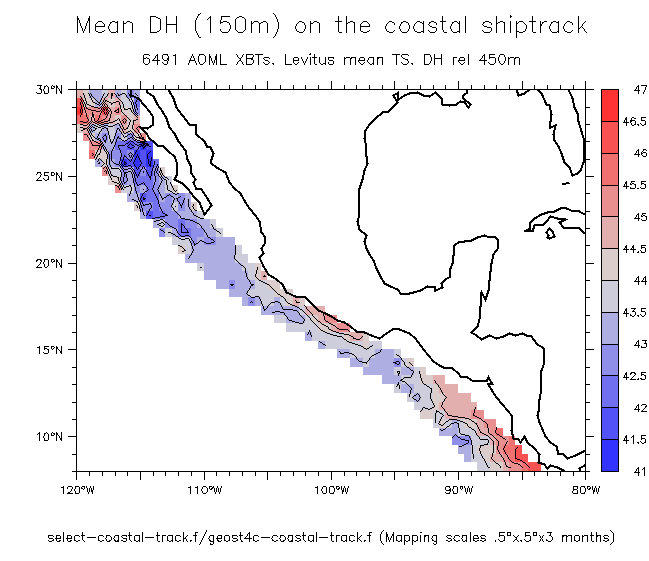
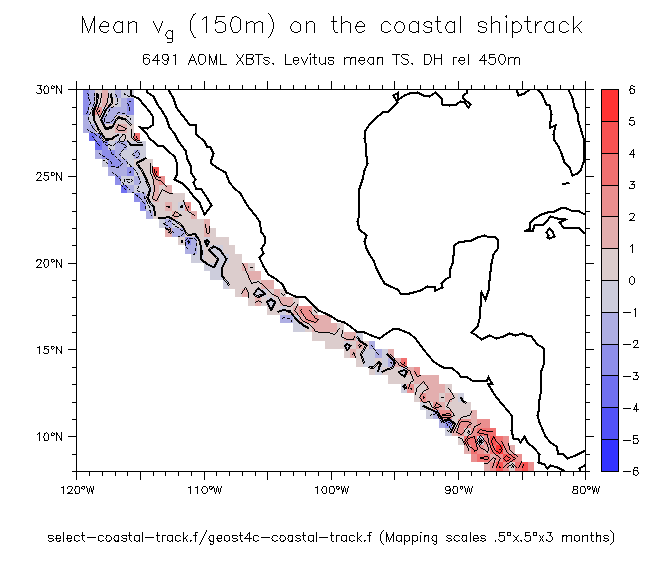
      3. A ship track along the coast: details of the thermal/geostrophic structure.
        The track from the Panama Canal to California is heavily sampled. This makes it possible to examine the detailed structure near the coast. Here is a look at the poleward currents in these data.
        1. Profile locations:
        2. Gridded quantities along the shiptrack:
          Also see plots of coastal sea level (Topex and tide gauge) in 7.d.1 above)

      4. Mean sea level and surface currents from a global GCM (Beier)
      5. Revised Fig 2 (see 150m panel) (pdf file)

    2. Mean winds SW of Mexico

    3. Color figures saved from new papers:
      1. Strub and James (2002, ENSO):
        Fig 3 = Time-latitude coastal SSH
        Fig 11a = Coastal SST
        Fig 11b = Coastal SST
        Fig 11c = Coastal SST
      2. Strub and James (2002, Annual cycle):
        Fig 6 = SSH seasonal cycle
        Fig 8 = SSH seasonal cycle+DH mean

  12. Paper published at Progress in Oceanography

Other relevant pages:

horizontal black line
NOAA logo Dr. William S. Kessler
NOAA / PMEL / OCRD
7600 Sand Point Way NE
Seattle WA 98115 USA
Tel:   206-526-6221
Fax:  206-526-6744
E-mail:  william.s.kessler@noaa.gov
See also:    Kessler home page        Kessler publications         PMEL home page