
Climate Minor option
Weather Discussion Resources
November 25th
Meteograms from UW Rooftop, UW Urban Horticulture, SeaTac airport
Quillayute Sounding (west side of Olympic Peninsula)
1000 mbar (near-surface) temperature – see cool down across Western US
1000 mbar pressure + temp – notice the association of temperature with pressure, especially in cyclones/anticyclones over the Pacific
500 hPa height field – show side by side with surface pressure/temp above. Draw cross section explaining the Equator to pole gradient in 500 hPa height field, relate it to temperature via the hypsometric equation. Explain how surface pressure has distinct cutoff highs and lows but that this is less evident in the 500 hPa height field
Then show overlaid 500 hPa height and surface pressure Explain how troughs and ridges at 500 hPa are reflected in lows and highs near the surface, but that they are not completely correlated. Geostrophic winds will be different at different levels.
Return to Quillayute sounding and compare winds at surface and 500 hPa and explain using geostrophic flow plus friction tending to deflect winds slightly toward low pressure (low heights).
Upper air map to show map of winds from US soundings
Analysis 500 hPa heights and wind vectors – shows geostrophic flow, and particularly that flow at 500 hPa is mostly from west to east, in contrast with the surface
Earlier Weather Discussions
IR Imagery, Eastern Pacific, 36 hr loop
IR Satellite Image with NCEP fronts, highs and lows
GFS Forecast, precip/SLP/thickness
NCAR “Upper Air” (Rawinsondes)
Week 1: Observations
Map Analysis, Plotting and Isoplething guide
Solution to Contouring Problem on Homework
Week 2: Atmospheric Structure, Composition and Chemistry
Week 3: Radiation and the Earth’s Radiation Budget
Week 4-5: Hydrostatics and Thermodynamics
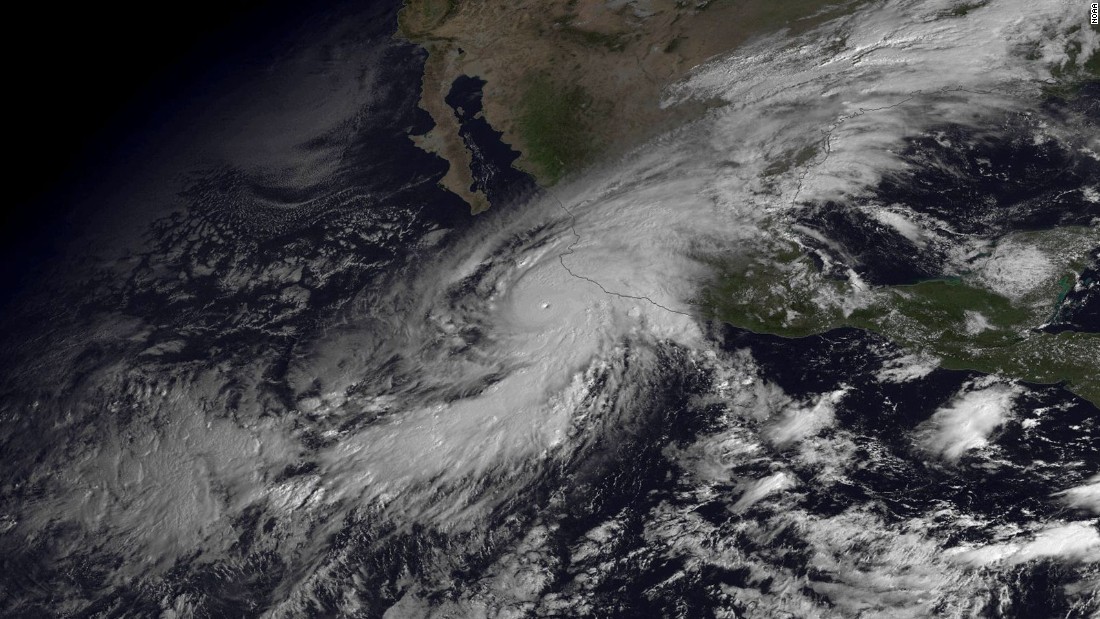
Hurricane Patricia resources
Hurricane Patricia: The fastest developing and strongest hurricane ever measured.
- Patricia track and intensity
- Weather Underground piece
- Jeff Masters blog piece
- What fuels Patricia and other hurricanes?
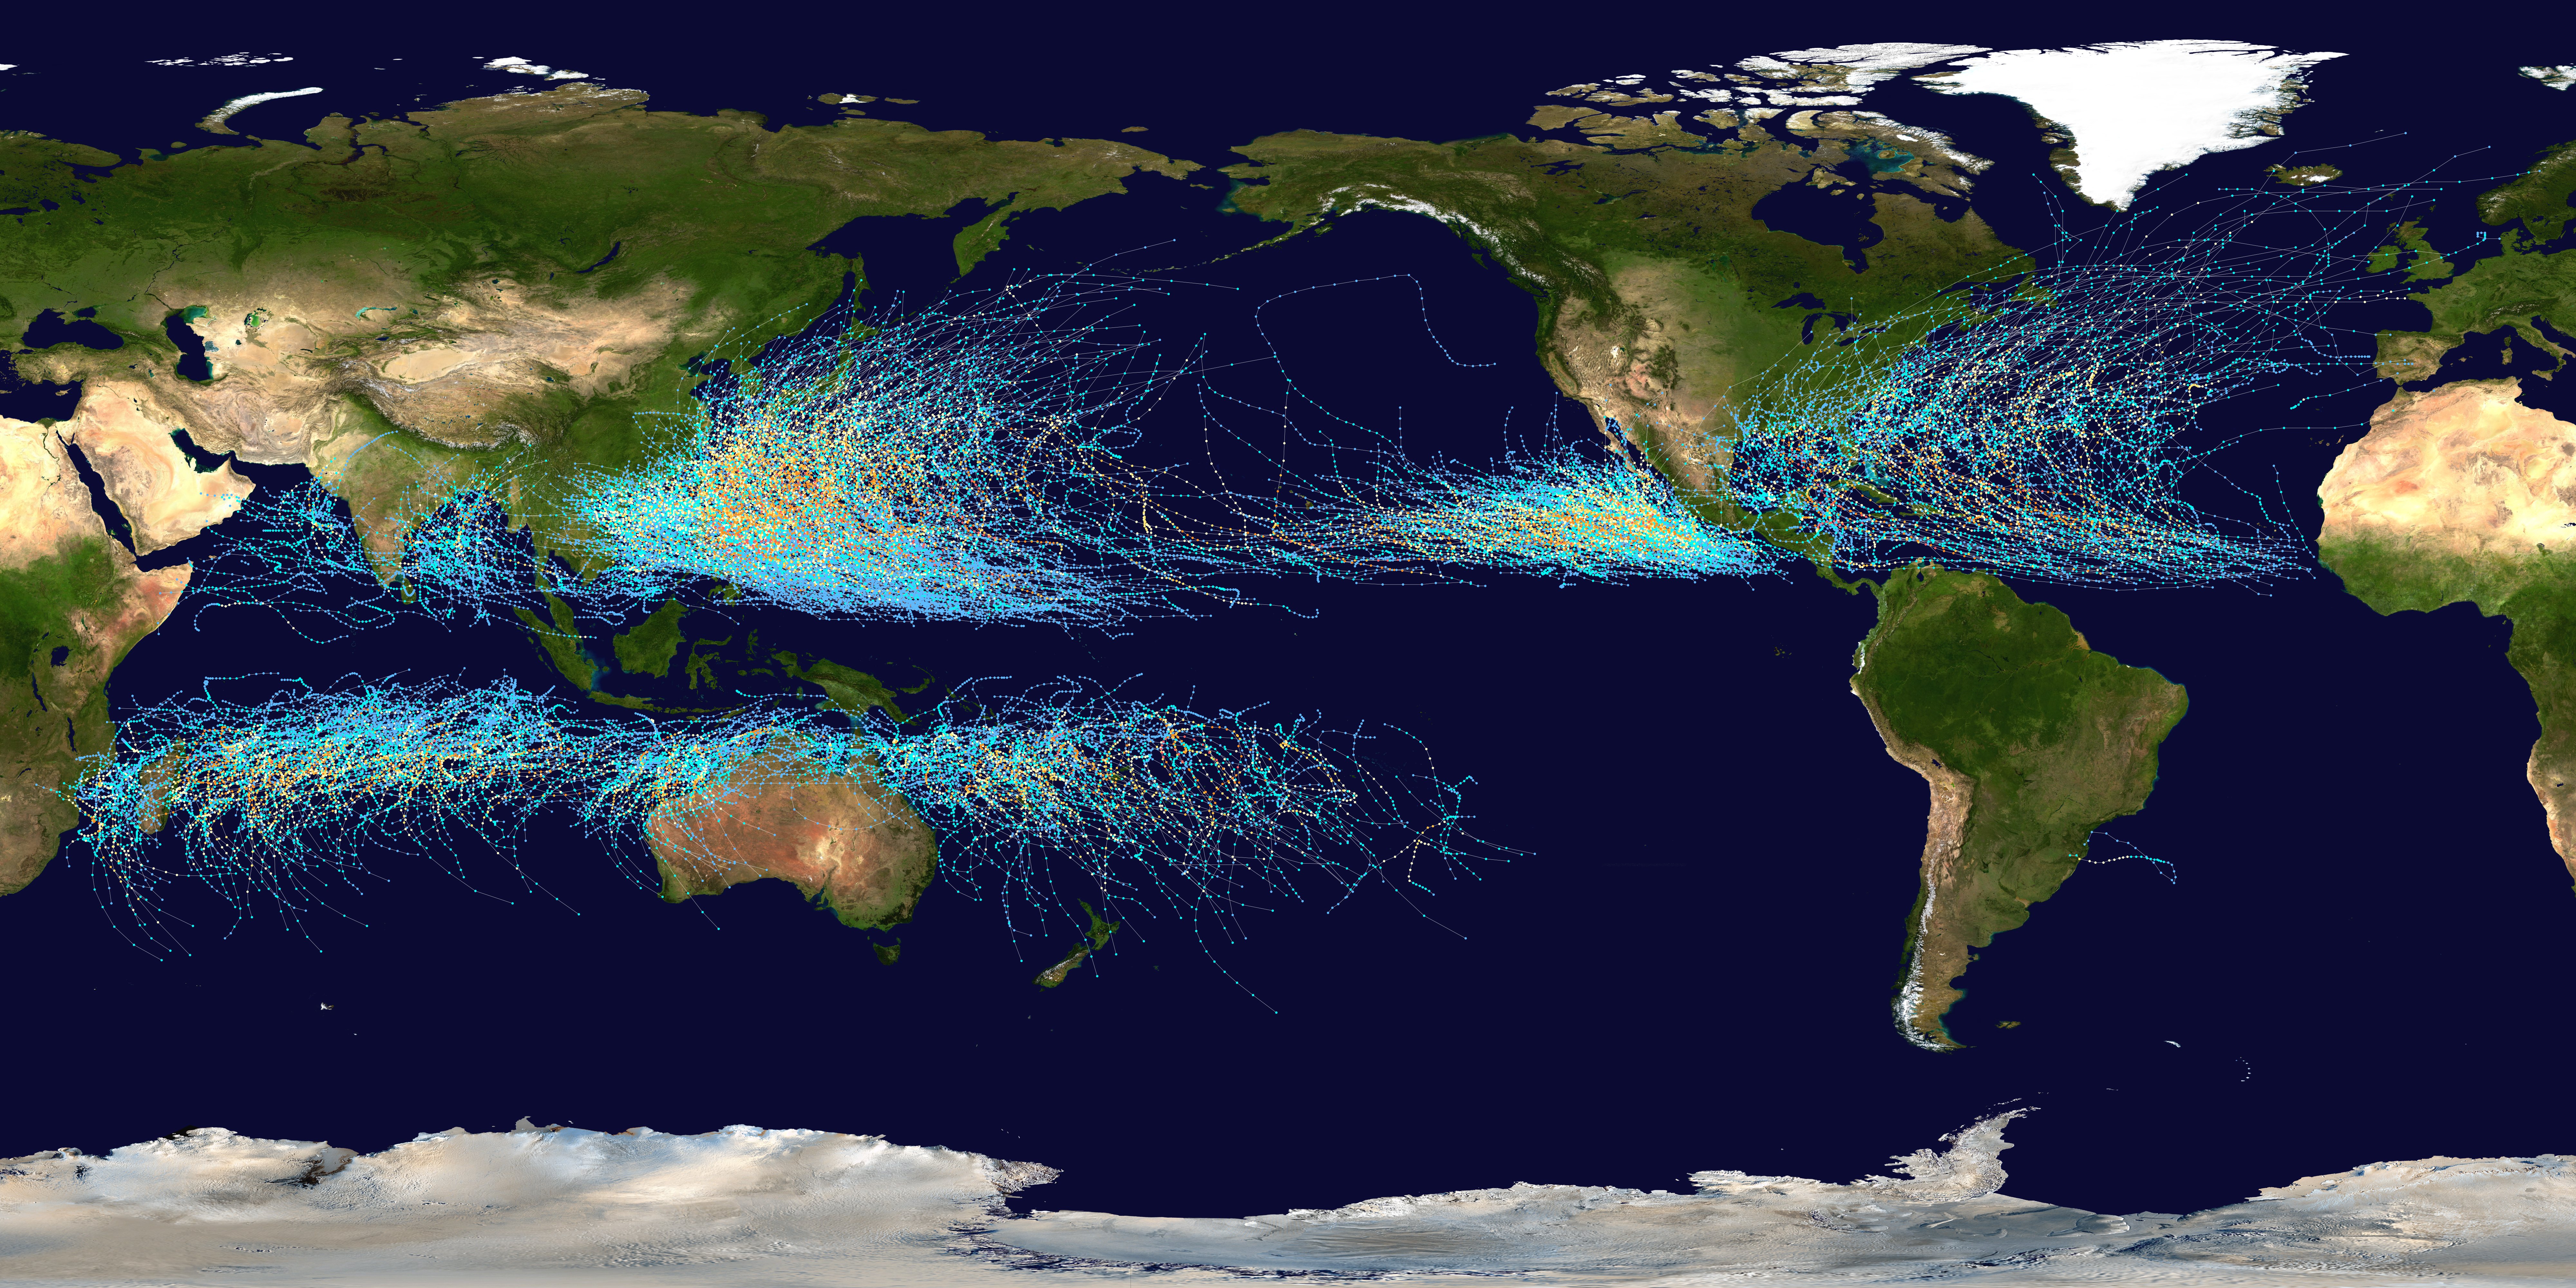
- Climatological tropical cyclone tracks
- Regional visible “true color” imagery from GOES
- Visible image, with low sun showing cloud tops
- Visible animation from GOES
- NY Times piece with great visualization of wind streamlines
- Eyewall replacement evidence from microwave satellite imager
Week 6: Clouds and Thunderstorms
Cloud slides in Powerpoint (shown during lecture, November 5)