|
Stars are the basic building blocks of the structure we observe in the heavens and a principal source of light we detect and analyze as astronomers. My amateur astronomer's days were focused on variable stars and they still hold a special place in my heart.
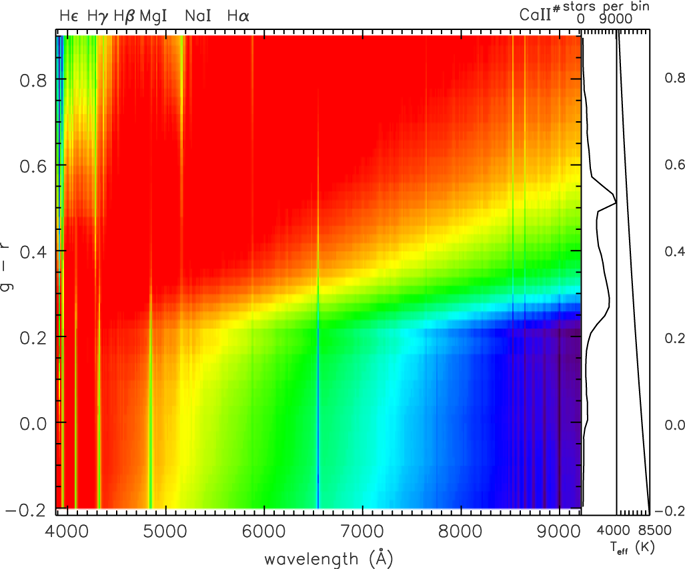
For my Ph.D. thesis, I studied dying stars, the so-called asymptotic giant branch stars (Ivezić & Elitzur 1995). To make studies more cheerful, I then looked at some baby stars (Miroshnichenko et al. 1999), studied infrared properties of normal (dwarf) stars (Finlator et al. 2000 and Covey et al. 2007) and chemistry of some giant stars (Helmi et al. 2003), then searched for radio stars (Kimball et al. 2008), and used data mining techniques to understand a large number of stellar spectra (McGurk et al. 2010).
I am looking forward to new data for 10 billion stars expected from LSST. If you share my excitement, please take a look at Chapters 6-8 in the LSST Science Book. |