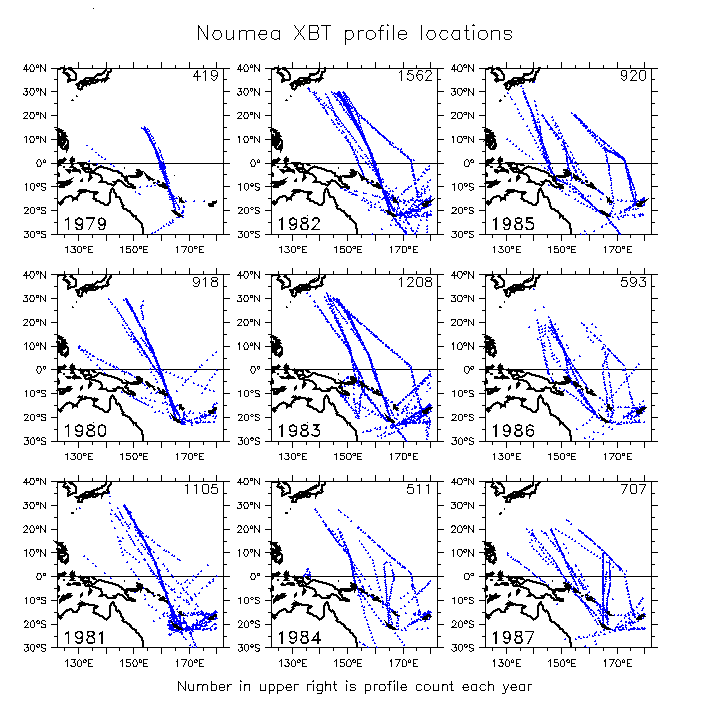
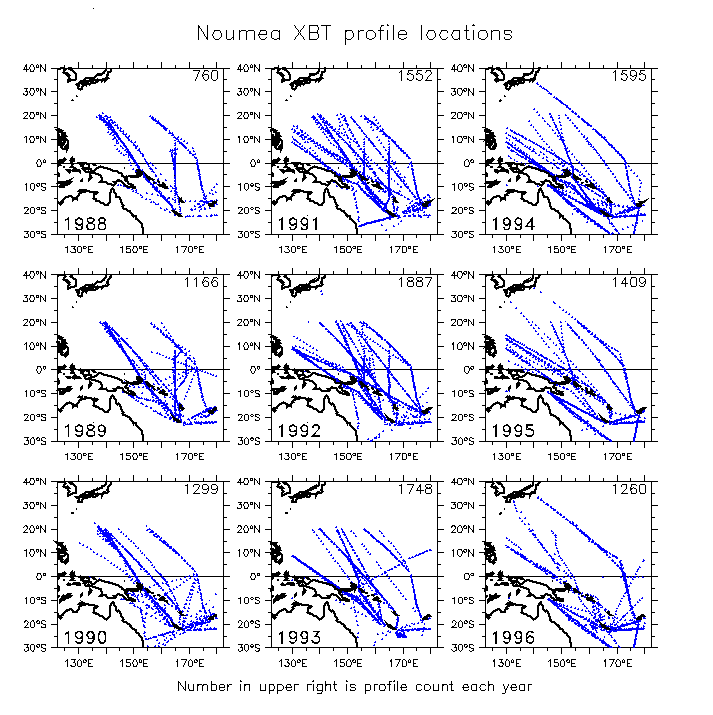
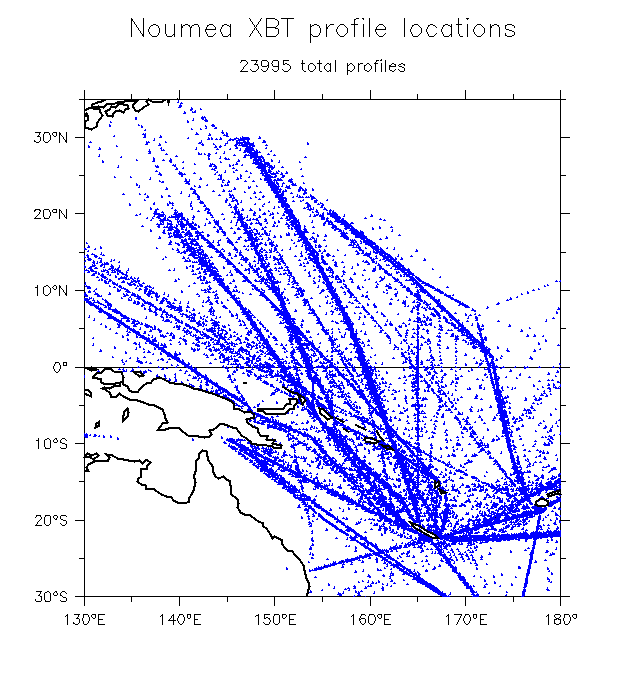
- Noumea XBT data from Thierry Delcroix. Should be complete.
- Dot maps: 1979-87 1988-96 1997-99 All years combined
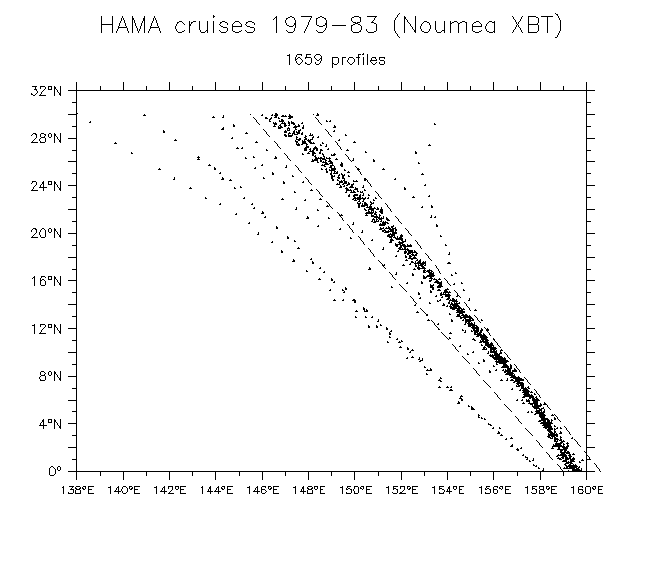
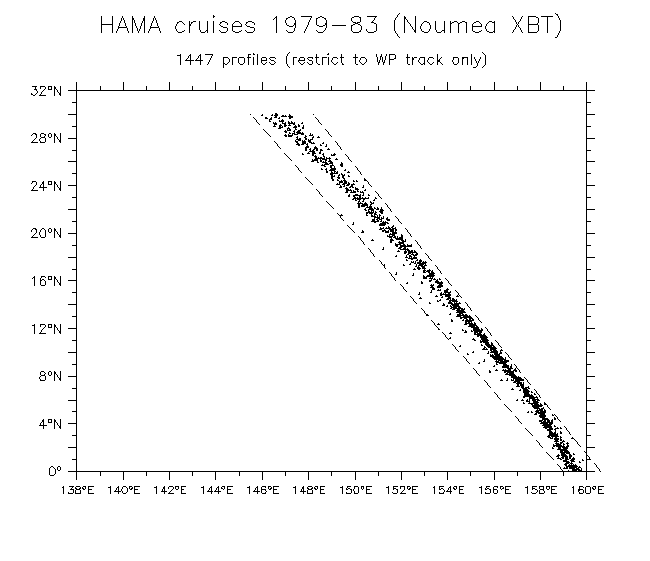
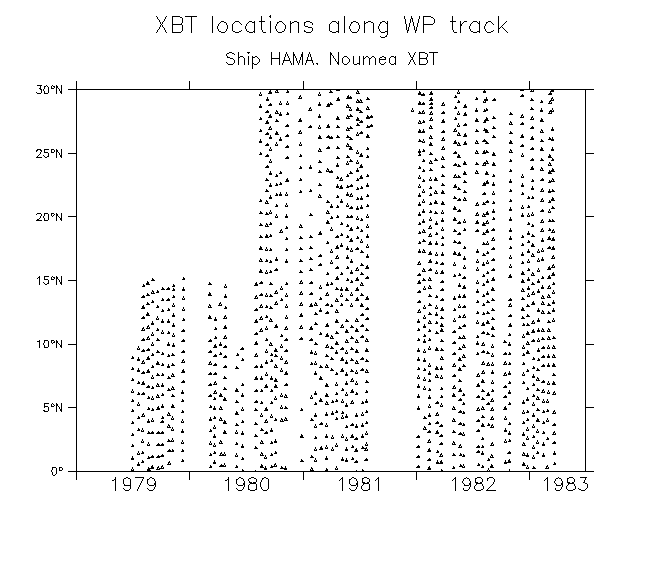
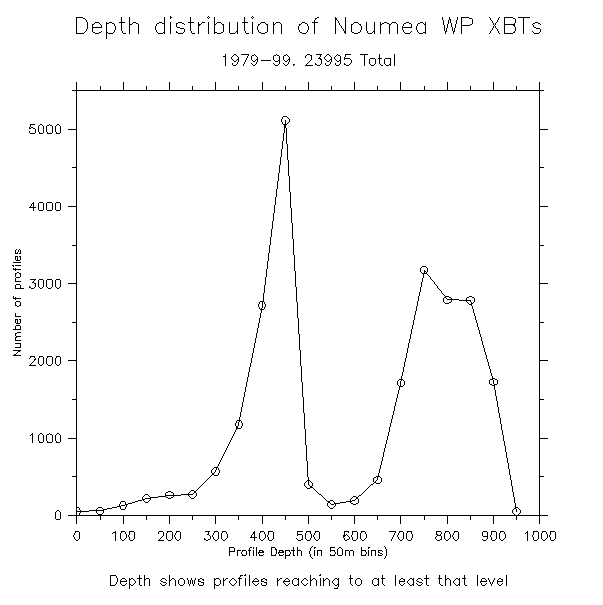
- Ship HAMA only (repeat track during 1979-84): All HAMA Selected track (y-t) profile dots on WP track
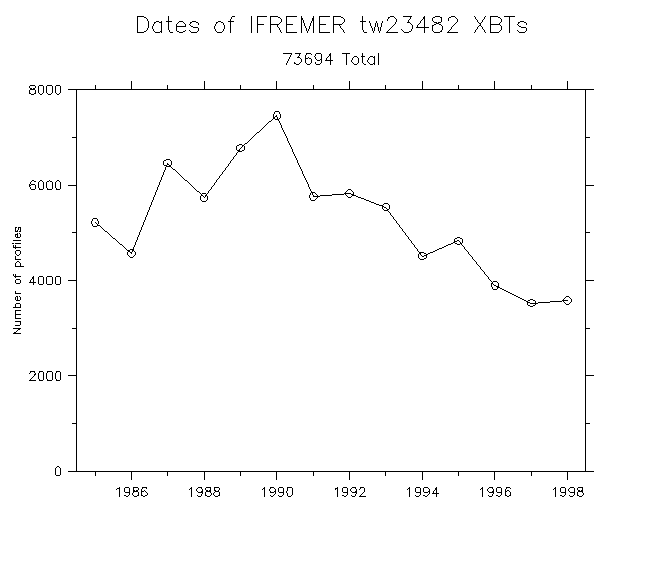
- Dates
- Depths Percent reaching at least each depth
- Other XBT data sets
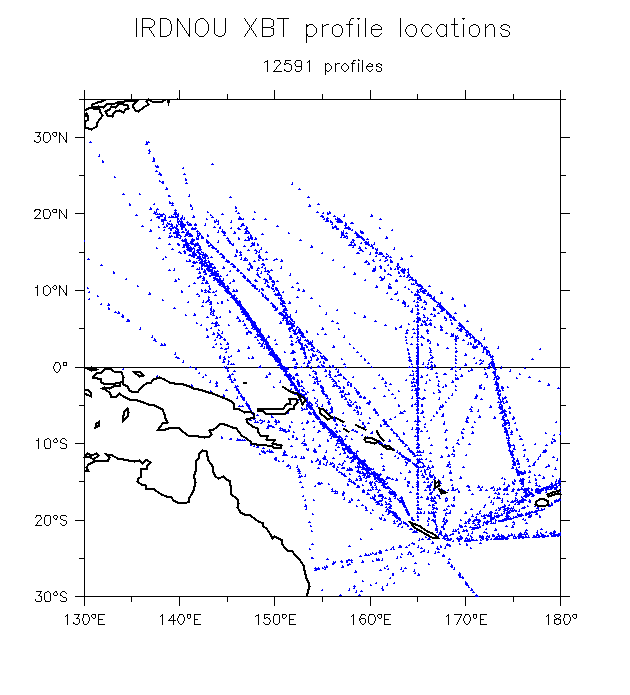
- IRD NOU data (from IFREMER): All data WP region
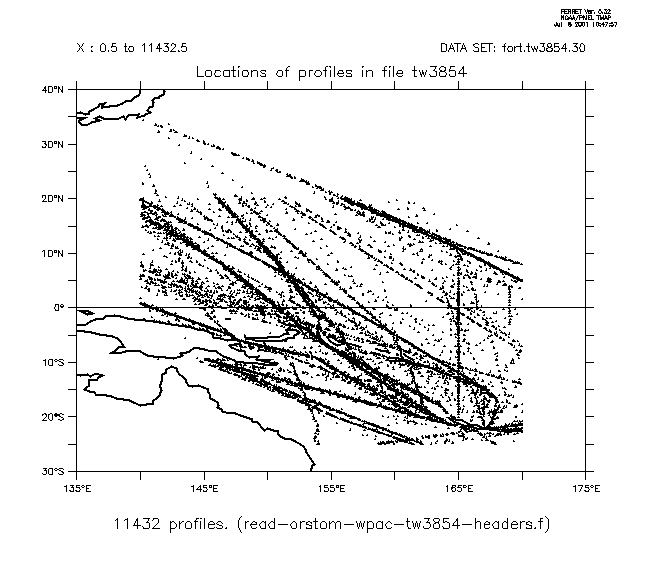
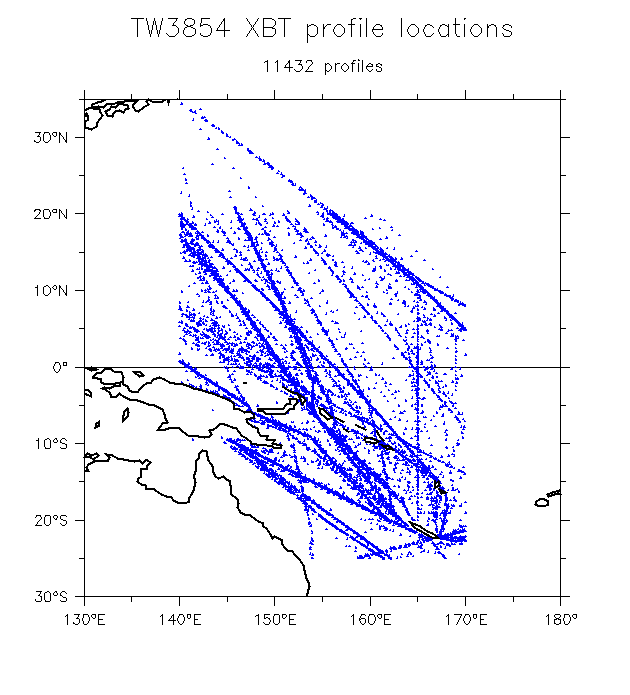
- TW3854 data (from IFREMER): All data WP region
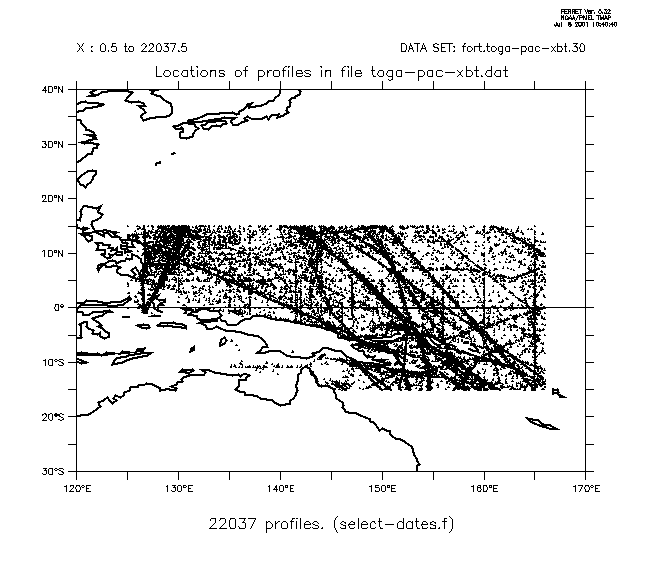
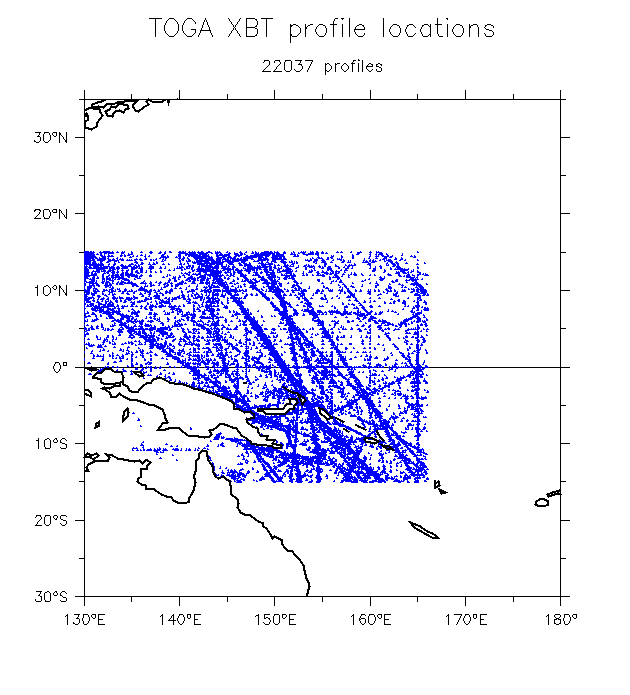
- TOGA Pacific XBTs: All data WP region
- Compare these "WP region" plots to the: data from Delcroix (Same as "all years combined" plot above)
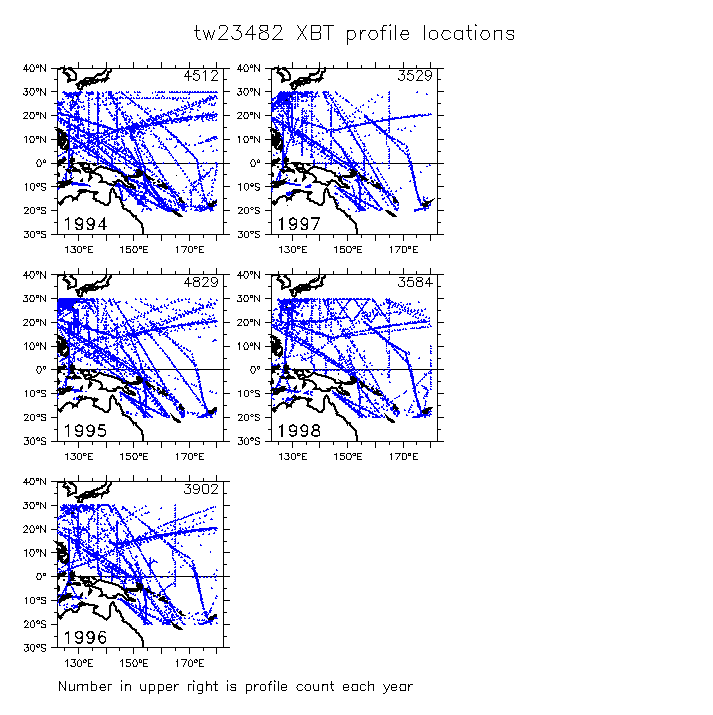
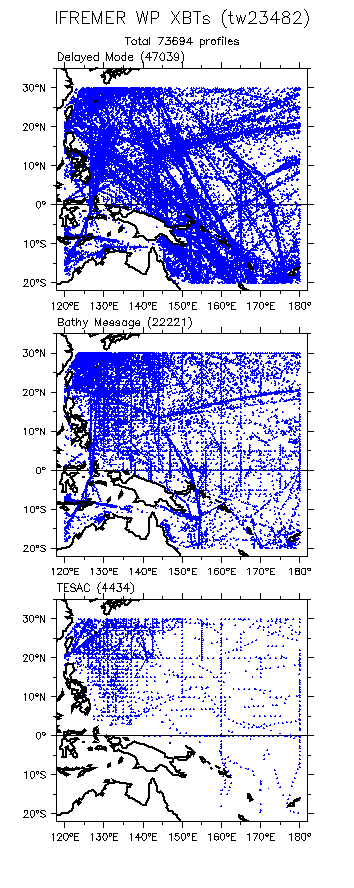
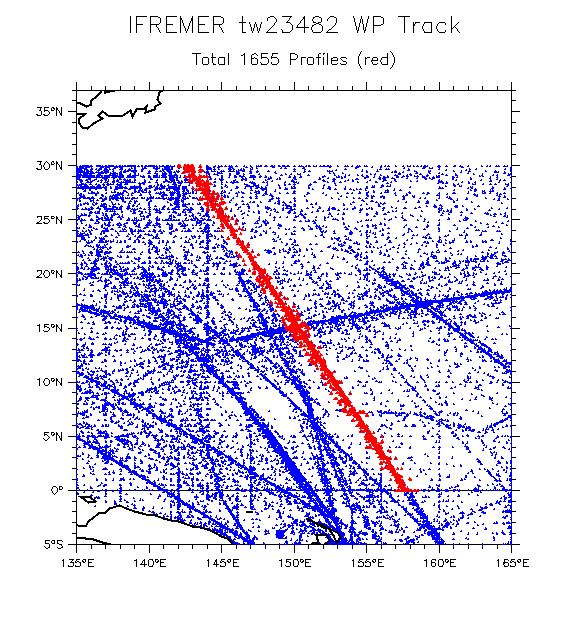
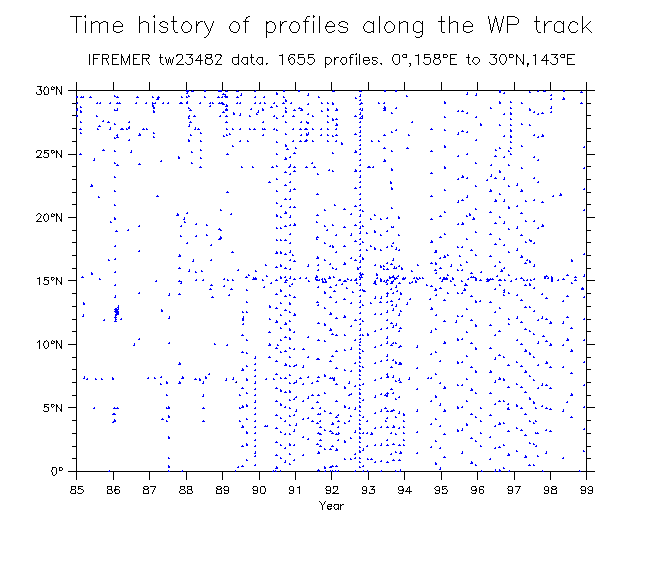
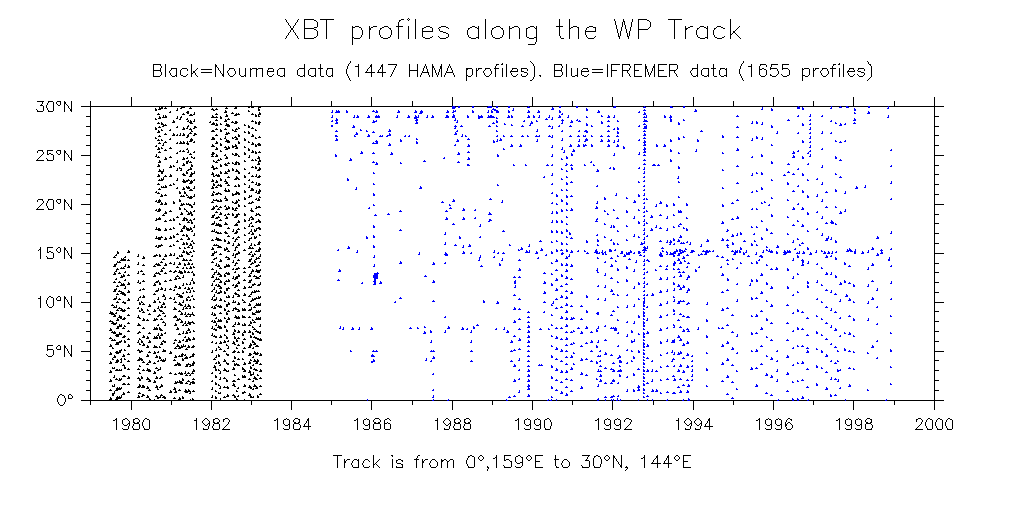
- IFREMER tw23482 data
(All ship XBTs 120°E-180°, 20°S-30°N. Bathy, Delayed, TESAC)
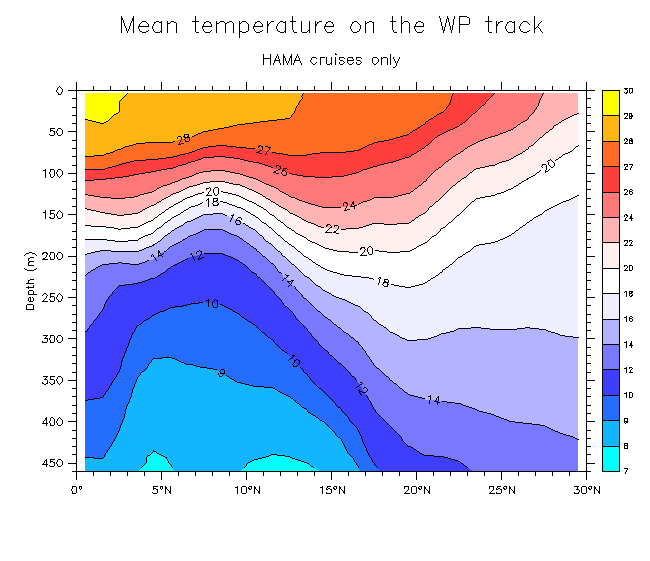
- Results based on HAMA cruises only:
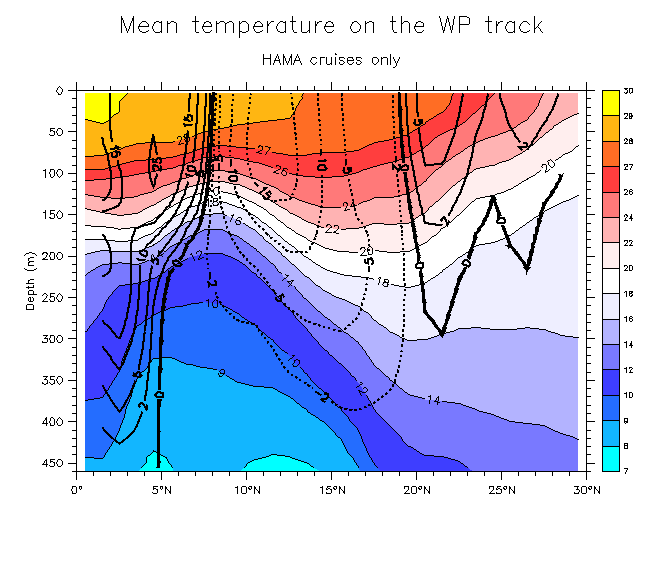
- Mean T(y,z)
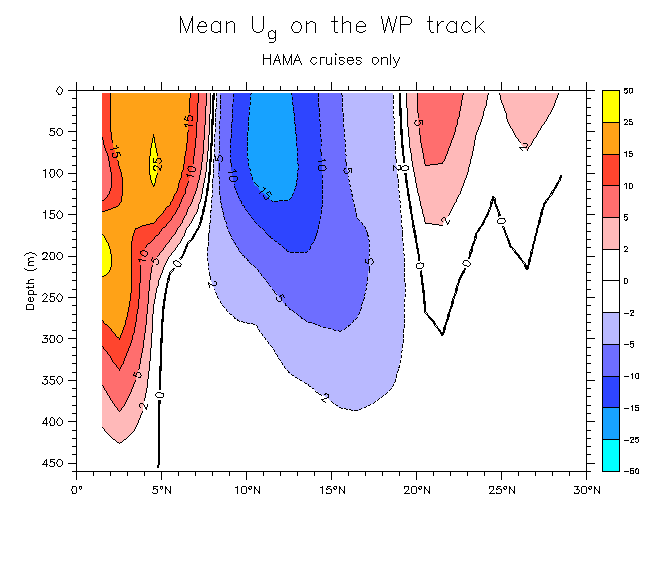
- Mean Ug(y,z)
- Overlays: Ug on T T on Ug
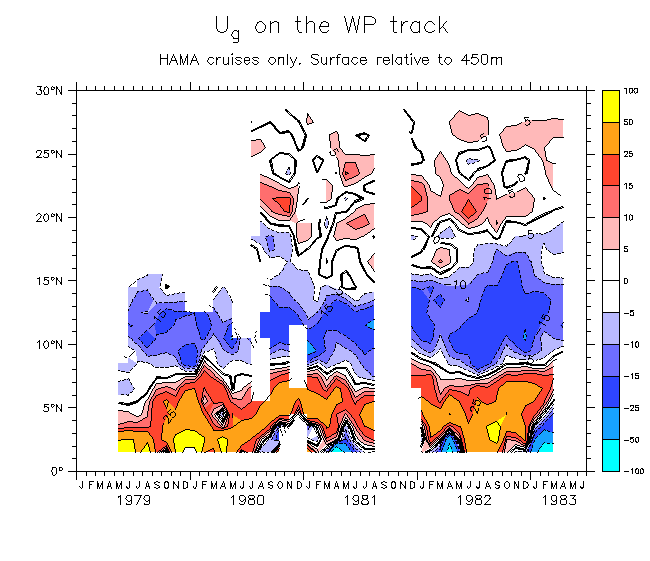
- Surface Ug (y,t)
- Results based on IFREMER tw23482 cruises only:
-
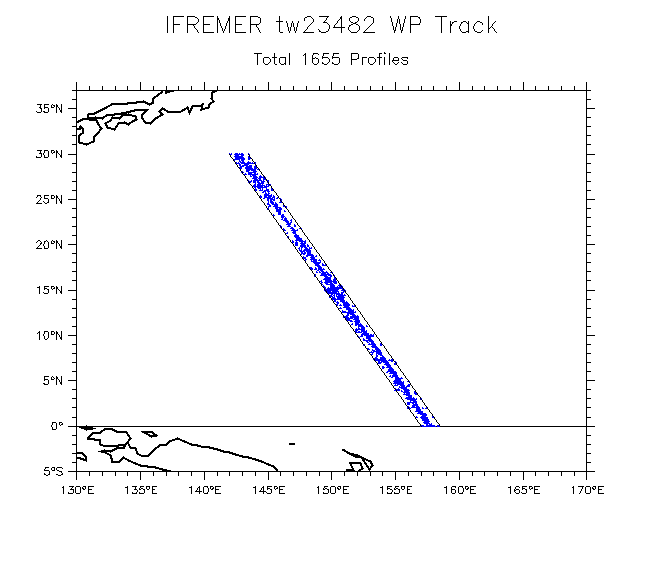
A West Pacific track to combine with HAMA cruise data:
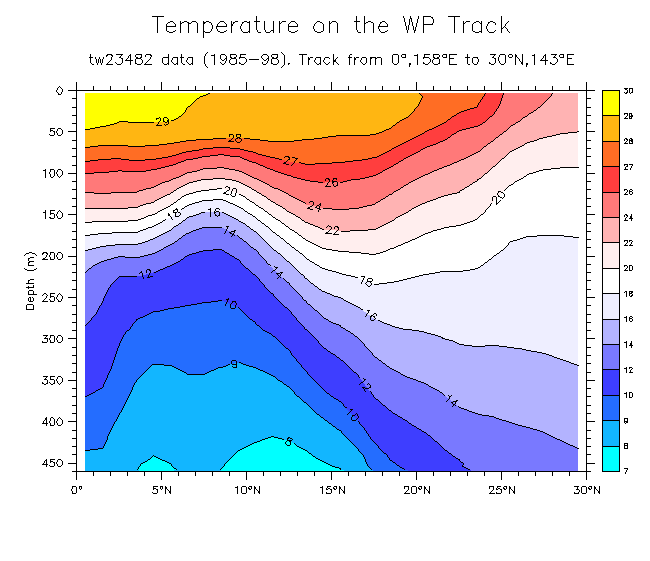
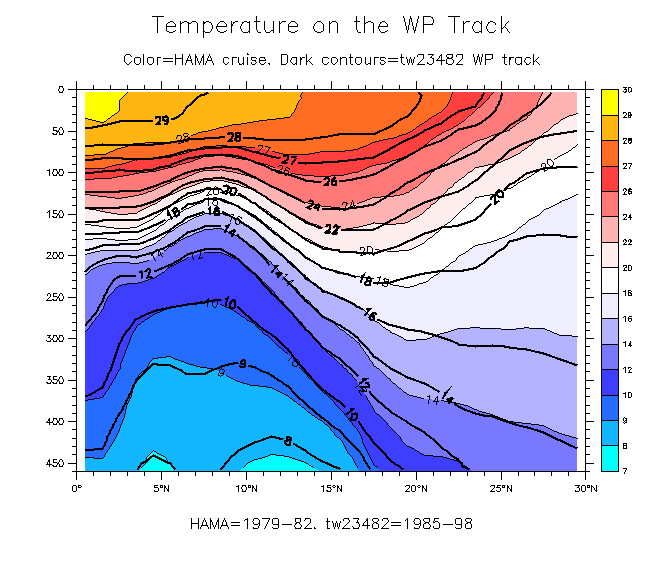
- Mean T(y,z) Compare HAMA mean T
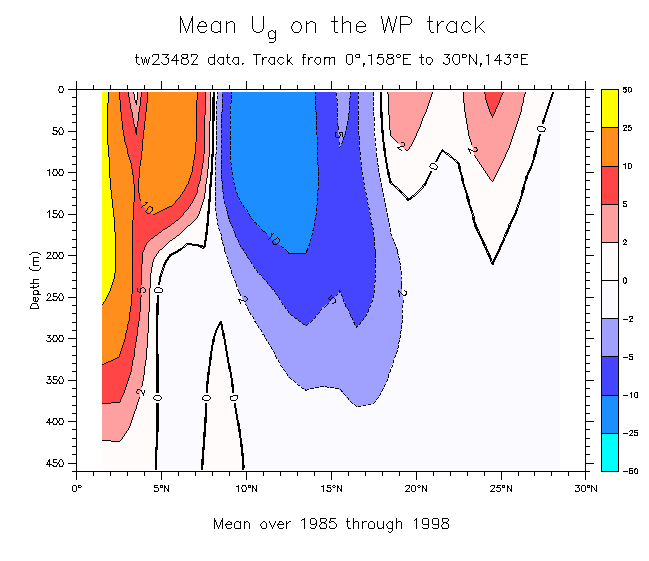
- Mean Ug(y,z)
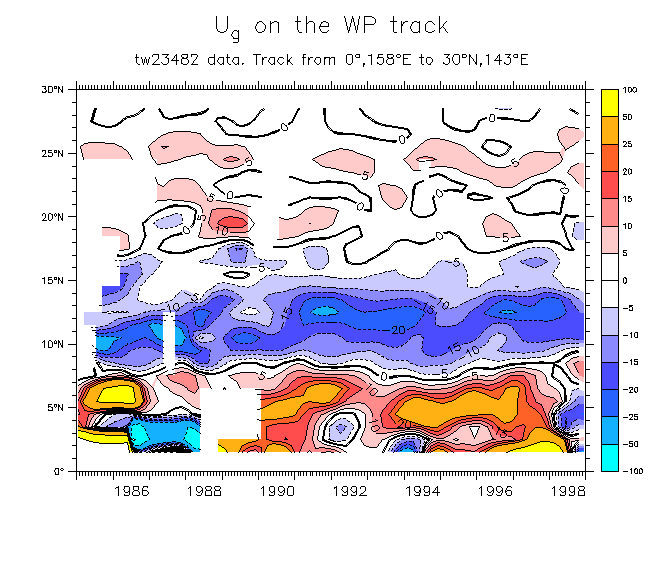
- Surface Ug(y,t) Combine with HAMA Ug
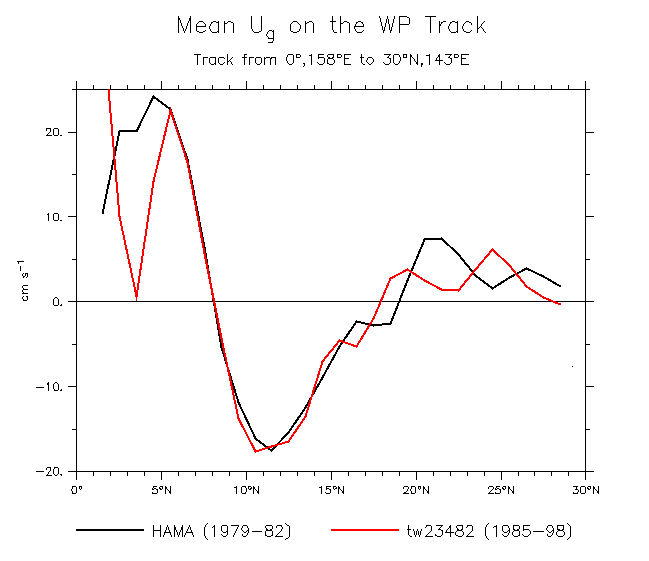
- Mean Sfc Ug(y). Compare HAMA and tw23482 data
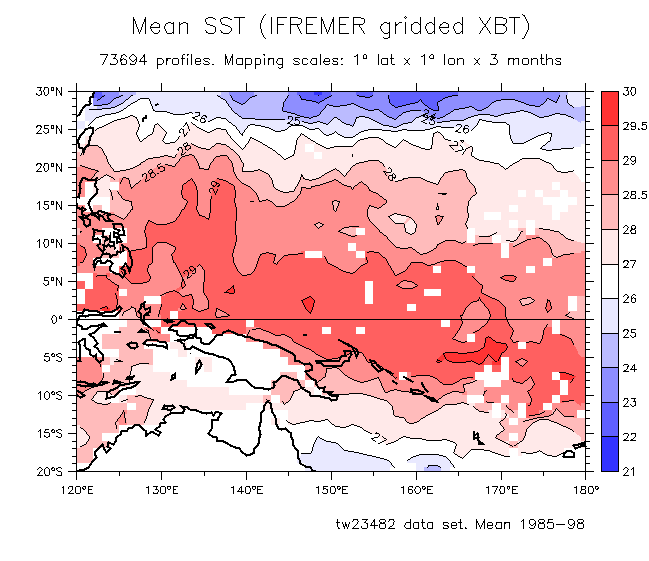
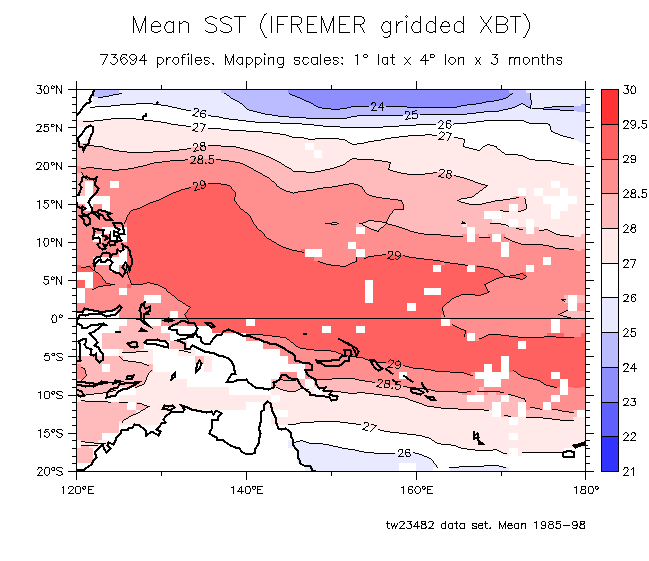
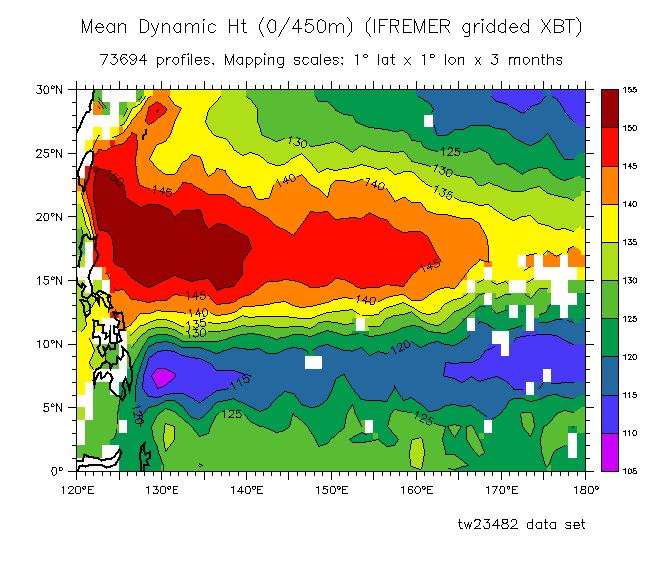
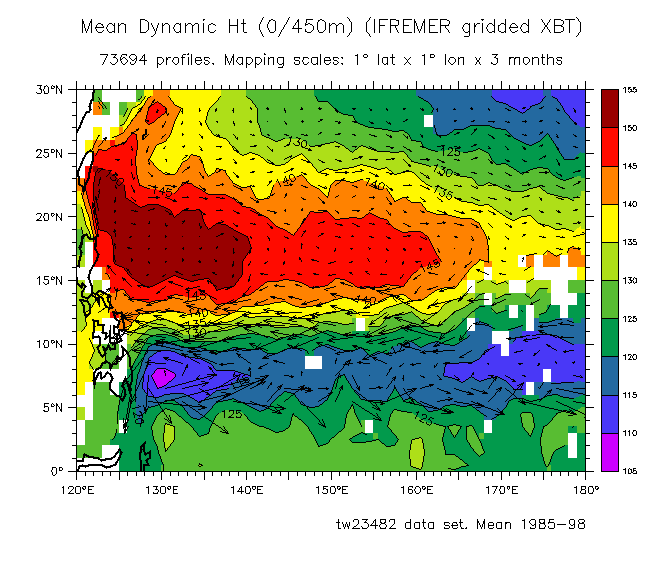
More IFREMER tw23482 results: Gridding the whole dataset
All 73694 profiles were gridded using a Gaussian weighting scheme. First, each profile was interpolated to 5m vertical resolution (0-450m). Then, at each depth level separately, the temperatures were gridded in (x,y,t) with e-folding scales of 1° lat by 1° lon by 3 months, to produce a 14-year time series. Then a mean T-S relation was used to find dynamic height and geostrophic currents.
Some early results: - Mean SST Compare gridding scales 4x1x0.25
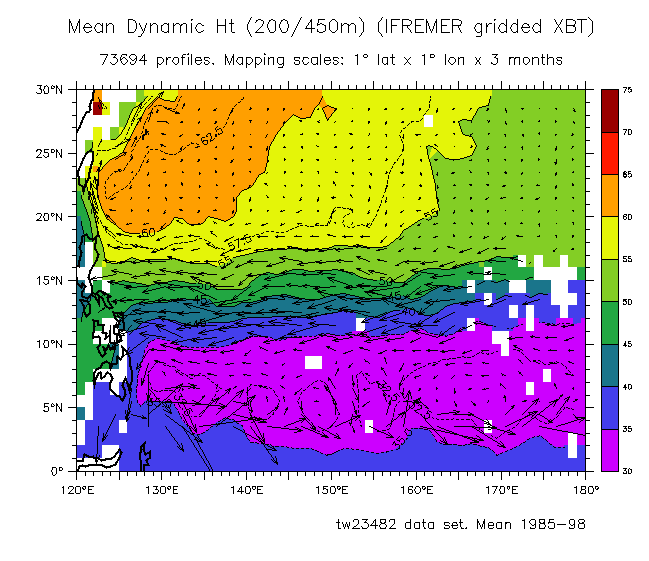
- Mean surface DH and Ug: DH Overlay vectors Zonal current
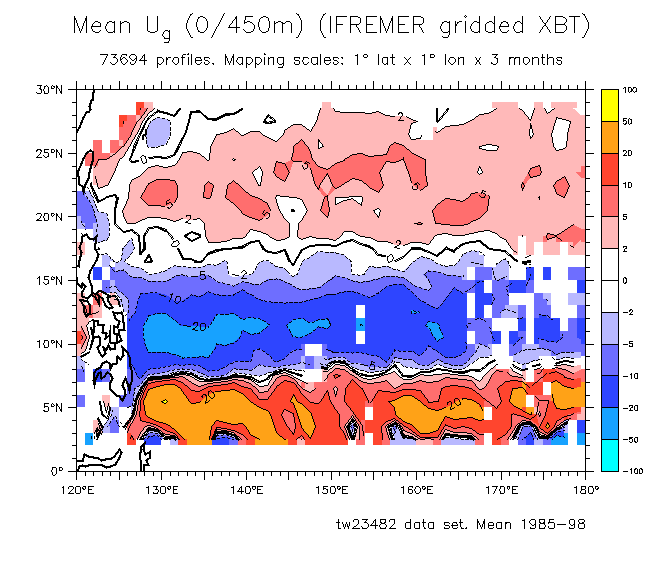
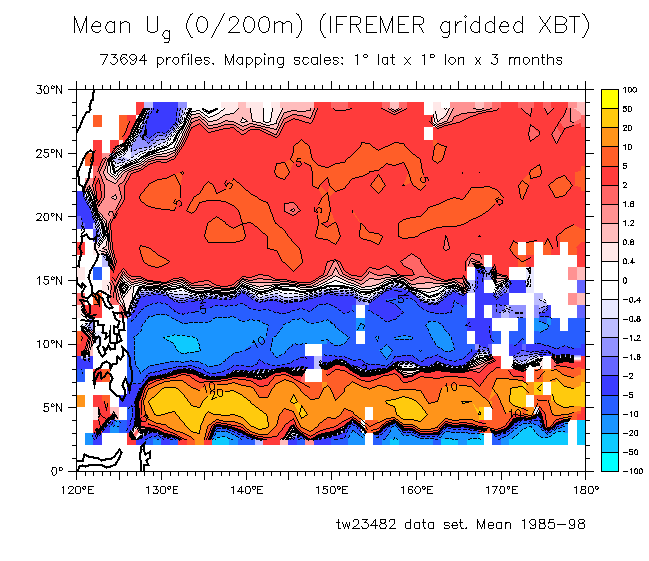
- Ug based on various reference levels: DH and vectors at 200m rel 450m Ug at 200m rel 450m Ug at 0m rel 200m
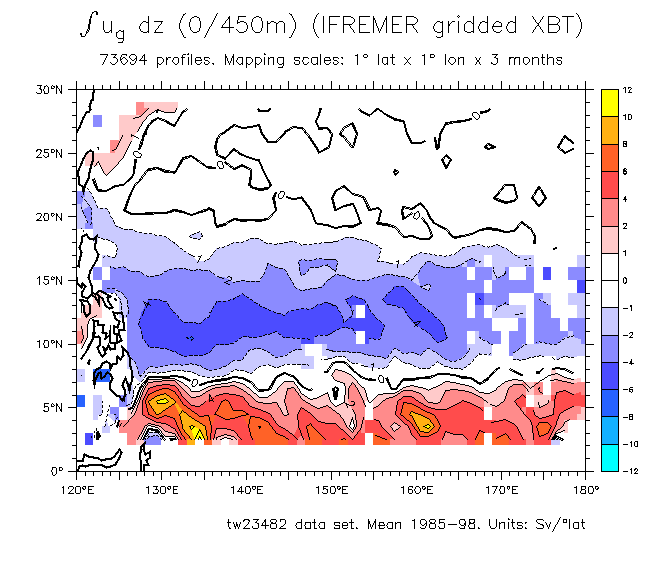
- Integrated zonal transport 0/450m
- Currents along 145°E: Shangping's model currents at 37m XBT currents to compare
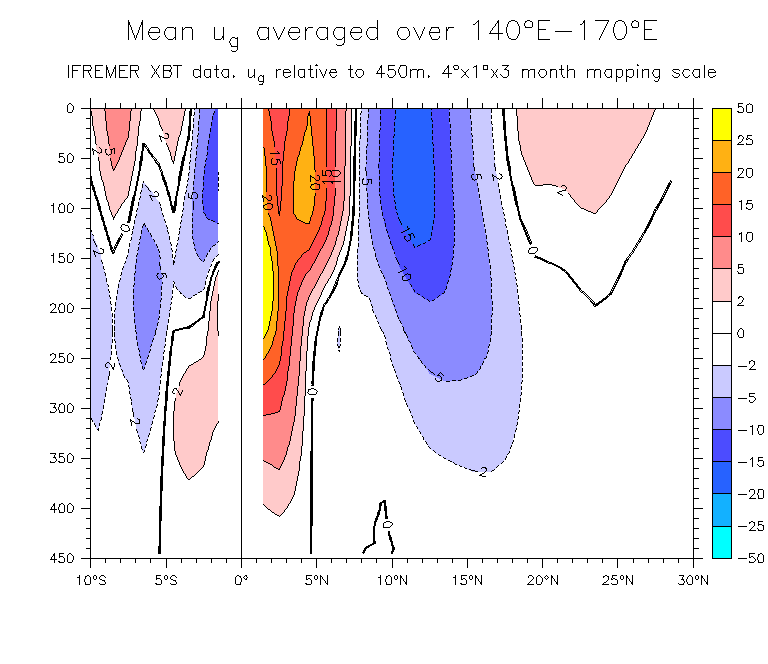
- Mean meridional section of Ug at 140°E-170°E
- Some checks (Levitus):
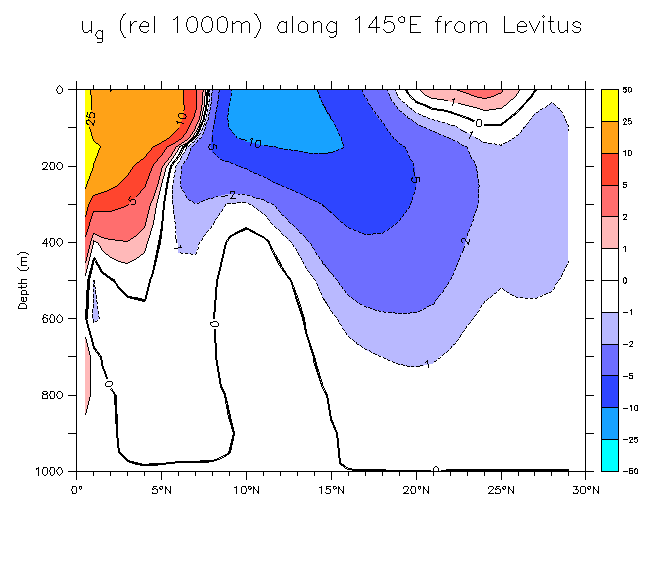
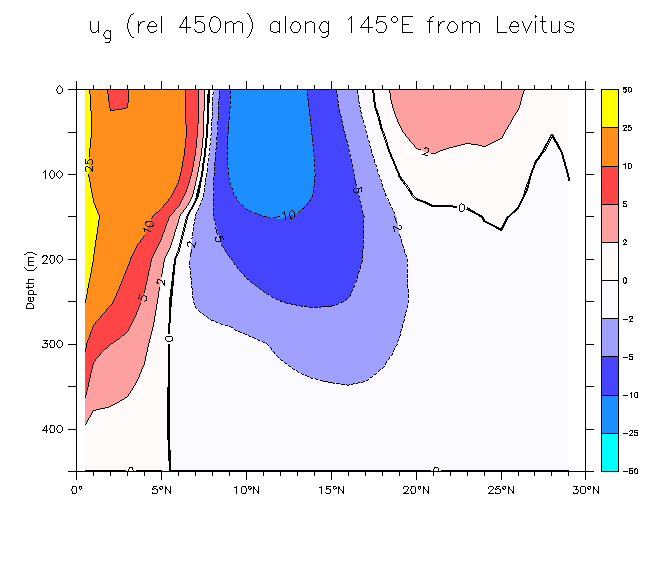
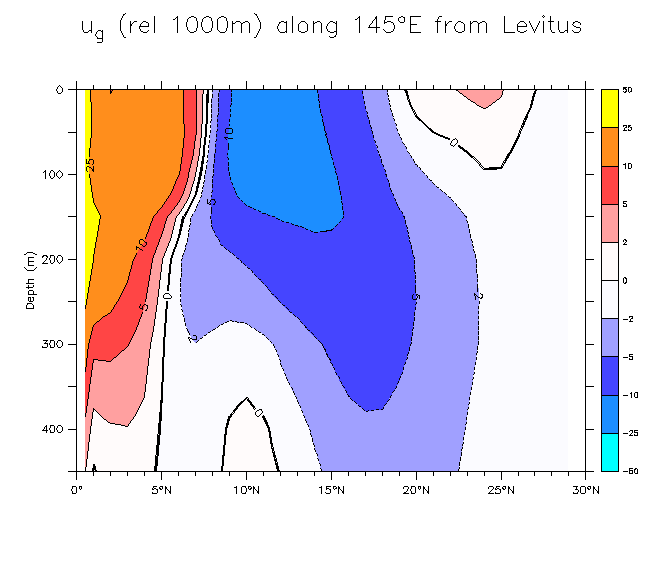
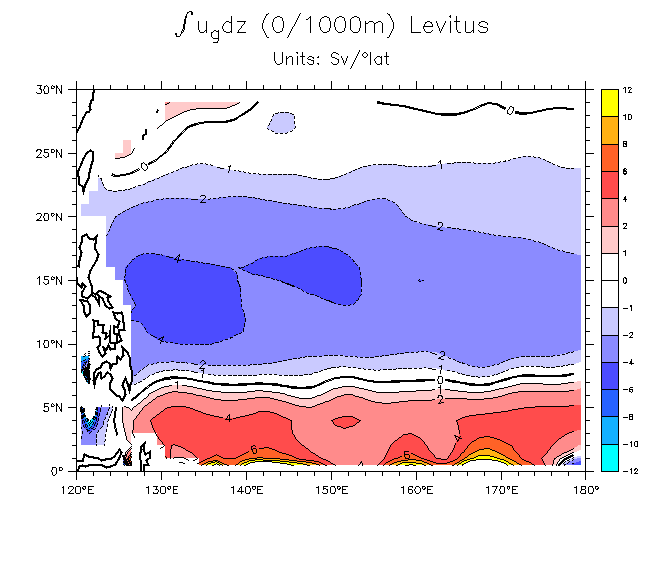
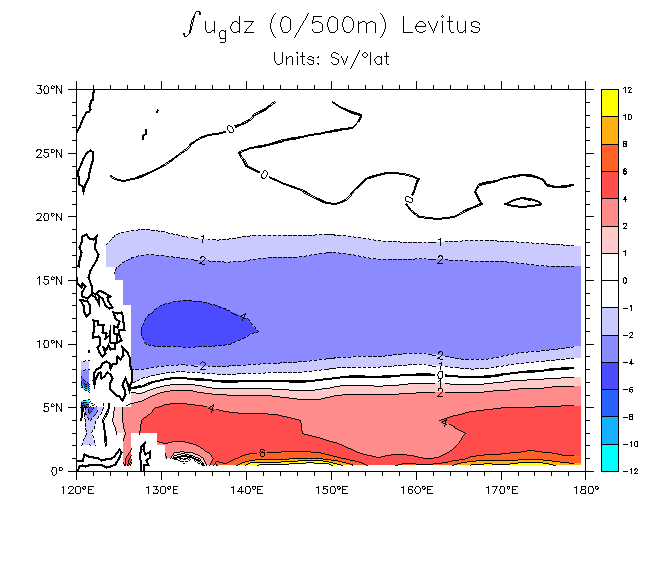
- Meridional sections of Ug along 145°E: 0/1000m 0/450m 0/450m rel 1000m Ug at 500m rel 1000m
- (x,y) sections: Ug at 500m rel 1000m Zonal transport rel 1000m Zonal transport rel 500m
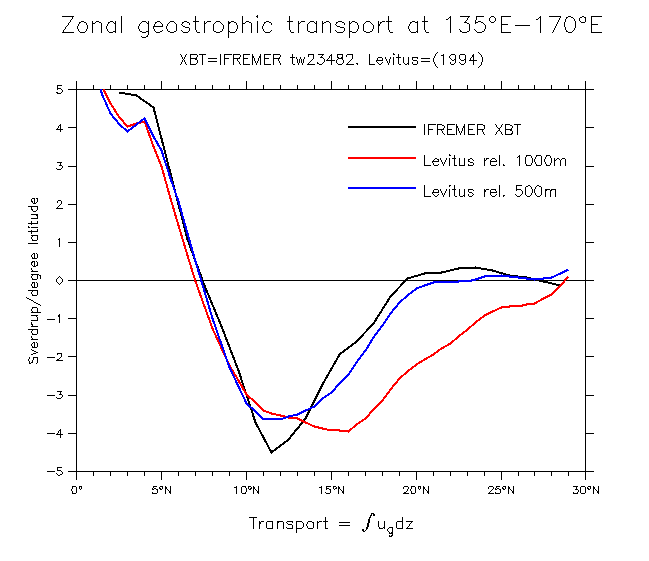
- Compare zonal transports at 135°E-170°E
-> The main difference between the XBT results and Levitus is the reference level N of about 15°N: there is westward flow below 450m that is not accounted for in the XBT fields. This will make the XBT STCC appear stronger than it actually is, by about 2-4 cm/s between 14°N-22°N.
Are these currents in Sverdrup balance? Go to the new page
The main discrepancy from Sverdrup balance turns out to be on the equatorward side of the NECC, where the XBT data consistently show the transport to be eastward all the way from the NECC to the equator, but the Sverdrup transport
shows a large amplitude westward current equatorward of the NECC. (This is due to the positive curl associated with windspeed increasing as southeasteries cross the SST front as distorted by tropical instability waves).
Since this is not really related to the subtropical countercurrent, and because it ended up producing a large number of plots, I put this stuff on a separate page. Go there
Back to Kessler main figures page
Back to Kessler home page
 |
Dr. William S. Kessler
NOAA / PMEL / OCRD 7600 Sand Point Way NE Seattle WA 98115 USA |
Tel: 206-526-6221
Fax: 206-526-6744 E-mail: william.s.kessler@noaa.gov |
| See also: | Kessler home page Kessler publications PMEL home page | |