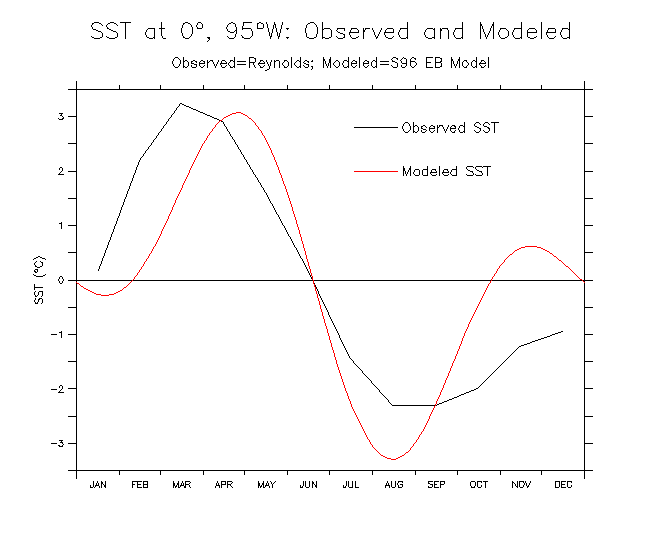
Black: 1984-93 average annual cycle of Reynolds blended satellite-in situ SST.
(Same data as shown in Fig.6). Red: SST from the S96 model, calculated according
to equations (1) and (2) in S96. (Same as in Figs.8 and 9). Note that in the
S96 algorithm, the variance of model SST is forced to be the same as that of
observed SST.
Go back to text. Go back to figure list