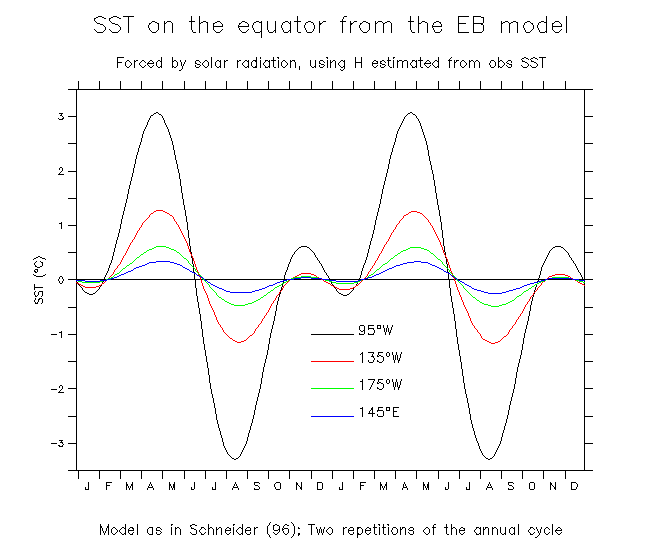
As Fig.8 but cuts at 4 longitudes, showing the second (semi-annual) peak. Go back to text. Go back to figure list