Stellar Density
Question 4:For these low-metallicity and high-metallicity samples, plot and compare their differential r band magnitude distributions (i.e. the number of sources per unit magnitude, in small, say 0.1 mag wide, r bins). What do you conclude? How would you numerically describe these curves (i.e. what kind of functional form for the fitting functions would you choose)?
For this question we take the our data from question 2. Then, instead of counting the number of stars as a function of Z, we count the number of stars as a function of r band magnitude. This question will help us analyze differences between the two samples, and in conjunction with question 5 allow us to establish limits for future surveys that will allow us to probe the entire halo of the galaxy. The r magnitudes span a range from 14 to 21, so a good bin size is 0.1 magnitudes per bin. As before, we count the number of stars in each bin. Then we plot the two metallicity samples together. Your plot should look like this:
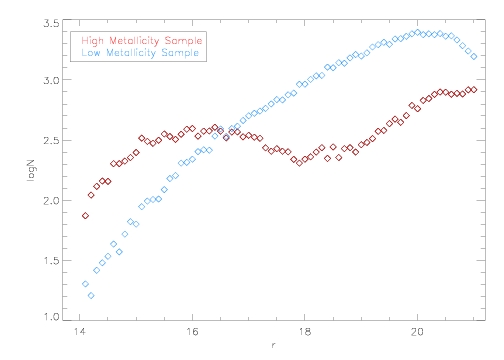
Note that the high metallicity sample has a roughly constant distribution of stars for all magnitude ranges, but that the low metallicity sample has very few stars at low r magnitudes but increase in counts dramactically for higher r samples. This is because many of the stars with low metallicity are in the halo, and are therefore further away from us and appear with fainter magnitudes. Also note the steep increase of the low metallicity sample for small r magnitudes- this will be important for formulating magnitude requirements for future surveys.