Stellar Density
Question 2: For subsample with 0.2 < g - r < 0.4, separate stars into low-metallicity sample, [F e/H ] < -1.0, and high-metallicity sample, [F e/H ] > -1.0. Compare their ln (Rho) vs. Z curves. What do you conclude?
This is a continuation of question 1, and will help us understand why the density of stars did not continue the sharp dropoff. We use the same set of data, with 0.2 < g - r < 0.4. But now we also seperate the stars based on metallicity. Stars with [Fe/H] > -1 we will count as high metallicity, while those of [Fe/H] < -1 will be low metallicity stars. We would expect the higher metallicity stars to be near the disk of the galaxy and decrease quite rapidly with the scale height. Now, we do the same procedure as in question one, only now we bin the scale height Z for both samples of metallicity. We want to count the number of stars in each 500 parsec bin for both the high and low metallicity samples, and plot ln(Rho) vs. Z for both samples on the same graph to see their distribution. You're plot should look like this:
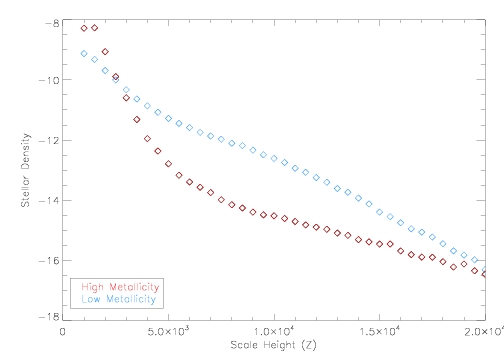
This plot shows us where we start to question our previous plot in question 1. Note that at 5 kiloparsecs the high metallicity sample stops decreasing rapidly, and takes a sharp bend and starts decreasing at a much more gradual rate. So we should be sceptical of our plots after 5 kiloparsecs, but the result is much clearer when we seperate out the metallicities. The reason for the deviation in the rate of change is that the halo stars are starting to contaminate our sample. Most halo stars are low metallicity, but some do not, and we see their presence in the samples when seperated by metallicity.