If you are not interested in my blog and just want to view the latest earthquake activity you can you can link to the daily histogram and hourly histogram of earthquake counts here.  You may need to refresh your browser if you have looked at them before and you should read my footnote [1] to understand what is being shown.

On December 15, the Consortium of Ocean Leadership announced the release of preliminary data from seismometers on the National Science Foundation’s Ocean Observatory Initiative (OOI) cabled observatory (announcement here ) through the Incorporate Research Institutions for Seismology (IRIS) Data Management Center (DMC). The cabled observatory was installed by the University of Washington (UW) in a marathon effort this past summer but this is the first data to be released for public consumption. It has been a decade since I was involved in the seismic monitoring component of a prototype observatory experiment on the Endeavour segment of the Juan de Fuca Ridge, so the release real time data from Axial Seamount was quite exciting.  I am even more excited now that I have had time to look at it; the data shows that the volcano is restless and lends support to the growing expectation that an eruption may occur fairly soon.

AxialCabledNetworkMap

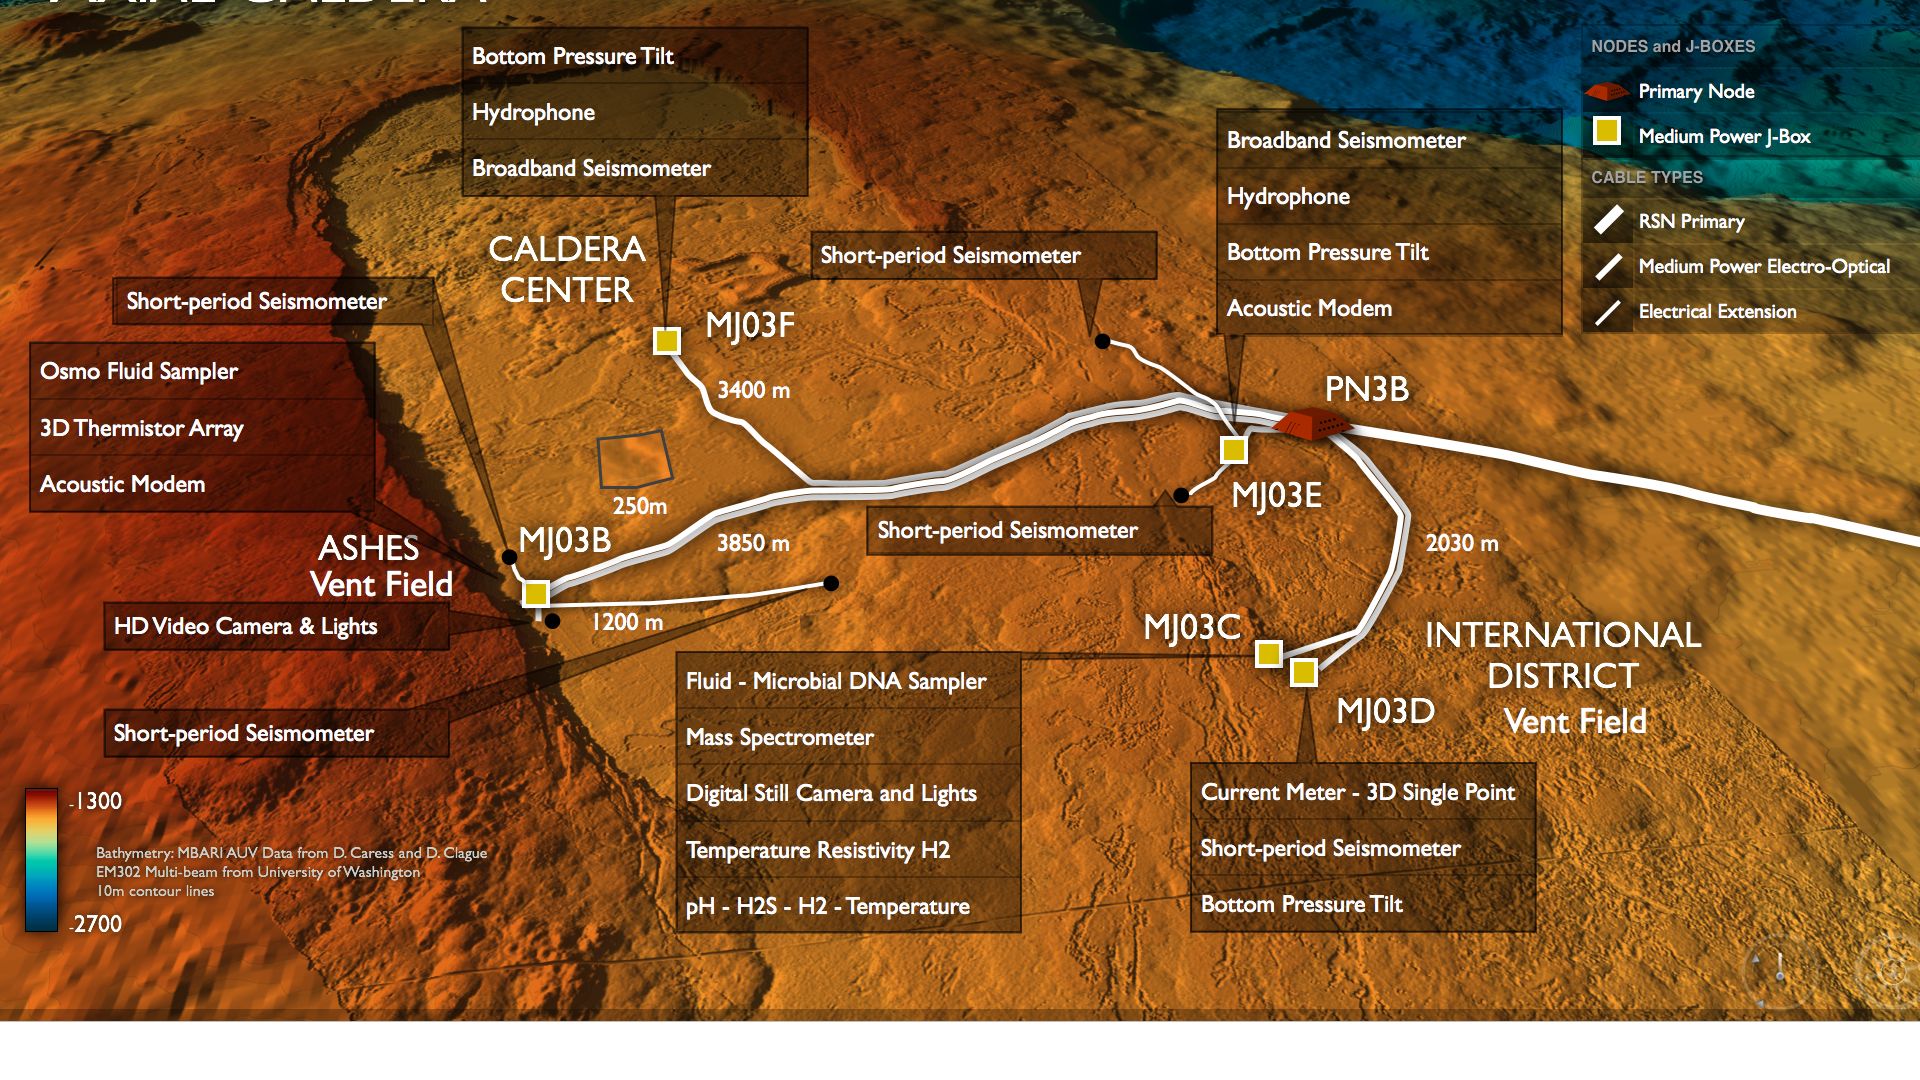
Configuration of the OOI cabled observatory on the summit of Axial Seamount (the figure was created for the OOI by the UW Center for Environmental Visualization and is available on the OOI website)

The cabled seismic network at Axial Seamount comprises 2 broadband and 5 short period seismometers in and around the summit caldera and another broadband 25 km to the southeast at the foot of the volcano.   The seismometers record ground motions at a sample rate of 200 Hz but because of the US Navy’s concerns about the potential of the seismic network to record submarines, the initial live stream was limited to 8 Hz.  Live streaming of the 200 Hz data commenced on January 7 and at present data has been backfilled to mid-November with several gaps of a few days; one is due to a network outage and others due to Navy testing. As operations continue, the 8 Hz stream will remain live, but at times the Navy will divert the 200 Hz data so that it can be screened for signals of interest before being either released or, hopefully not too often, embargoed. The 8 Hz data will be fine for many seismic applications but for my interest in monitoring the microearthquakes on the volcano, the 200 Hz data is important.

The OOI management has been cautious about releasing pre-commissioned data because they would prefer first to ensure its quality. However, in practice they do not have the staffing or expertise to evaluate all the data they are collecting so releasing it to the community is a pragmatic approach to quality control. Within a few days of the data coming on line, Anne Tréhu at Oregon State University took a quick look.  She noted that overall the data is encouraging and of high quality, but also identifying some problems. The 200 Hz data streams included regular data gaps (13 minutes was missing every half an hour), a problem that is not present in live-streaming data and which has now been resolved for diverted data.   More recently, Paul Bodin in the UW Department of Earth and Space Sciences has identified a timing problem with the two broadband seismometers at Axial summit. Their recordings of earthquakes are offset a few seconds from nearby short period seismometers. The cabled observatory engineers are presently working to rectify it (Note: the timing problem was successfully resolved as of January 23, 2015). These kind of teething problems are to be expected with any new seismic network; any network or field seismologists should feel very lucky if they have never had to wrestle with data gaps and timing problems! By releasing the data, the OOI has empowered seismologists who care about the program to get engaged and provide constructive input to improve the quality of its data.

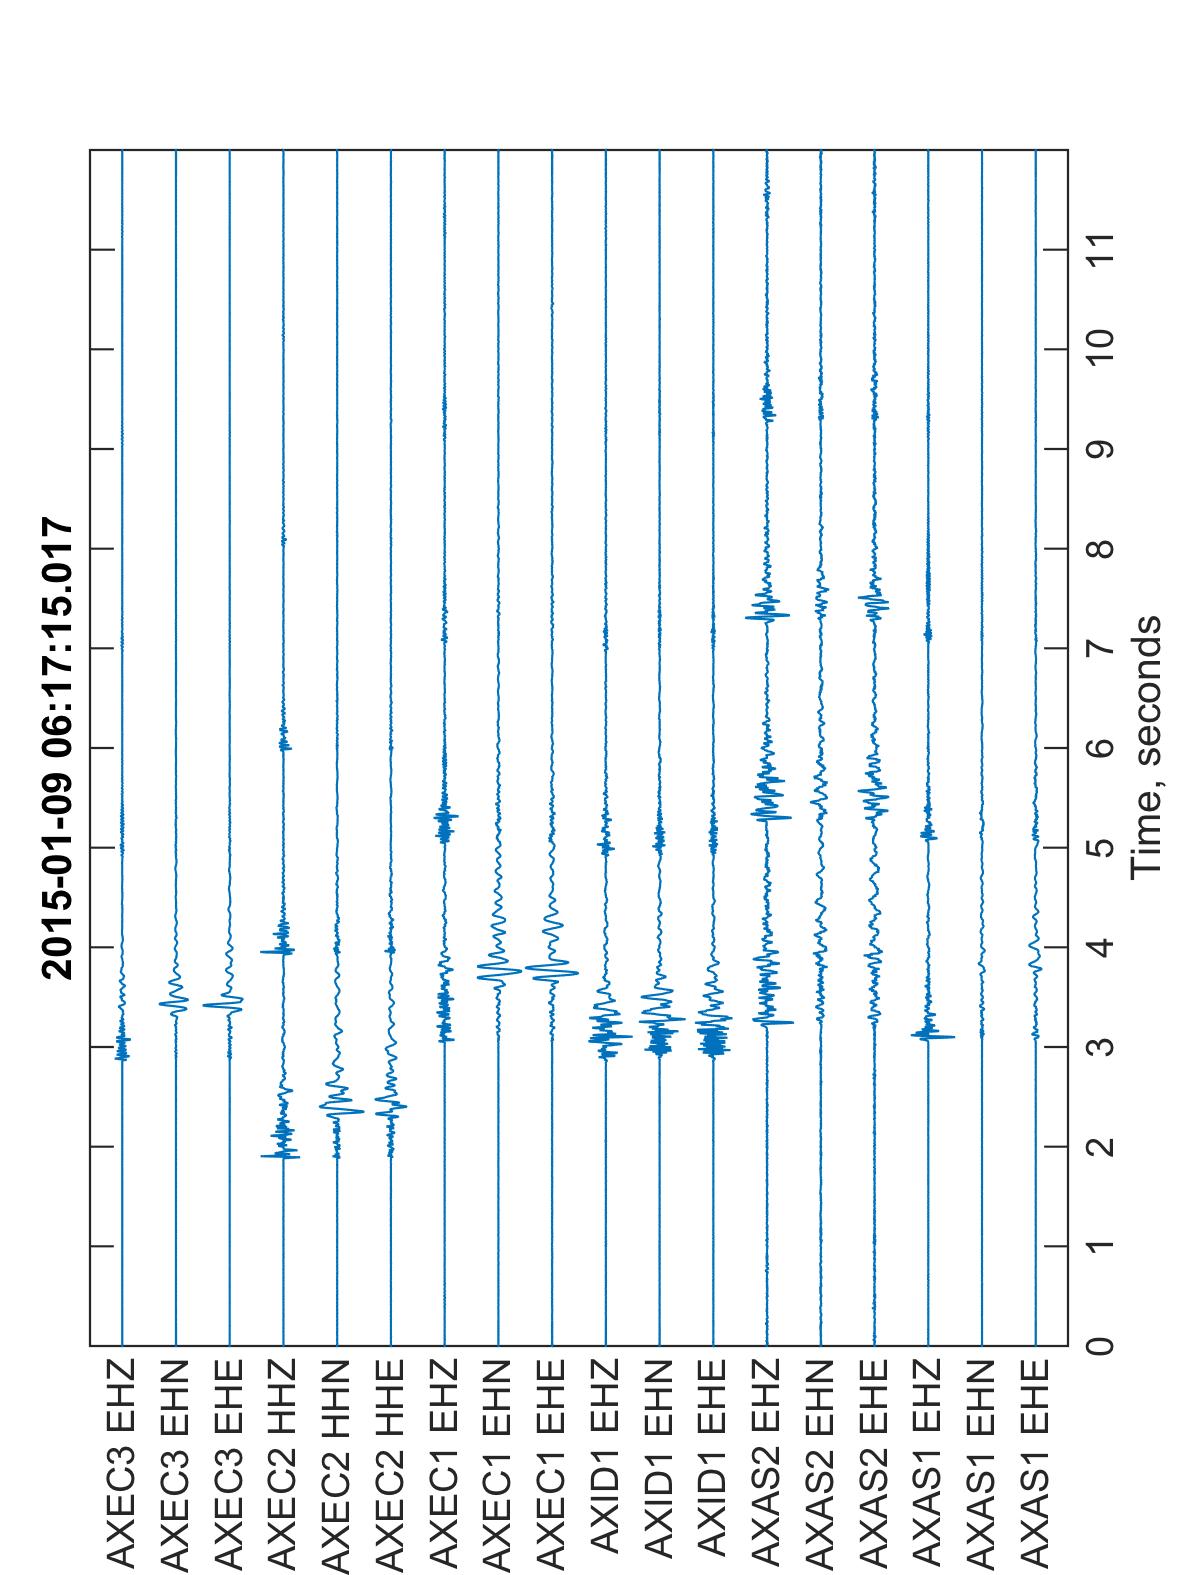
Example of a microearthquake recorded by the OOI cabled seismic network at Axial Seamount.  On the EHZ (vertical) channels up to 4 water column reverberations of the P-wave are visible.  On the EHN/EHE (horizontal) channels the S waves are characterized by higher amplitudes and lower frequencies.

In the past when I analyzed marine microearthquake data, my work started with the laborious and time consuming process of copying files of seismic data onto my computer, setting up and checking a relational database to organize the seismic time series and metadata, and installing complex software to access the data from my preferred analysis software (MATLAB®). However for this project I have discovered a really nifty piece of software created at the IRIS DMC called Iris Matlab Fetch (irisFetch.m) which uses java commands to directly bring chunks of data directly from the DMC into Matlab. It is not super fast and I can only grab a few hours of data at a time but it enabled me to start playing happily with the data within an hour of sitting down at my computer.  Like Anne Tréhu and Paul Bodin one of the first things I noticed was the high quality of the waveforms.

histogram_earthquakePrelimDaily

Daily histogram of earthquake count at Axial Seamount. Click on the image (and reload the resulting web page) to see an updating version of the histogram [1].

As part of his PhD work, my former student Robert Weekly (now an employee of the IRIS DMC) created some Matlab software to automatically find and locate earthquakes recorded by the Keck seismic network we operated on the Endeavour segment of the Juan de Fuca Ridge.  It will take a while and some additional coding to get this fully operational on the Axial seismic network so in the short term I have focused on just implementing the portion of his software that finds the impulsive signals associated with earthquakes. While the results are preliminary and will be for a while, they show that the volcano is currently very active with an average of 100-200 microearthquakes detected each day. These levels of seismicity are comparable to those seen on Axial Seamount prior to its last eruption in 2011 and on the East Pacific Rise at 9°50’N about a year before it erupted in 2005-6. This past summer Bill Chadwick, Scott Nooner and colleagues documented that Axial Seamount is inflating at an unprecedented rate of ~60 cm/yr. Based on its past behavior, they argue that the next eruption may occur as early as sometime this year (blog post here). While nobody can be sure what Axial Seamount has is in store, the earthquake data is consistent with these predictions.

The OOI plans to release additional selected pre-commissioned data from the RSN with a tentative release date of January 30 (announcement here). It is going to be interesting to see the live streams of bottom pressure, tilt and hydrothermal time series to get a more complete picture of what the volcano is up to.

[1] Footnote: The daily and hourly histogram plots show preliminary estimate of the number of earthquakes detected by at least 3 seismometers.  To detect events, the data is first filtered with a 4 Hz high pass filter and a trigger is registered every time the RMS amplitude in a moving 0.5-s-long window exceeds that of a 10-s-long window immediately before by a factor of 2.  Events are identified when triggers are observed on at least 3 stations and 5 channels within a 1-s-long window.  Events are classified as earthquakes (rather than fin whales) if on average the waveforms have more power in the 5-15 Hz band than the 15-30 Hz band in a 2-s-long window following the trigger.  There are several long data gaps and quite a few smaller ones when no data is available and and other times when regular gaps that are offset in time between stations  limit the number of recording stations at a given time and thus the ability to detect events.

As an oceanographer who gets chronically seasick I have spent most of my career finding research opportunities and excuses that help me avoid going to sea.  For past 3 years, however,  I have willingly ventured out in the middle of summer on the R/V Oceanus from Newport to deploy ocean bottom seismometers for the Cascadia Initiative, an ambitious 4-year community experiment funded by the National Science Foundation to blanket the Cascadia subduction zone and Juan de Fuca plate with autonomous seismic recorders.  So why have I gone to sea?

First, from the pragmatic point of view it pays my salary which in a time of diminishing science budgets (in dollars adjusted for science inflation) in NSF’s Division of Ocean Sciences is nothing to be sneezed at.  Secondly, I have discovered that as I grow old I no longer get quite as seasick particularly if I only venture into open waters in July/August.  Third the Cascadia Initiative is a really neat experiment that represents a new way of doing business and a science model that might just set marine seismology out of the doldrums.

Cascadia Array

The Cascadia Initiative Experiment (Cascadia Array) and other geophysical observing systems in the Pacific Northwest (Created by the Center for Environmental Visualization).

Traditionally the Marine Geology and Geophysics (MG&G) Program has used NSF’s vaunted peer review system to fund small groups of scientists or even individual scientists to do seismic experiments at sea. Seagoing work is expensive and so as the purchasing power of  MG&G’s budget has declined fewer and fewer experiments have been funded.  As the number of experiments declines, the facilities that support seismic experiments, namely the R/V Marcus Langseth seismic vessel and the Ocean Bottom Seismography Instrument Pool, are no longer fully utilized.  They become more expensive per experiment, further adding to the strain on budgets.  More worrisomely is the effect of declining budgets on the health of the community and particularly the availability of funding for young scientists.  It is difficult to get an expensive experiment funded with no track record and so the “play it safe” outcome in an era of declining funds is to fund established scientists and allow attrition (from retirements and scientists going in new directions) to shrink the existing community.  This is unhealthy.

The Cascadia Initiative is a new approach to marine seismology experiments that follows the very successful example of the Earthscope program on land. Taking advantage of the availability of Stimulus funding, $10M was secured to acquire new instruments to form the Amphibious Array Facility (AAF) a collection of land seismometers and GPS stations and ocean bottom seismometers.  The first experiment with this facility focused on Cascadia.  Unlike PI driven experiments, the experiment design was the consensus outcome of a community meeting.  A group of scientists led by Doug Toomey at the University of Oregon and including me was tasked to acquire but not analyze the data and to entrain young scientists in the seagoing work.  The data from the experiment is put immediately into the public domain and and NSF encourages scientists to write relatively cheap proposals to analyze it.  The experiment still has a year to go but it has already created a large user community many of whom have never worked with marine seismic data before.

The experiment data can address a wide variety of questions related to the deformation and hazards of the Cascadia subduction zone and the dynamics of the Juan de Fuca plate but is has other unanticipated uses.  I am interested in looking at earthquakes near the Juan de Fuca and Gorda ridges but so far my research with the data has been work funded by the Office of Naval Research to study blue and fin whales both of which call within the seismic frequency band (see my Whale Seismology page).  The shear scale of the Cascadia Initiative experiment provides a unique opportunity to study the seasonal distribution of calling whales in the northeast Pacific and understand how these are related to migration patterns and to environmental parameters that can be linked to food sources.  It can also help the Navy understand and minimize the impact of their operations on these endangered species.

NSF is now contemplating what to do with the Amphibious Array Facility after the Cascadia Initiative experiment ends.  Some scientists want to take it to Alaska (great for whale studies), others to the East Coast (not quite as great but still interesting) and a few may argue to keep it in Cascadia.  The offshore component of the AAF is expensive to operate and it is not clear if MG&G can afford it on their current budget.  There may be pressure to scale back its operation so that community experiments use fewer instruments for less long, or even to abandon the facility to traditional PI experiments.   However, if the new community of marine seismic data users who have been entrained by the Cascadia Inititive is set adrift without new community data sets to excite them, then it may be harder to make a strong case for increased funding for marine seismology.  This is the conundrum will hopefully take center stage at Future of the Amphibious Array Facility workshop that will be held in Snowbird later this month – pity we could not wait a couple of months so that we could all ski!

I have submitted two white papers to the AAF workshop: The Amphibious Array Facility: Good and Cheap and Monitoring Baleen Whales with the Offshore Component of the Amphibious Array Facility