fifi
Tutorial created for folks to use FigureFirst to lay out multi-panel figures using Inkscape and Matplotlib.
contents
overview
The workflow with FigureFirst is as follows:
- draw boxes in Inkscape that represent the location and dimensions of the figure axes you want to plot;
- tag those axes using the FigureFirst extension in Inkscape;
- load this layout .svg in Matplotlib and plot onto the layout’s axes;
- save the .svg and open it in Inkscape for final edits.
The beauty of this workflow is that it separates the whole-figure aesthetical fine tuning in Inkscape from the nitty-gritty details of plotting on axes in Matplotlib. You essentially get the best of both tools without the headaches of either.
FigureFirst is picky with versions. To set yourself up for success, you’ll want to install Python 3.9 and Inkscape 0.92. Yes, those are a bit out-of-date. But you’re likely using very basic functionality from both pieces of software, so this toolkit is probably workable for your figure. (Regarding the latter, you only need 0.92 for the initial labeling of axes – after that you can edit in any higher version.)
Python 3.9
This is pretty standard and ChatGPT can coach you through the process if you’re unfamiliar or run into issues, but in brief: we will add a package archive for old versions of Python, install Python 3.9, and set up a virtual environment with this version.
# install old version of Python
sudo add-apt-repository ppa:deadsnakes/ppa
sudo apt update
sudo apt install python3.9 python3.9-venv python3.9-distutils
# set up virtual environment
python3.9 -m venv ~/py3.9
source ~/py3.9/bin/activate # <-- now "(py3.9)" will prepend your shell prompt
pip install numpy scipy sympy matplotlib jupyter
python -m ipykernel install --user --name=py3.9 --display-name "Python 3.9"
That last line is needed if you want to use Jupyter notebooks – you’ll further need to select the “Python 3.9” kernel from within Jupyter, otherwise you will get a “module not found” error when you try import figurefirst. If you are running scripts in IPython this will not be an issue.
Inkscape 0.92
I’ve tested on Windows that I can install Inkscape 0.92 by downloading from this release page, and that this installation can coexist with a newer version (1.4 at the time of writing).
On Linux there’s a flatpak file on this page; I have not tested whether you can have another version installed simultaneously.
I have not tested the OSX .dmg.
FigureFirst
Installing FigureFirst is easy: within the py3.9 venv, just type
pip install figurefirst
But you need to do one additional step: install the FigureFirst extensions in Inkscape. Just do the following.
First, we’ll find where the Inkscape extensions are stored. Open Inkscape and click Edit -> Preferences -> System, and open the “User extensions” folder.
Second, we’ll find the FigureFirst extension files. These are stored in the venv folder at py3.9/inkscape_extensions. Simply copy the .inx and .py files from this folder into the extensions folder from the first step.
Now close and re-open Inkscape – if you were successful, there should be a FigureFirst item in the Extensions menu.
MWE
Let’s do a minimal (but non-trivial) working example: we’ll reproduce Fig 3D,E,F from Maneeshika’s paper. Download the following files: fifi.svg, fifi.ipynb.
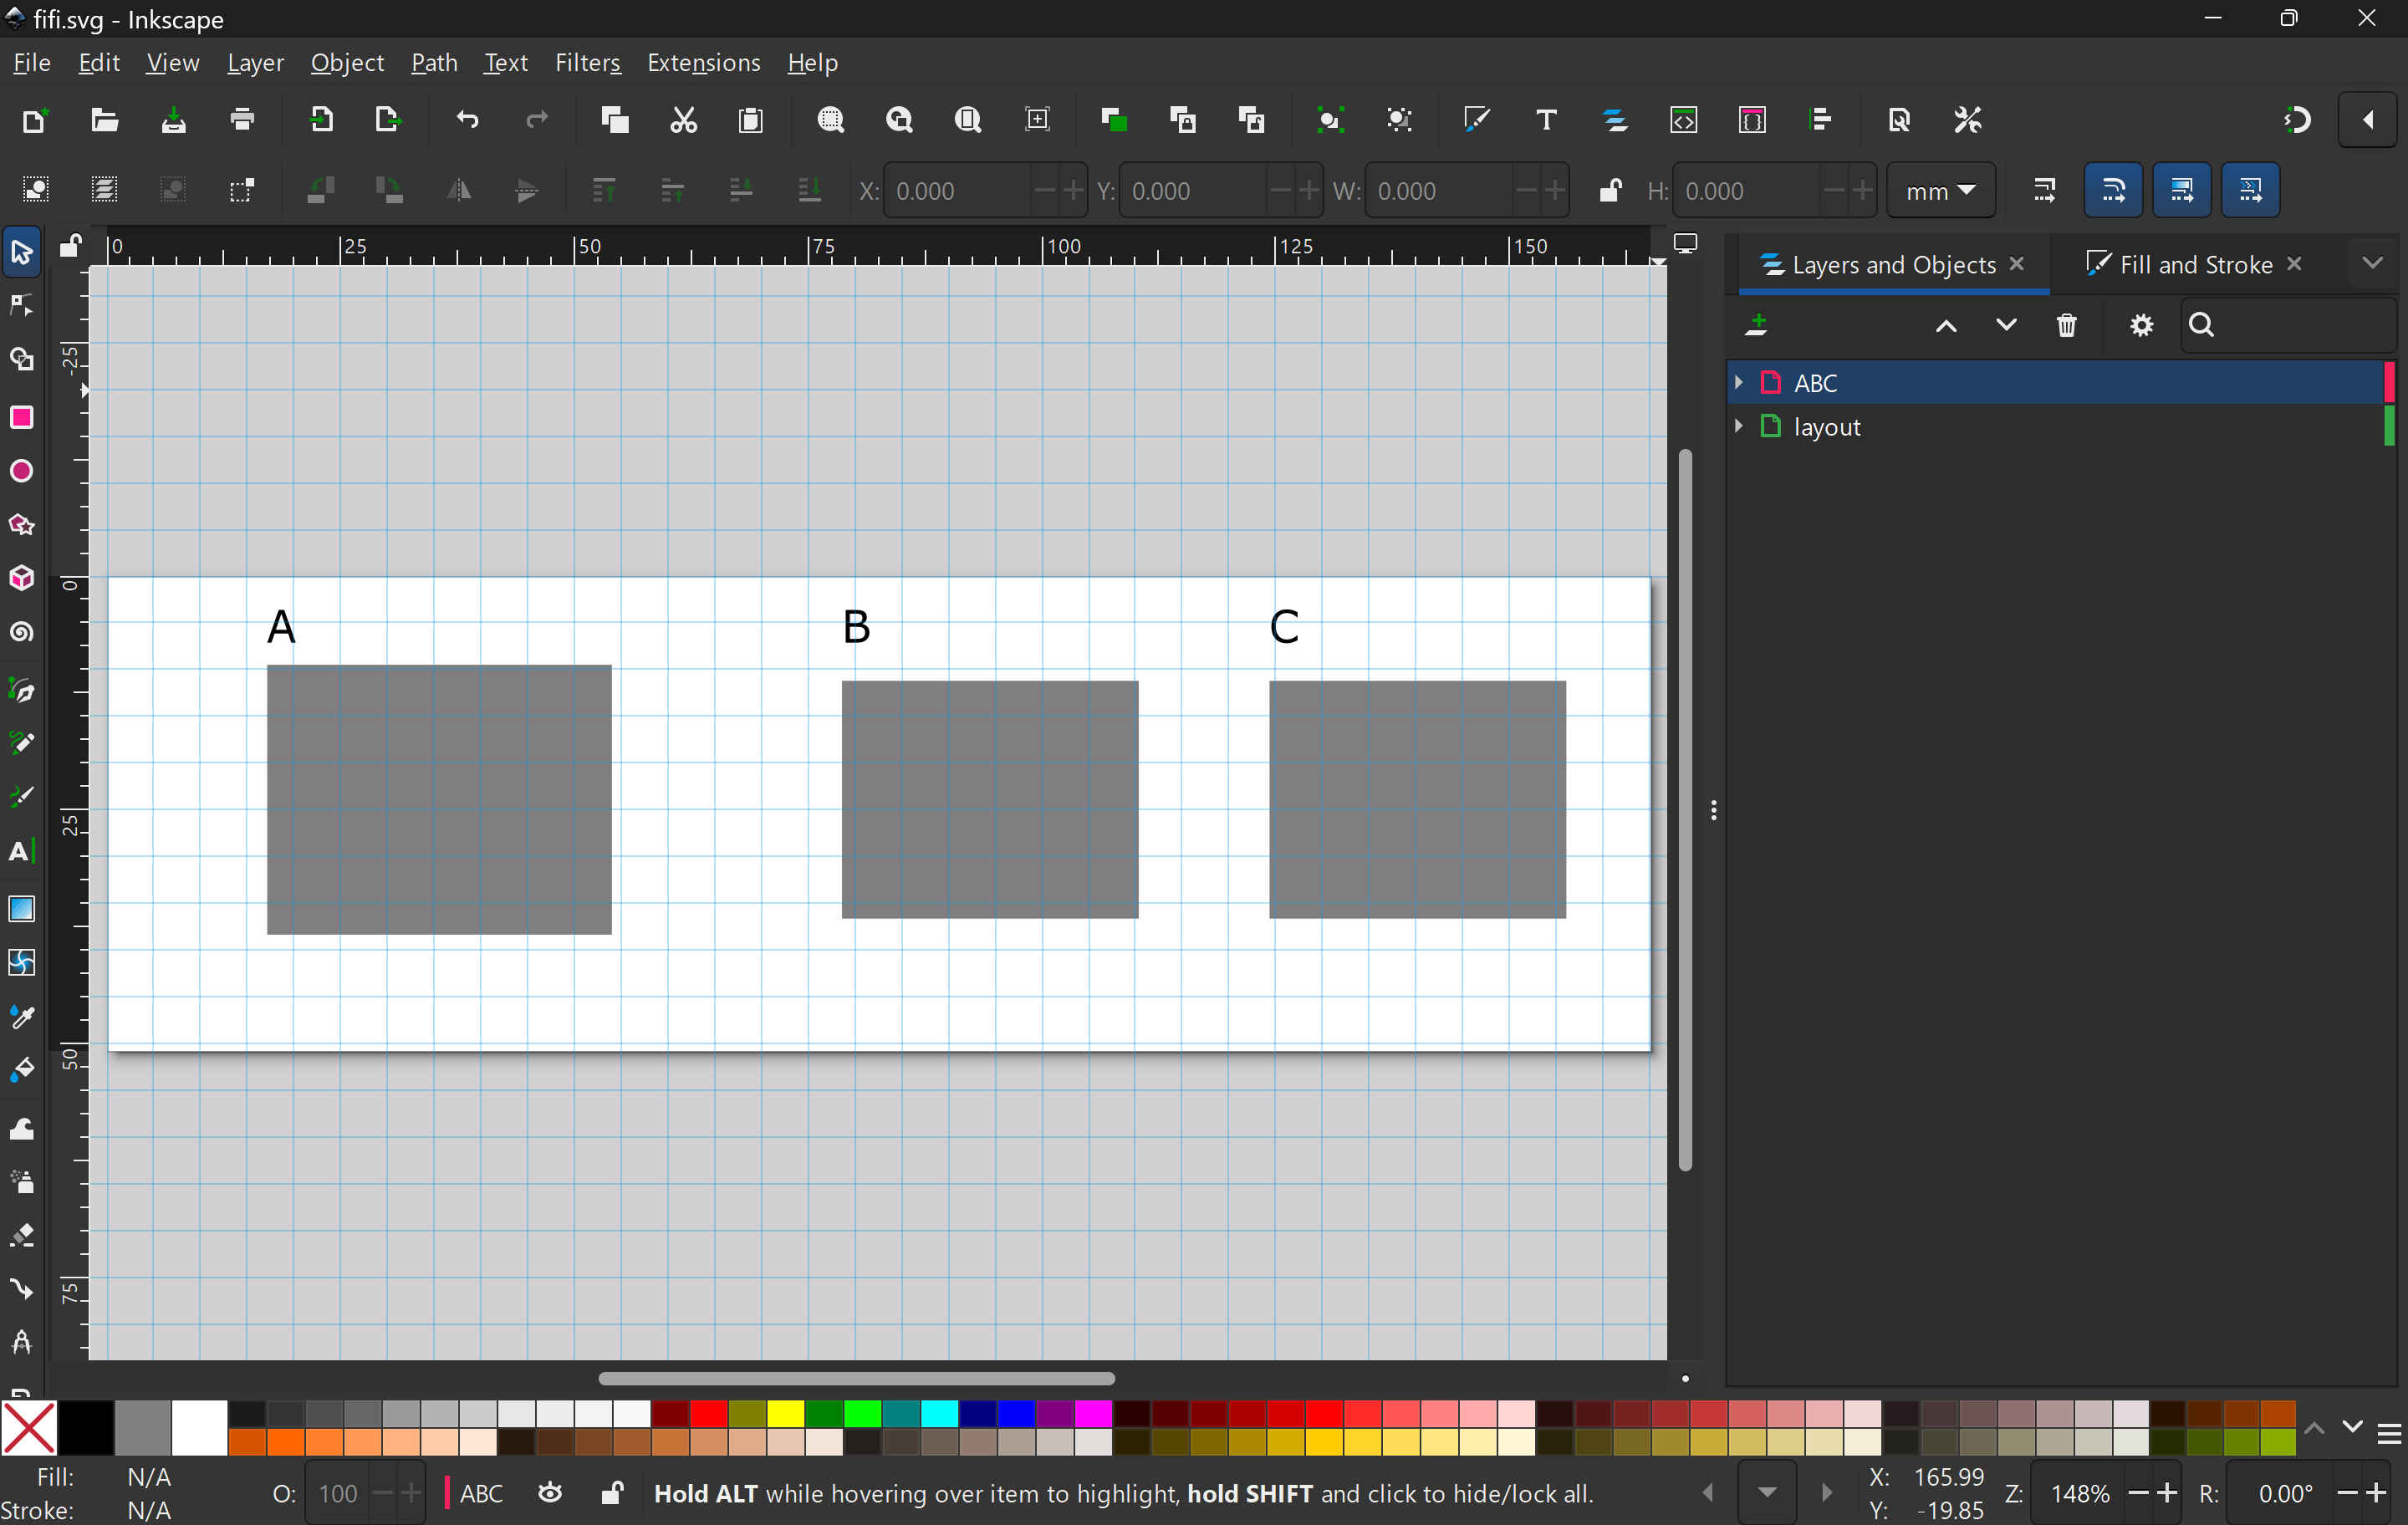
If you open fifi.svg in Inkscape, you’ll see a pretty boring canvas: three grey boxes indexed by A, B, and C (OK so this differs from the D, E, and F in the paper, so sue me!). This really is all you need. If you wanted more annotations, for instance a box around one of the axes or arrows pointing at key elements, you add them to this file.

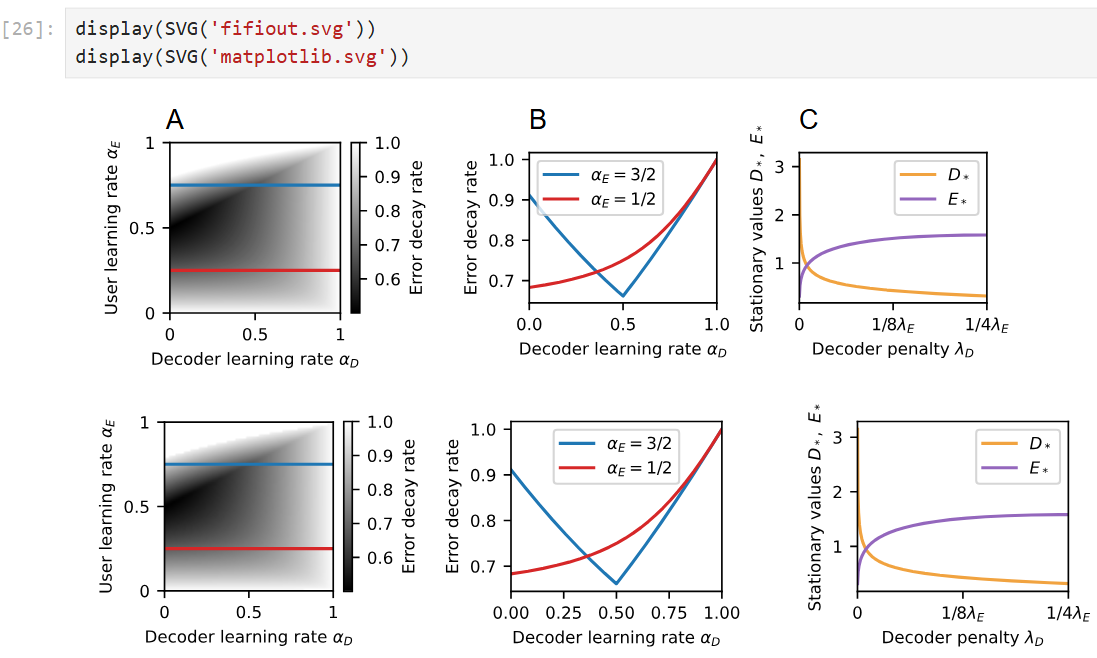
Now execute all the cells in fifi.ipynb. The final cell output should look like the following.

The figures are very similar, but there are two important differences. First, we were able to directly add the A, B, C annotations and align them with respect to the axes’ bounding boxes. Second, we have control over the dimensions of and spacing between axes, so we are able to achieve a more aesthetically pleasing spacing between the second and third axes without having to hack around in Matplotlib.
Interestingly, fifi.svg has been modified by this process (change the filename in lo.save('fifi.svg') if you want to prevent this). Specifically, the layer “layout” has been hidden (by the argument hide_layers=['layout'] to FigureLayout(...)) and a new layer “mpl_layer” has been created. If you re-run the FigureFirst cells in the .ipynb, the mpl_layer will be deleted and re-written (by the command lo.clear_fflayer('mpl_layer')). In this way, you can ‘close the loop’ between editing the layout and populating it with plots from Matplotlib.
DIY
To create your own layout, follow the very clear and concise instructions in the following video.
