Background on Tides
Tides in the Pacific Northwest are large, and have complex patterns that can be hard to understand. Here we look at some of these patterns and the reasons for them.
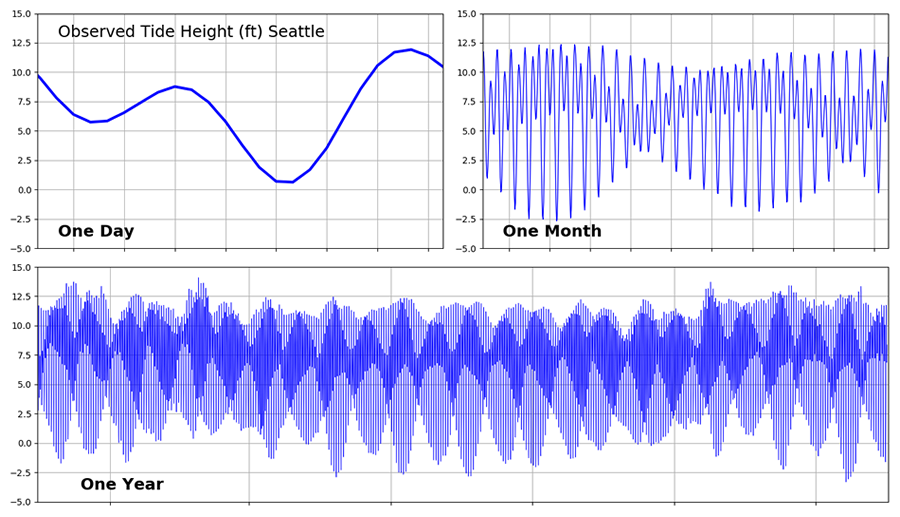
The plots to the right or below show the tide height at Seattle over three different time periods. These have many of the features we would like to explain:
One Day
- Why are there two tidal cycles in a day?
- Why are the two low waters in a day so different from each other?
One Month
- Why are there times of the month with much larger tidal range?
- Why are there times in the month when the two low waters are about equal?
One Year
Long-term Variation of the Tides
Spatial Patterns of Tides
Why are there two tides a day? [TOP]
Over one day there are about two tidal cycles, meaning two high waters and two low waters. Tides are caused by small perturbations to gravity due to the sun and moon. The sun is highest in the sky once a day, and the moon is on almost the same schedule, being highest in the sky once every 24 hours and 50 minutes. So why are there two tidal cycles? The reason is that the forcing from either sun or moon peaks twice a day.
Tides are forced by tiny variations of gravity due to the moon and sun. Even though it is much smaller, the moon's influence is about twice as big as the sun's, because it is closer. The physics is the same in both cases so we can just look at one to find out what is going on.
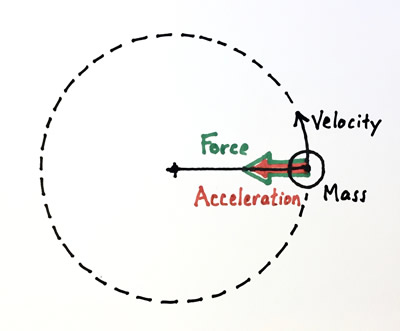
Say you have a rock on a string and are swinging it in a circle around you. The balance of forces keeping the rock moving in its circular path are that the force (the tension in the string, shown in green) balances the rock's mass times its acceleration (shown as orange).
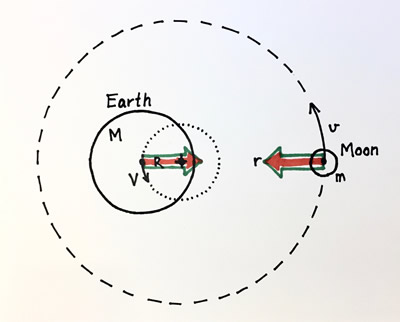
The Earth and the moon are like two rocks (of very different size!) swinging around a point somewhere between them. This point, the "+" in the figure, is about three-quarters of the way from the center of the Earth towards its surface. Now the force pulling them towards this center is not a string, but instead is the gravitational force that the two masses exert on each other. This "gravity" is tiny compared to the gravity we feel on Earth, being only about 1/294,000 as big, so you don't feel it at all. But this force is what keeps the moon in orbit around the Earth, circling us about every 27.3 days.

This tiny gravitational tug toward the moon is not, itself, what causes tides. Instead it is the fact that this tug is slightly different at different places on the Earth, as shown above. Right at the center of the Earth, the gravitational force (green arrow) exactly balances the mass times the acceleration (orange arrow). But on the side of the Earth closer to the moon, the gravitational tug is a little bigger, because the moon is closer, and so there is a tiny imbalance (the black arrow). On the side of the Earth farthest from the moon, the gravitational tug is weaker, and so the tiny imbalance points in the opposite direction.
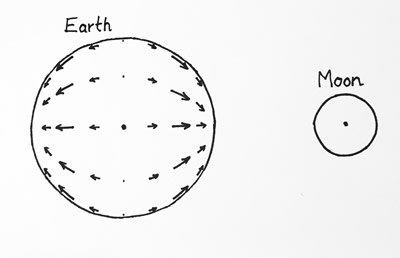
These small imbalances to the gravitational tug of the moon are only able to pull oceans around on the Earth when they are acting sideways, so in the figure above the black arrows show the pattern of this little sideways force. We call this the "tractive force" and as you can see in the figure it is like pinching a ball from two sides, stretching it out. At its biggest, the tractive force from the moon is only about one twelve-millionth the size of gravity, really, really tiny! The reason it is so effective at causing tides is that it is acting at a period (12.42 hours) that is similar to the resonant period of ocean basins. The "resonant period" is the natural time that the oceans would slosh at. Every basin of water, from a glass of water to a bathtub to an ocean has a resonant period, longer periods for bigger basins.
The Earth is rotating under this pattern of tractive force about once a day. In the movie we plot the size and direction of the tractive force (the red arrows) at three places on the Earth, as the moon (the smaller green sphere) circles around over the course of a day (really the Earth is rotating under the moon, but the movie is made to show things from an Earth-centered point of view). At any place water is getting tugged back and forth in a pattern that repeats twice a day, and this is the fundamental reason why there are two tides a day.
Why are the two tides in a day different in size? [TOP]
One of the low waters in a day is often much lower than the other in our region. This has an interesting pattern over a year: in summer the lower low water happens in the day, but in the winter it happens at night. The reason has to do with the tilt of the Earth's axis relative to the sun - the same tilt that causes Summer and Winter. The extra tug the tides feel once a day causes the difference in the low waters.
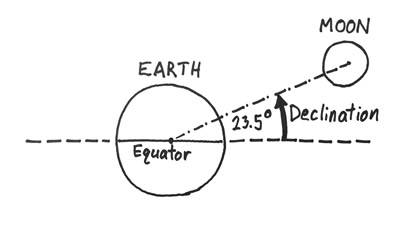
You may have noticed that in the movie in the section above it says "Lunar Declination = 0 degrees." Declination is the word astronomers use to describe the angle of the moon or sun relative to the plane of the Earth's equator. The Earth's spin axis is tilted by about 23.5 degrees relative to the plane on which we orbit the sun - this of course gives rise to the seasons. The moon is orbiting the Earth on about the same plane, and so once a month it has a large positive declination, as shown in the figure. Twice a month the moon has zero declination, and the tractive force pattern is like the first movie.
In this second movie we show the pattern of tractive force when the moon is at its maximum declination. The patterns are much more complicated, like pretzels, but you can think of them as being a combination of twice-a-day forcing and once-a-day forcing, and this is the fundamental reason for the two low waters in a day being so different.
Monthly Patterns: the Spring-Neap Cycle [TOP]
There is a clear pattern over a month, with larger tidal ranges happening about every two weeks. These are called "Spring Tides" and the times in-between with smaller tidal range are called "Neap Tides." Spring tides happen when the forcing due to the sun and moon are acting together, which happens during full moon or new moon. Sometime one spring tide is noticeably smaller than the one two weeks before. This is because the moon's orbit is elliptical and so sometime is it nearer to the Earth and has a bigger effect on tides. When a full moon happens at the same time that the Moon is at the closest part of its elliptical orbit we call it a "Super Moon."
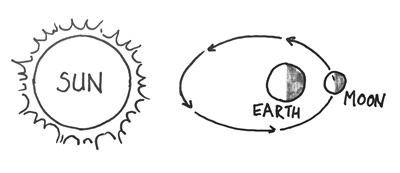
The moon and the sun both cause twice-a-day tides, but with slightly different periods. The period for the sun is 12 hours, but for the moon it is 12.42 hours, because the moon is slowly circling around the Earth (over a month). When you add these two together you get a "beat frequency" in which the two types of forcing add to each other when the sun, Earth, and moon are lined up. In the sketch this alignment is happening at full moon, but it also happens at new moon. The result is that during full and new moons we have larger tidal ranges, which we call "Spring Tides." During half moons the gravitational forcings from the sun and moon partially cancel each other out and we see smaller tidal ranges, called "Neap Tides."
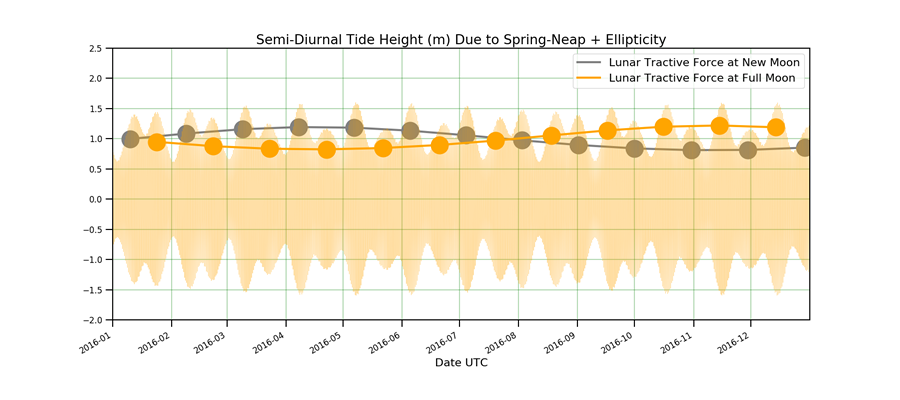
Plotted here is a year of tides at Seattle. This is not the whole tide, but just that part of the tide forced at twice-a-day frequency by the sun and moon. There are about two spring tides per month. Also shown on the figure is the timing of full and new moons, and these clearly line up with the spring tides. There is a clear variation of the size of spring tides, like in April 2016 there is a strong spring tide followed by a weak spring tide. The reason for this is that the moon's orbit around the Earth is elliptical, and so about once a month it is relatively closer to the Earth. This is shown in the figure by the "Lunar Tractive Force" lines. What these show is, for example in April 2016, the first spring tide was during a new moon that had a larger tractive force because the moon was at the close part of its elliptical orbit. At the following spring tide during a full moon the moon was at the far side of its elliptical orbit, and so had a smaller tractive force. The ellipticity is not happening at exactly the same frequency as the full moon, so the pattern varies throughout the year, and over different years.
What causes variation of the once-a-day tides? [TOP]
There is also a monthly variation of the once-a-day tides, caused by the declination of the moon.
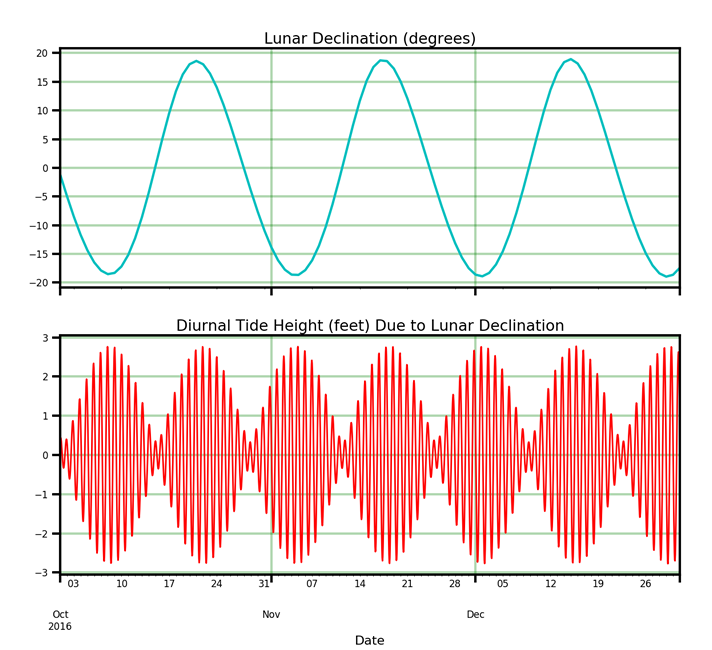
As we explained above, the once-a-day part of the tides is caused by the declination of the sun or moon above the plane of the Earth's equator. In the figure we plot just the once-a-day part of the tide forced by the moon, over three months. During this time the maximum declination was about 18 degrees. During times when the declination is largest, either positive or negative, the once-a-day tides are largest, and when declination is zero they also drop to zero. This is one of the reasons that the observed tide pattern is so complicated. The reason that the maximum declination was only 18 degrees is that the plane of the moon's orbit is actually tilted about 5 degrees off of the plane of Earth's orbit around the sun, and the orientation of that 5 degrees varies over a period of about 18.6 year. During 2016 the orientation was such that this 5 degree tilt was subtracting from the maximum declination.
The movie shows tide height at Seattle over a month. It is easier to understand if you pause it: then the plot is tide height vs. time for a single day (date shown at upper left). If you go to the next frame it is the tide height for the following day.
The time at which the moon is highest in the sky is shown by the white circle, and it is clear that the phase of the tide follows the moon, with peaks happening 50 minutes later each day. This is during the time of year when lower low water happens in the day, because of the sun's contribution to the once-a-day tides. "Minus tides" are marked in red.
What causes variation of the tides over a full year? [TOP]
Over a year you can see about 25 Spring Tides. Also the tide range is larger during the summer and winter solstice times, which is because of the sun's declination causing larger once-a-day tides then. There is also a variation of the tidally-averaged sea level that can cause mean water levels in the winter to be almost two feet higher than in the summer. The reason is the weather.
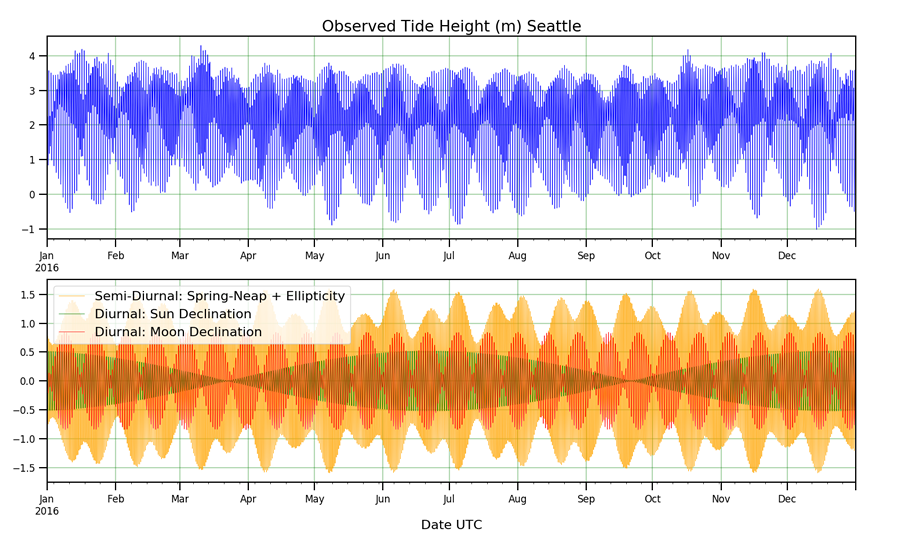
The observed tide height at Seattle for 2016 is shown in the top panel. The tides due to the main forcing mechanisms we have explored for once-a-day and twice-a-day tides are shown in the lower panel. A new line is the green one, which shows the once-a-day tides forced by the sun. These peak at the summer and winter solstices, when the sun's declination is highest or lowest.
The amazing this is that if we add up the three lines in the lower plot we get something that looks almost exactly like the upper plot. This means that we can explain almost the full complexity of the tidal cycle as the sum of three parts:
- Twice-a-day tides forced by the sun and moon, with spring-neap variation modulated by the ellipticity of the moon's orbit.
- Once-a-day tides forced by the declination of the moon, and
- Once-a-day tides forced by the declination of the sun.
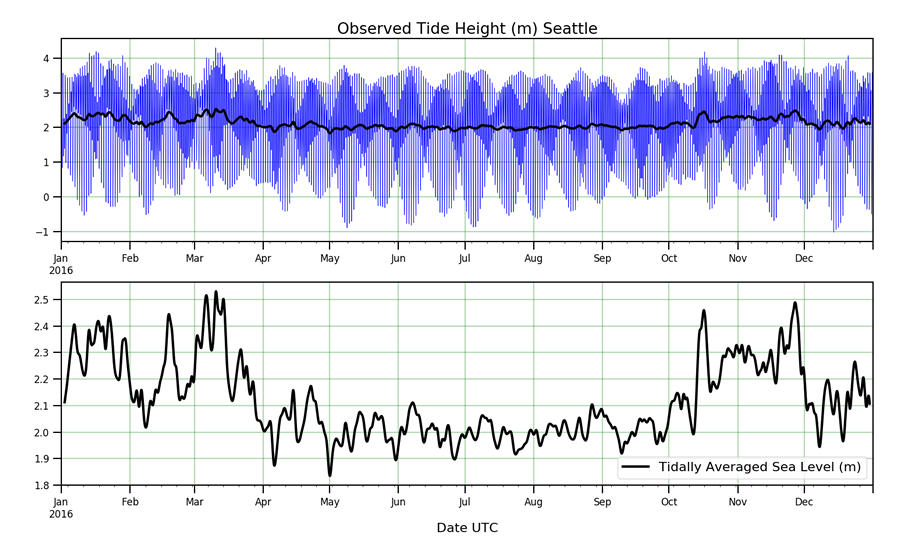
The most import remaining part of the actual sea level is revealed in the plot by "tidal averaging." The blue line is the actual sea surface height. The black line (also plotted on its own in the lower panel), is the sea surface height obtained by averaging over a few days to remove the tidal variation. What is apparent is that this "mean sea level" can be up to 0.6 m (2 feet) higher in the winter than during the summer. There are two reasons for this, both caused by the weather. First, during winter storms the winds on the coast are more from the south, and because of the Coriolis force this pushes water toward the coast, raising sea level even in the Salish Sea at Seattle. The second reason is that storms are often accompanied by lower atmospheric pressure and this actually pulls the water level higher.
Longer Variation of Sea Level [TOP]
One interesting reason for decadal variation of the tides is due to the lunar declination. We mentioned above that the plane of the lunar orbit is tilted by 5 degrees off of the plane of the Earth's orbit around the sun. The orientation of this 5 degree tilt changes slowly relative to the tilt of the Earth, like a plate doing a circular wobble as it drops onto a counter. It takes 18.6 years for this wobble to go through a full cycle. At one part of the cycle the maximum lunar declination is 23.5-5=18.5 degrees, and at the other part (9.3 years later) the maximum declination is 23.5+5=28.5 degrees. The consequence is that the lunar contribution to diurnal tides is bigger when the declination is bigger.
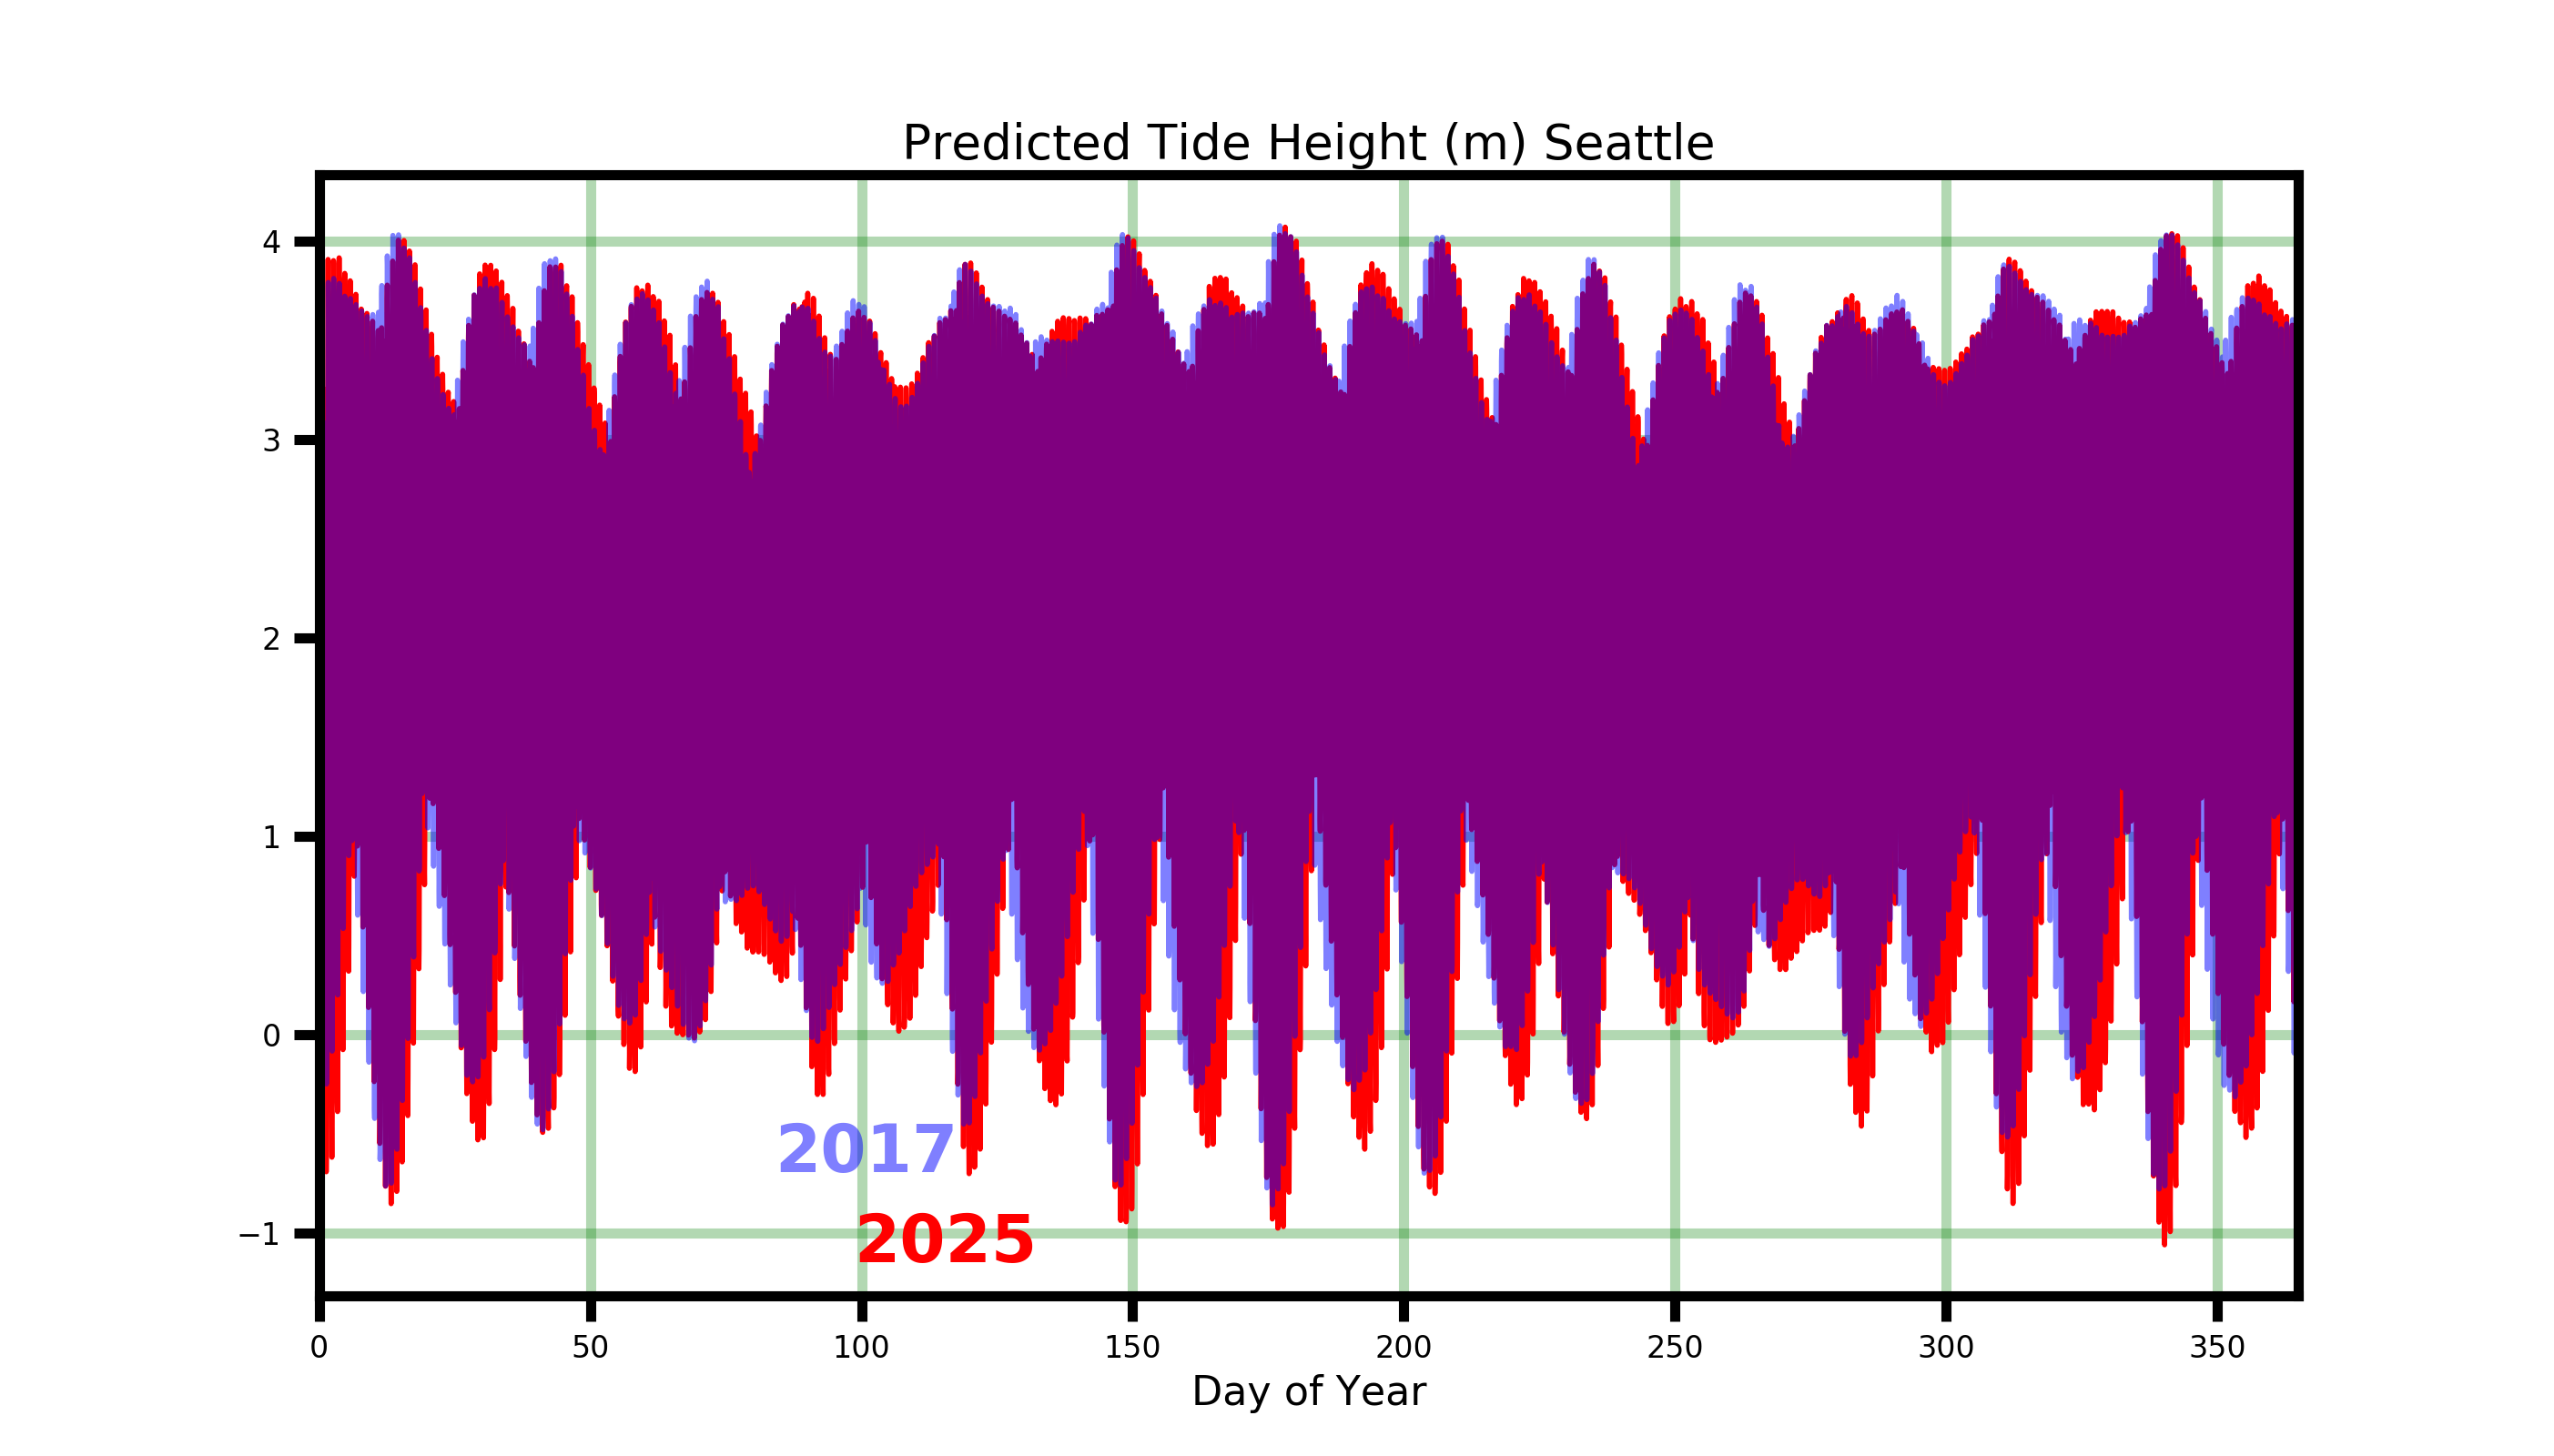
In this plot we compare predicted tides at Seattle for two years: in 2017 the lunar declination was near its minimum, and in 2025 it will be near its maximum. Overall the patterns are very similar, and the high waters are almost the same, but the lower low waters are often 30 cm (1 ft) lower in 2025. If you are an oyster grower this means a big change in the amount of intertidal area you can walk on at low tide!
Finally, there is long-term variation of sea level, due to melting ice caps, warming ocean waters, and local, slow deformation of the Earth's crust due to things like plate tectonics or the advance and retreat of glaciers. At Seattle mean sea level has risen by about 20 cm over the past century. There are other parts of the Pacific Northwest, however where mean sea level is going down, because the land is rising up faster than the ocean. NOAA has an outstanding website where you can explore these trends for yourself.
Spatial patterns of the tide [TOP]
Because ocean basins have irregular shapes, the response of the tide over the globe, and inside basins like the Salish Sea, forms complex patterns.
This movie shows the global pattern of tide height. This is not the full tide, just the twice-a-day part due to the moon's forcing. It repeats every 12.42 hours. You can see that one tidal "slosh" can fill a whole ocean basin, and that some bays at the edges of the ocean have really large tidal amplitude. This is because their natural resonant period is close to 12.42 hours.
This movie shows sea surface height in the Salish Sea and the coastal waters of Oregon, Washington, and British Columbia. You can see that there is a big phase difference between the coast and Puget Sound: when it is high tide in Seattle is it low tide at the coast. These are like the two ends of a bathtub with the water sloshing. The was made from a realistic numerical model of the region called LiveOcean.
Resources [TOP]
There is a lot of great information on the web about tides, especially from NOAA:
I also have learned a great deal from these books and reports:
- White, J., 2017: TIDES: The Science and Spirit of the Ocean. Trinity University Press, San Antonio, 335 pp.
- Boone, J. D., 2004: Secrets of the Tide: Tide and Tidal Current Analysis and Applications, Storm Surges and Sea Level Trends. Horwood Publishing, 212 pp.
- Mofjeld, H. O. and L. H. Larsen, 1984: Tides and Tidal Currents of the Inland Waters of Western Washington. NOAA Tech. Memo. ERL PMEL-56, Pacific Marine Environmental Laboratory, NOAA.
- Lavelle, J. W., H. O. Mofjeld, E. Lempriere-Doggett, G. A. Cannon, D. J. Pashinski, E. D. Cokelet, L. Lytle, and S. Gill, 1988: A multiply-connected channel model of tides and tidal currents in Puget Sound, Washington and a comparison with updated observations. NOAA Tech. Memo. ERL PMEL-84, Pacific Marine Environmental Laboratory, NOAA.
- Cartwright, D. E., 1999: Tides: A scientific history, Cambridge University Press, 292 pp.
- Doodson, A. T. and H. D. Warburg, 1941: Admiralty Manual of Tides. His Majesty's Stationery Office.