How we test the model using observations
Overview
We spend about half of our effort testing how well the model is working, using observational data from a wide variety of sources. We usually do this with data that extends over a long period of time, like a season or a year. The current LiveOcean system is the result of several previous projects where we used different data sets and different model configurations, with the history described in detail in these references. For the current model version we focused on the year 2017 for our testing effort, and here are some of the highlights.
Tides
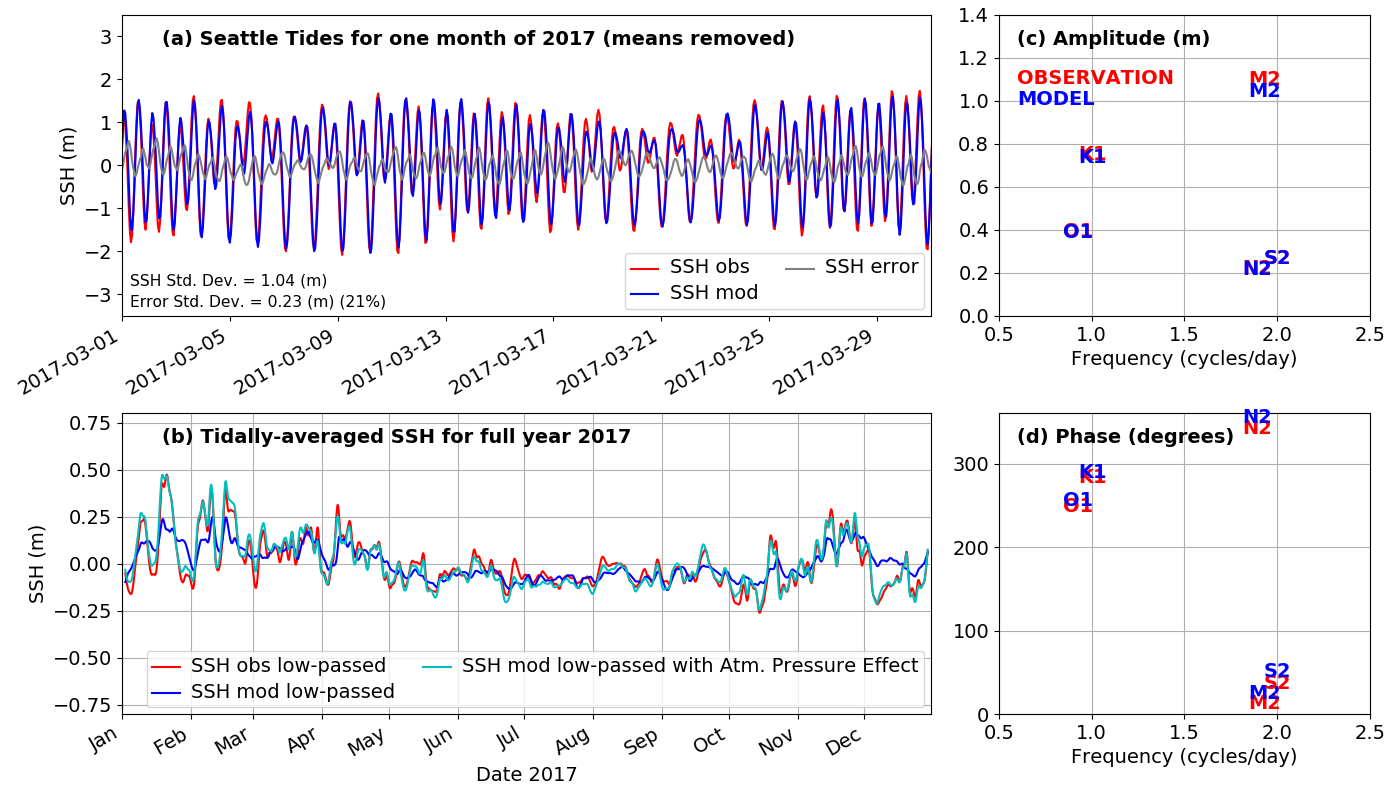
Getting the tides right in the model is essential because the tidal change in surface height causes strong currents, especially at constrictions like Admiralty Inlet. This in turn causes strong turbulent mixing, which is important for things like bringing nutrients to the surface where they can help grow phytoplankton. An example of one of our tide height tests is shown above. This compares observations from the NOAA tide gauge at Seattle with model sea surface height at the same location (the star on the map). The upper left plot is compares the observations (red line) to the model (blue line) over March 2017. They are quite close, but you can see that there is still some error (the gray line is the difference between the two). One thing we keep track of is how big this error is, in this case it has a typical size (as measured by its standard deviation) of 23 cm, or about 21% of the standard deviation of the observed tide, and this is about the level of quality we like to see.
In the lower left hand plot a full year of data is plotted, but now it is for the "tidally averaged" sea level meaning we average out the tide and just see the average sea level on a given day. Surprisingly this varies by as much as 0.6 m (2 feet!) over the year, with higher mean sea level happining especially during winter storms. Physically this is due partly to the wind pushing the water toward the coast, and partly due to lower atmospheric presssure pulling the water level up. You can see that the model (the blue line) gets much of this annual variation, but is it missing some peaks. The reason for the difference is that the model does not include the effect of atmospheric pressure on sea level. When we add the effect of atmospheric pressure to the modeled sea surface height (the light blue line) it almost perfectly reproduces the observations. The other way we analyze errors in the tide is by separating the signals into the sum of 8 different sine waves at known tidal periods. For example "M2" is the principle lunar semi-diurnal frequency (called a "constituent"), with period 12.42 hours. You can learn more about why the different tidal frequencies happen here. In this case it looks like the semi-diurnal (twice-a-day) part of the tide is a bit too big in the model, and the diurnal (once-a-day) is a bit too small, but overall we are reasonably close. The "amplitude" refers to how big the sine wave of a constituent is, and "phase" refers to when in time the peaks occur.
You can look at results from all of the 21 stations we use to test tides using this interactive map.
Water Properties in Puget Sound
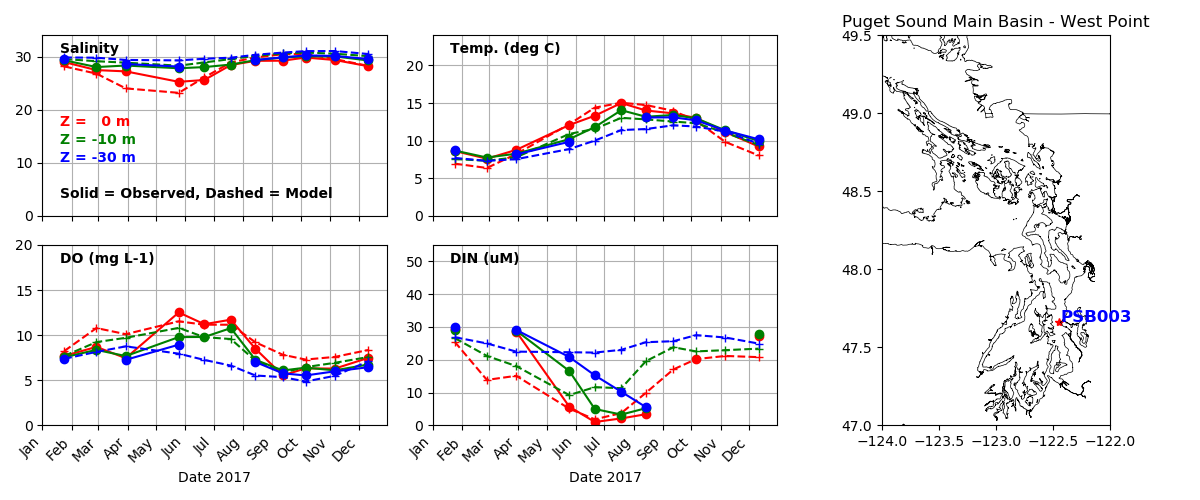
The water properties in Puget Sound reflect the integrated effect of many different processes. The rate at which deep Pacific water comes into the system due to the "estuarine exchange flow" is about 20 times greater than the sum of all the rivers, so it is clearly important. Also the rate at which river water is mixed with ocean water is critical. The rate of growth of phytoplankton depends on the concentration of nitrate and the available sunlight at a given depth, as well as how fast they are being eaten by zooplankton. The rate at which hypoxia develops in deep water depends on how much organic matter is coming down as sinking particles from surface waters. We don't routinely measure most of these rates, but we do measure the properties that result, such as the salinity of nitrate concentration of the water. A primary source for this concentration data is the Washington State Dept. of Ecology Ambient Monitoring Program, which samples at dozens of stations every month in Puget Sound, Willapa Bay, and Grays Harbor. Similar data comes from Environment Canada in the Strait fo Georgia. In the plot above you can see a comparison of modeled and observed properties over a year at a station in Main Basin near Seattle. We look at salinity, temperature, Dissolved Oxygen (DO) and Dissolved Inorganic Nitrogen (DIN, the sum of Nitrate, Nitrite and Ammonium in the observations; the model combines all just in terms of Nitrate). The comparisons are at three depths, with red at the surface, green at 10 m, and blue 30 m depth. The solid line is the observations, and the dashed line is the model. What we like to see is, for example, the two red lines right on top of each other. You can see we do quite well for salinity and temperature, but there is more error for DO and DIN. It is typical in ocean biogeochemical modeling that fields affected by biology are less predictable than those only affected by physics. The reason is that we know the laws governing physics better than we do the laws that govern biology.
You can explore data from all the CTD stations we use in this interactive map.
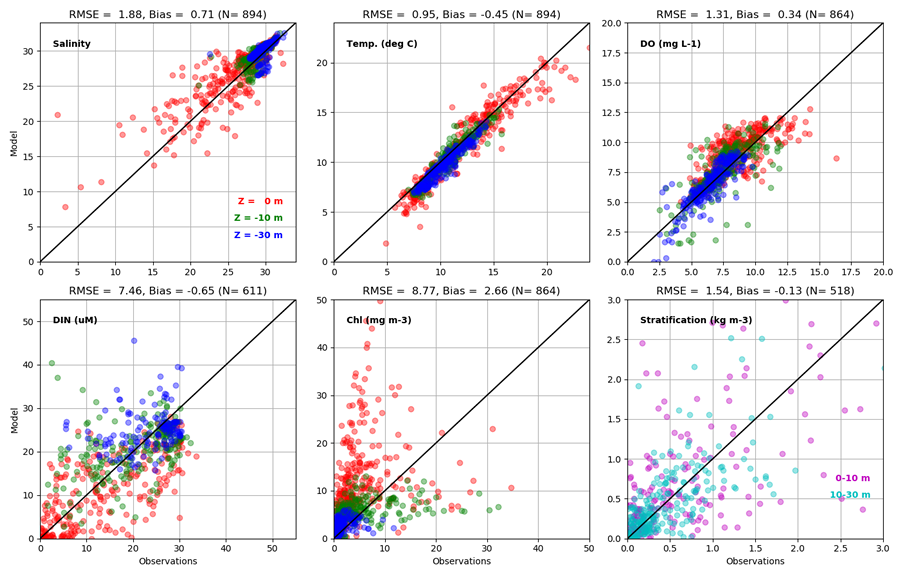
In the plot above we summarize the data from all the stations, now including the fields of Chlorophyll (Chl) which is how we measure phytoplankton. We also plot "Stratification" on the lower right, which is the density difference between two depths. More stratified water is harder to mix. These scatterplots have the observations on the x-axis and the model values on the y-axis. This means that if the two agreed perfectly the points would fall on the 1:1 line (the black diagonal line in each plot). You can see we do quite well for temperature, pretty well for Salinity and DO, and there are greater errors for DIN, Chl and Stratification, which are intrinsically more difficult. Some summary statistics are given at the top of each plot to quantify the error. RMSE is "root mean square error" which is a measure of how far off the 1:1 line we are, whether too high or too low. The "Bias" is the average difference, so for example for Temperature the average of all the model values is about half a degree C colder than the observations. Overall we judge the skill represented in the plots above to mean that we are doing a reasonably good job in simulating Puget Sound, and the coastal estuaries, but that there is also room for improvment - and we are continuously making improvements to the model based on such comparisons.
Water Properties on the Washington coast
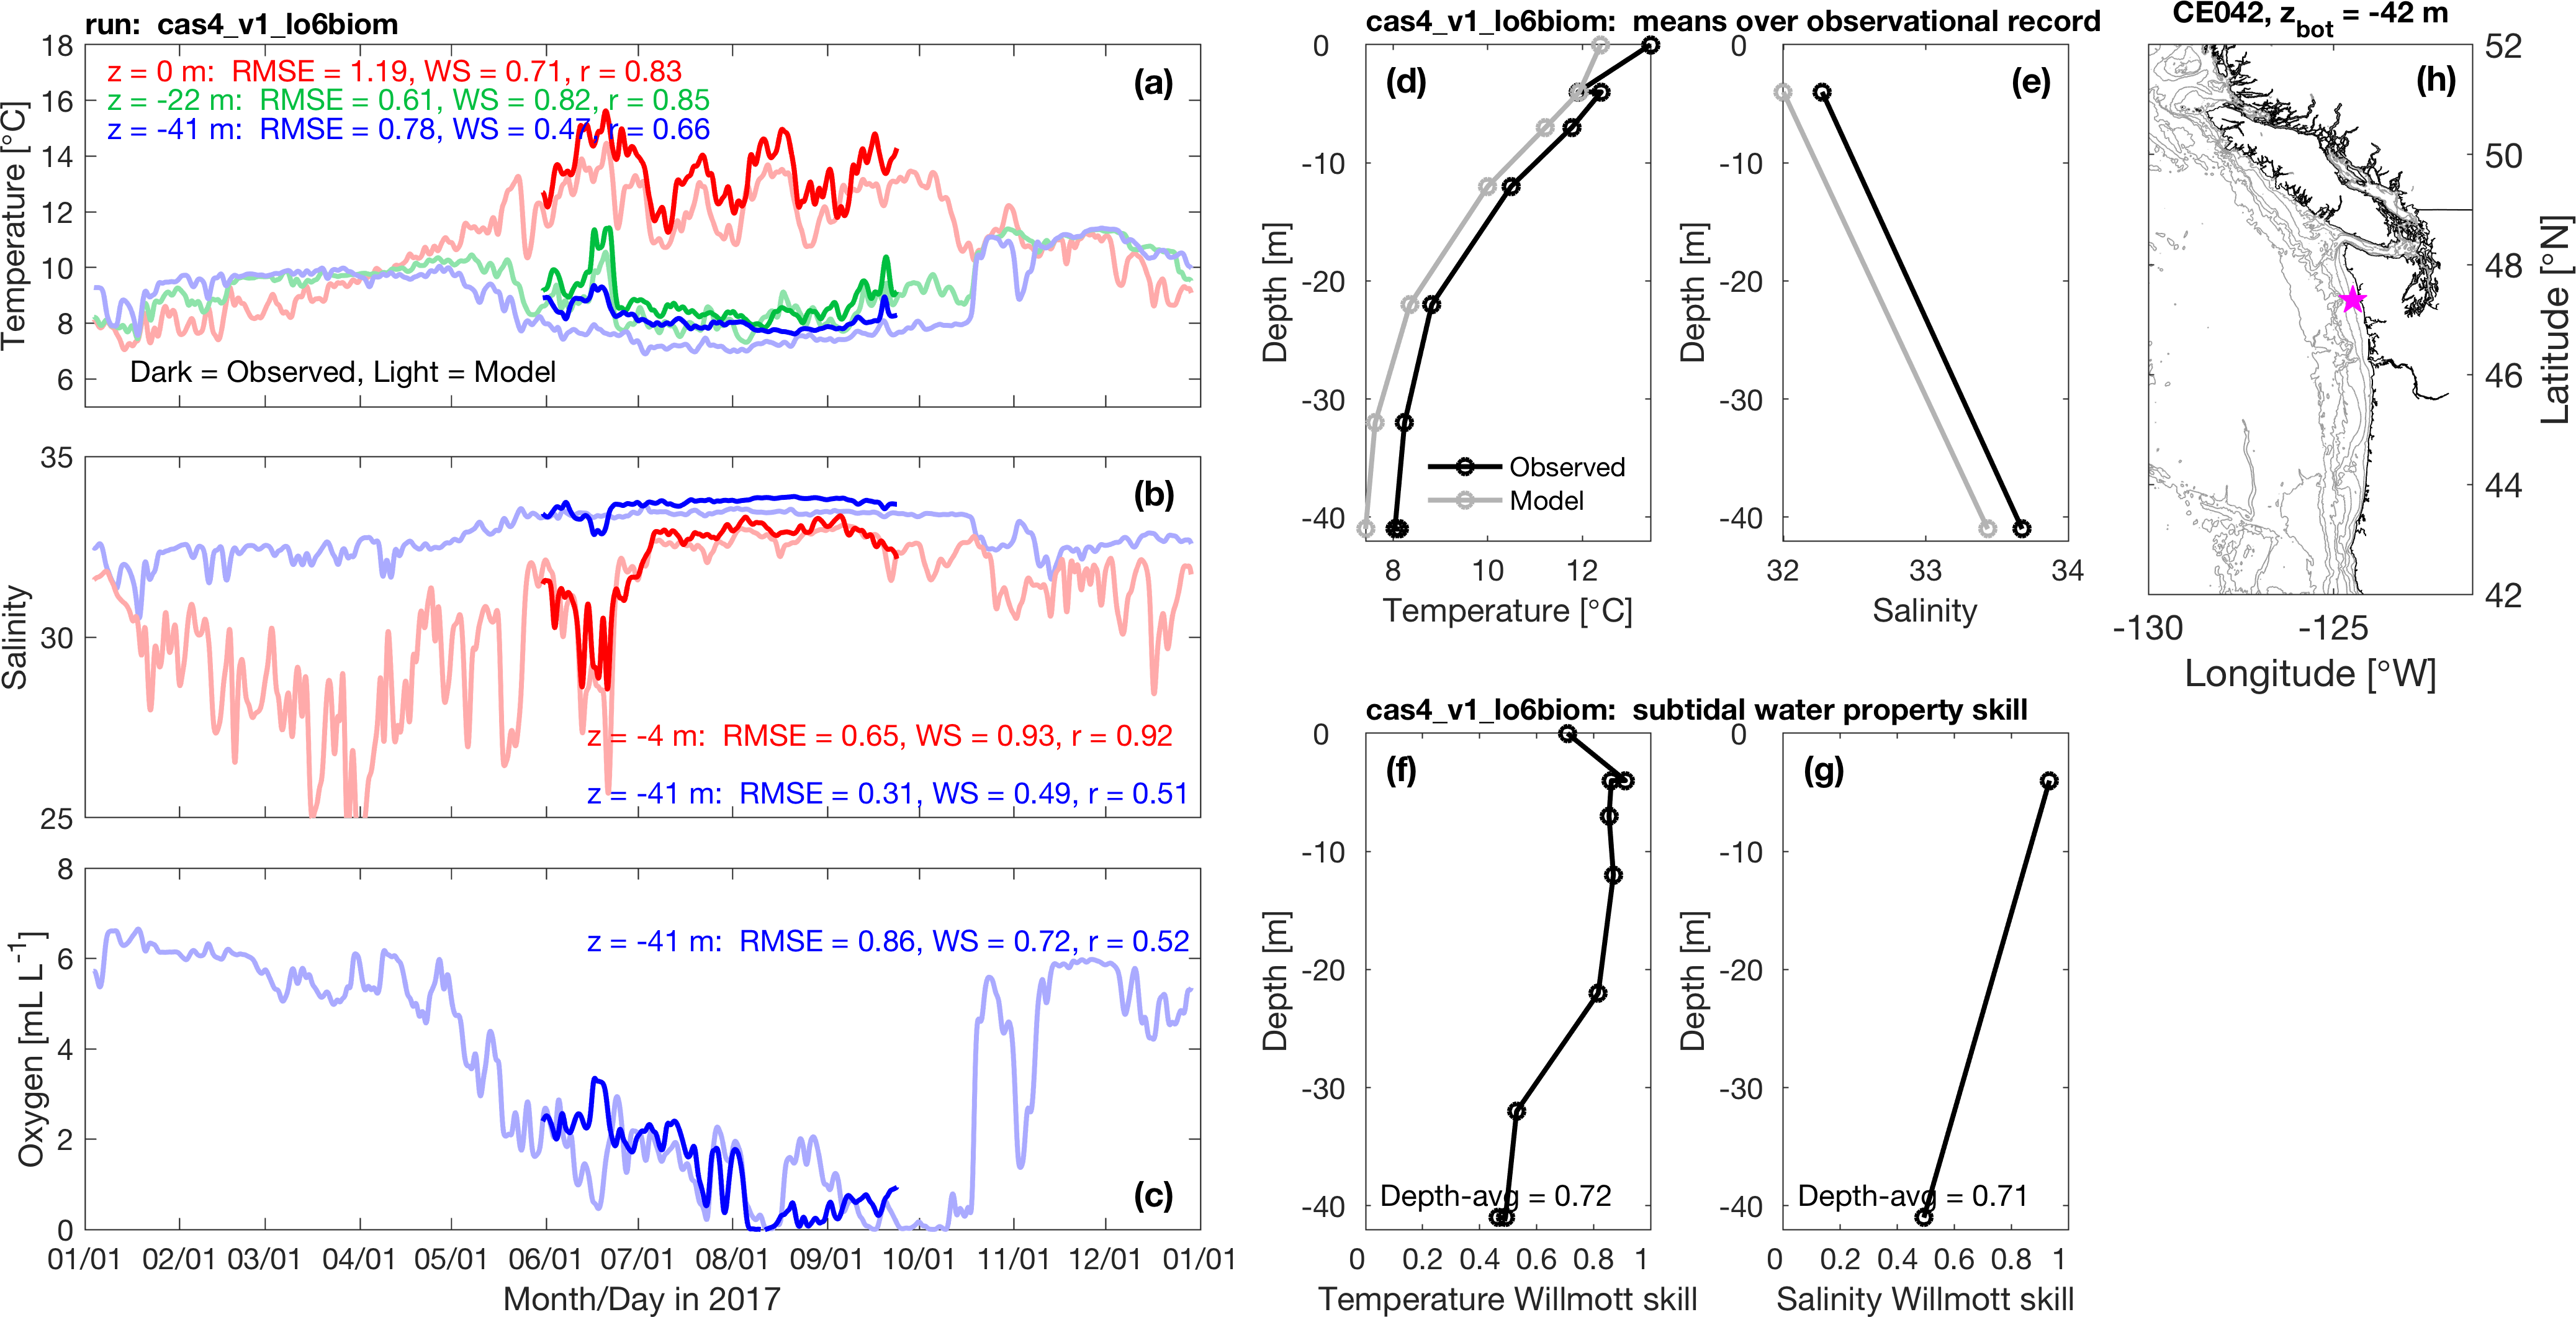
We also test the model on on the coast. One important source of data comes from the dozen-or-so moorings maintained in the summer in relatively shallow water off the Olympic Peninsula by the NOAA Olympic Coast National Marine Sanctuary. The one shown above is in about 42 m of water near Cape Elizabeth. The three plots on the left show time series of how water properties at different depth change over a full year. The darker lines are the observations, and the lighter lines are the model. As with the CTD data, what we like to see is, for example, the two red lines right on top of each other. The average error is the RMSE number in each panel, in the units of the plot. Tides have been filtered out so the main source of variability you see is due to storms (the sharp spikes) or seasonal progression (like the gradual decrease of Oxygen in the bottom water over the course of the summer). Record means are plotted versus depth in the middle top plots. The lower middle plots give record means of "Willmott Skill Score" which is like model error divided by the range of the observations. If the agreement is perfect the skill is 1. The model shows some small biases - for example water at all depths are about half a degree C too cold, but overall the agreement is quite good, giving us confidence that the currents, mixing, and biogeochemical interactions predicted by the model are doing the right thing.