Quasar Light Curves
Quasars are not static objects and vary over time. Our goal is to take a set of data from SDSS and plot a light curve in all sloan filters to observe this variability.
The data file to make this light curve can be found here: Quasar Data File
Now we need to use a plotting tool- IDL, SuperMango, .R, or even excell for the very brave. The format for the file is the time of an observation, and then the filter it is taken in, followed by the error in the measurement. This is done for all filters. Click here for the link to the exact format. For IDL users, my readcol looks like the following:
readcol,'4950833.dat',mjdu,u,uerr,mjdg,g,gerr,mjdr,r,rerr,mjdi,i,ierr,mjdz,z,zerr,RA,DEC
To make the light curve we plot the magnitude of each filter with respect to the time the measurement was made. Put time on your X axis, and the magnitude of the observation on your Y axis. Note that for my plot I have inverted the magnitude scale. After you do this for all 5 filters, you should end up with a plot that looks like the following:
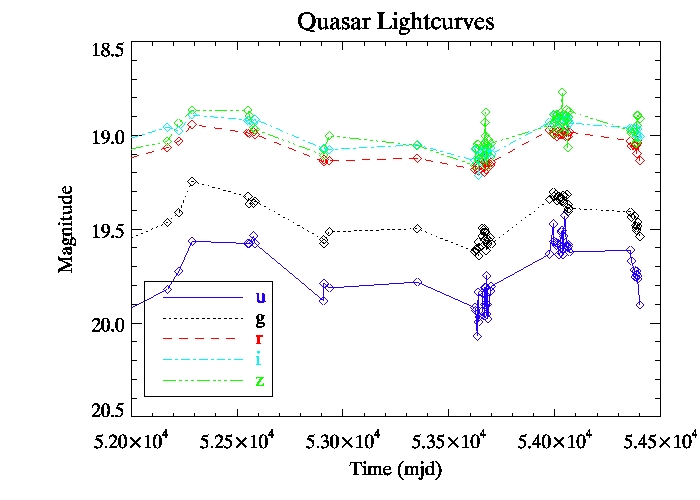
From our plot we see that the Quasar does indeed vary in magnitude with respect to time. The two primary models for explaining this variability are the starburst and accretion disk instabilitiy models. The accretion disk instability model says that the accretion rate of material onto the quasar changes over time. If more material is accreting onto the quasar, we see an increase in brightness (and a decrease in magnitude). If less material is accreting, the opposite is true. The starburst model states that the variability is due to supernovae in the surrounding region of the Quasar.