Welcome to SnakePit
My goal in making SnakePit was to provide a sandbox for designing and running experiments to test hypotheses about how fast populations change under natural selection and other mechanisms of evolution.
It might be helpful to open the Lab page, where you will run your experiments, in a different pane—so that you can see both it and these instructions at the same time.
The Backstory
Although I have taken some liberties with known natural history, I’ve built SnakePit with a real example in mind.
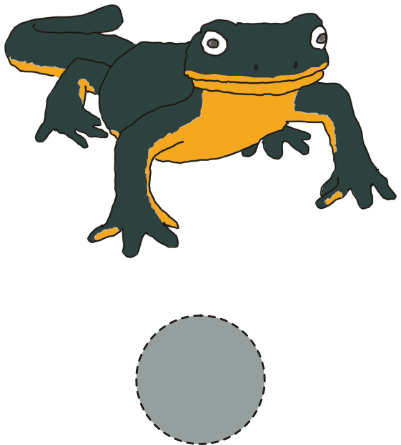
The rough-skinned newt (Taricha granulosa) is a salamander found in western portions of the Pacific Northwest.
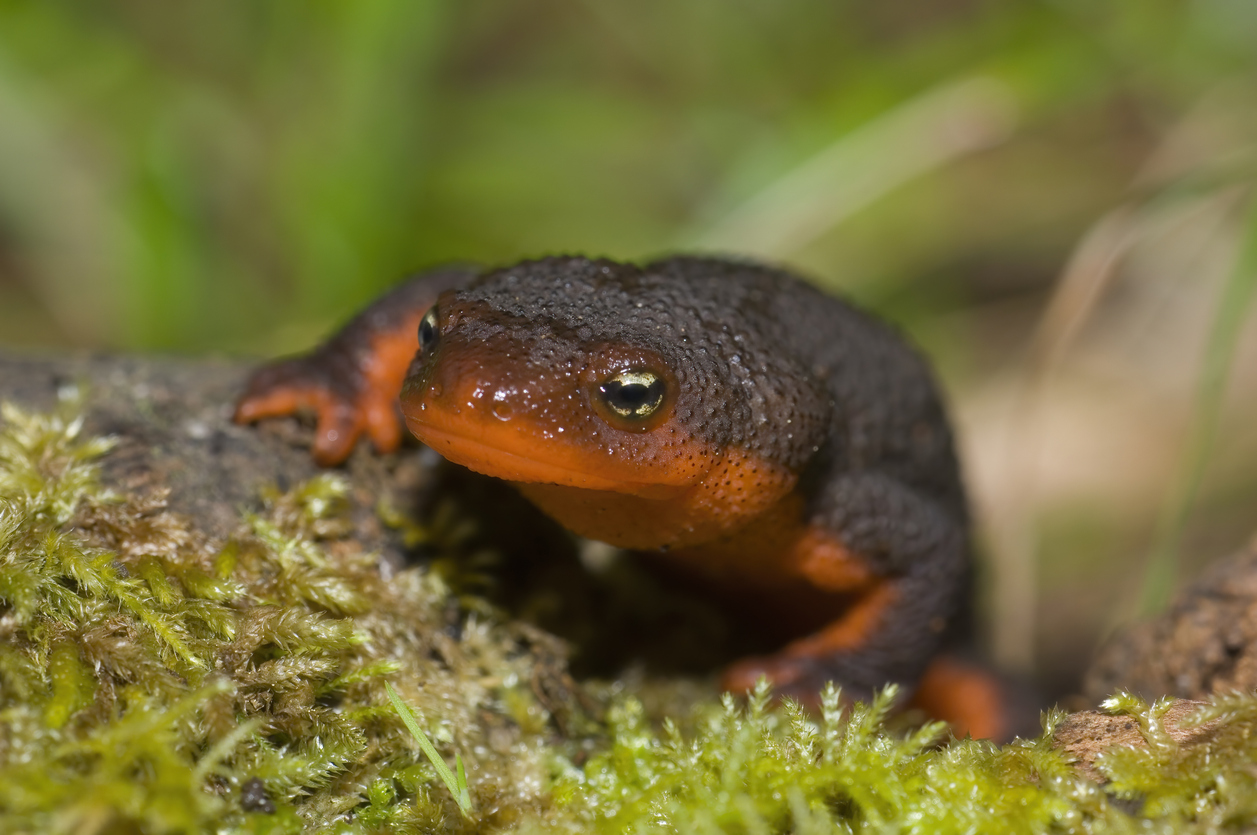
Note the orange belly, which a rough-skinned newt may give you a good look at if it feels threatened.
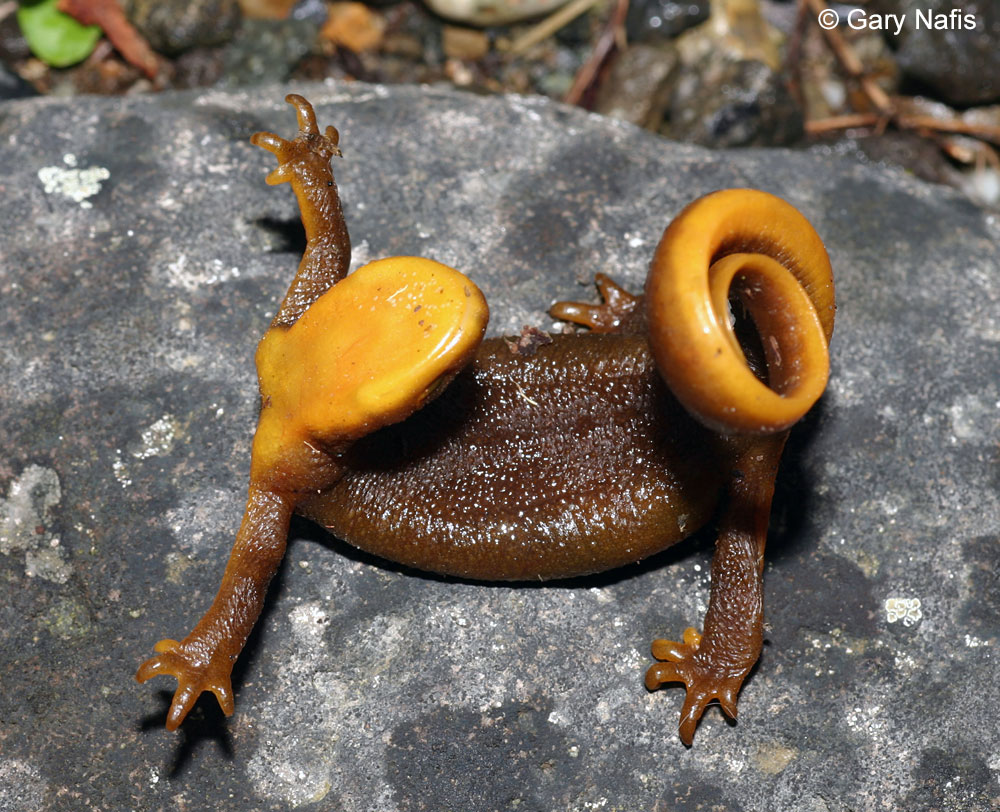
The individual newts I’ve met seemed distinctly blasé about the threat I might pose. That’s for good reason. The skin of the rough-skinned newt is loaded with tetrodotoxin (TTX), a deadly poison. Most potential predators, yours truly included, have no interest in even trying to eat them.
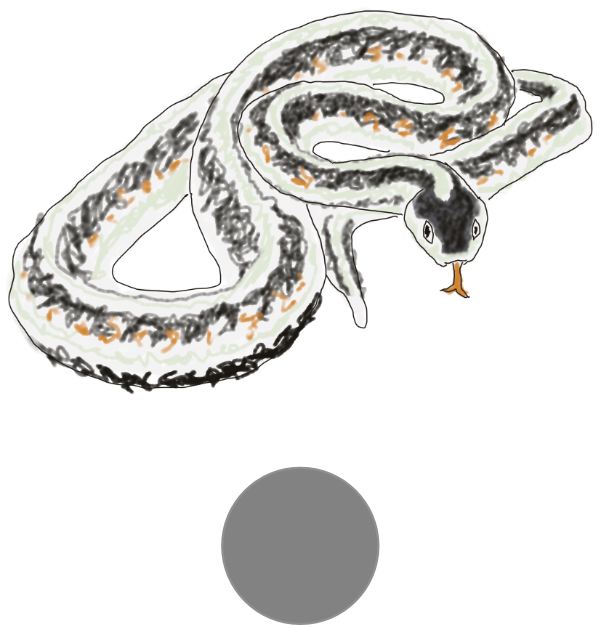
The exceptions are certain species of garter snakes, including the common garter snake (Thamnophis sirtalis).
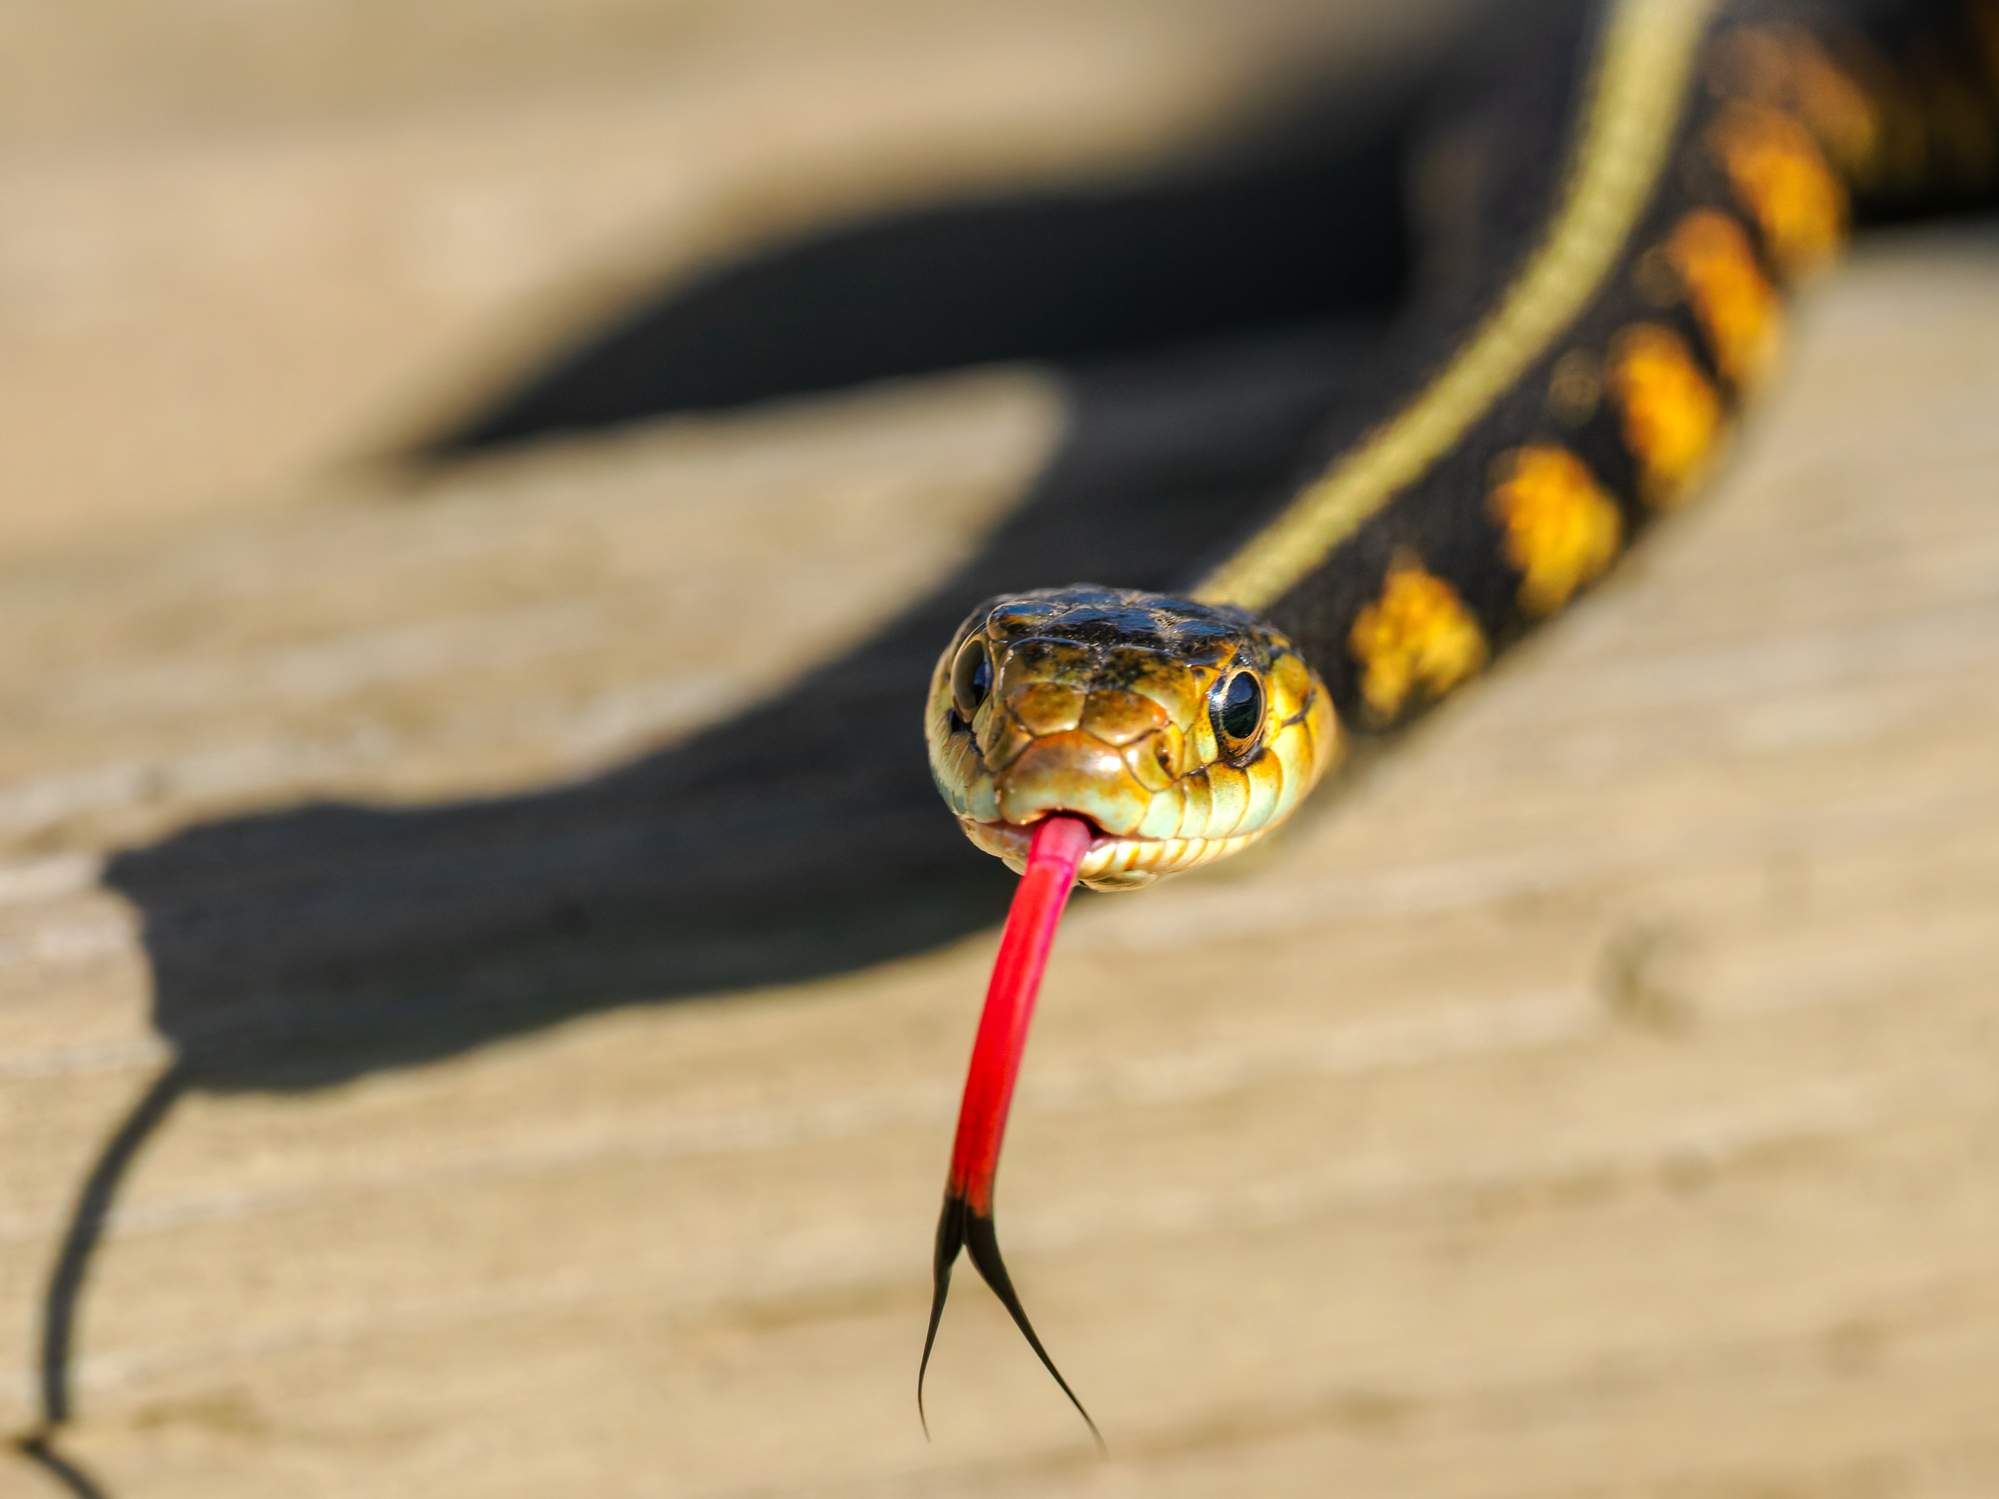
Some garter snake populations have evolved resistance to TTX, enabling individuals to eat rough-skinned newts without being fatally poisoned.
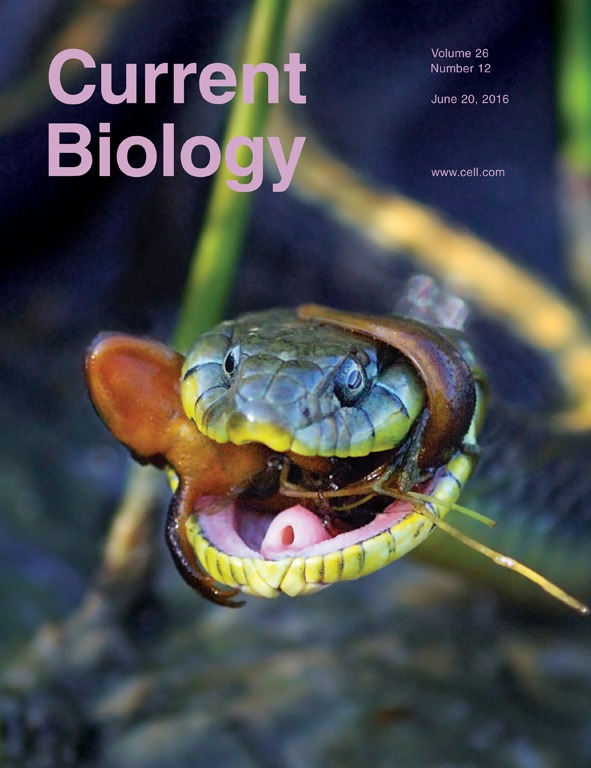
Newt populations vary in the average toxicity of their skin and snake populations vary in their level of resistance to the neurotoxic effects of TTX. In both the rough-skinned newt and two of its close relatives, the toxicity of the newts and the resistance of the snakes is broadly correlated across locations. This suggests that local populations of newts and snakes are both evolving in response to selection imposed by their interaction with the other.
The concentration of TTX in the skin of rough-skinned newts varies among individuals and appears to be heritable. Newts with more TTX in their skin are more likely to survive an encounter with a garter snake. I have built both patterns into SnakePit.
In real populations of rough-skinned newts, there appears to be at best a weak correlation among individuals between TTX concentration and belly color as it appears to snakes. To make TTX concentration a visible trait for human users, I have made belly color and TTX concentration perfectly correlated in SnakePit.
The Lab
This is where you’ll find the experimental sandbox I mentioned above. Under the Lab tab, you’ll find two ponds with wild populations of rough-skinned newts, four tanks you can move newts to for your experiments, a control panel, and a set of graphs.
The landscape
The landscape has two ponds and four experimental tanks:
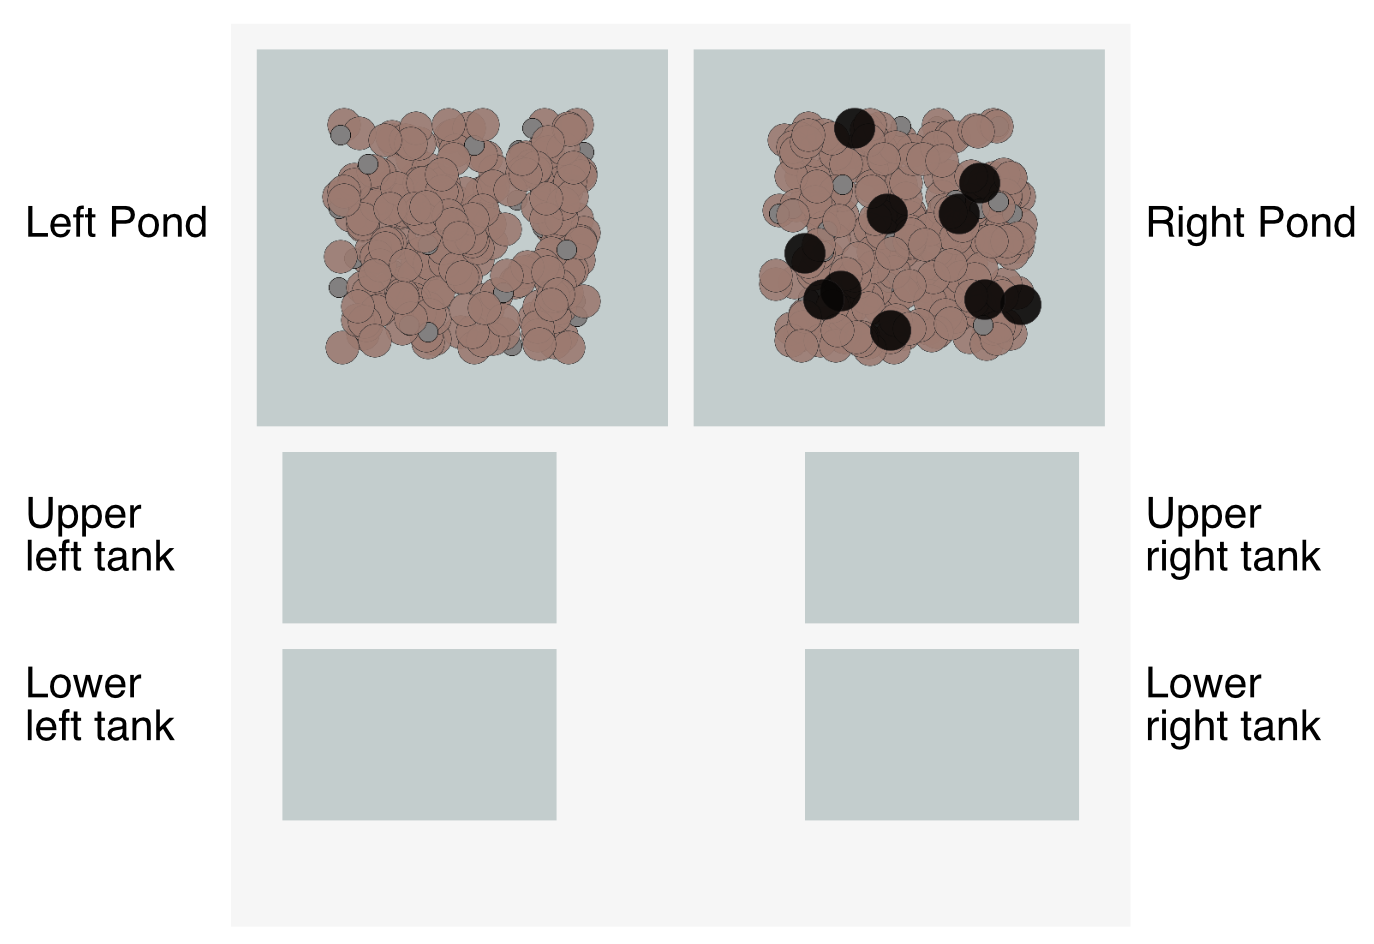
Left pond is home to a wild population of rough-skinned newts. Click-and-hold on a few to get a good look at them:
Examine a few newts in Right Pond too. Do you notice anything different about the newts in one pond versus the other?
The small gray dots are newt larvae:
The black dots in Right Pond are garter snakes:
You can click, hold, and drag newts, larvae, and snakes from place to place within a pond or tank. And you can drag them from one pond or tank to another. If you leave an organism anywhere in the light gray region around the ponds and tanks, it will immediately fall to the bottom of the region and will disappear forever as soon as you run the simulation (see below).
If you click, hold, and drag around a group of newts and/or larvae, you can select them all at once, then drag the collection to a new location. You cannot lasso and move snakes as a group.
The graphs
Each pond and tank has a corresponding graph in an analogous location:
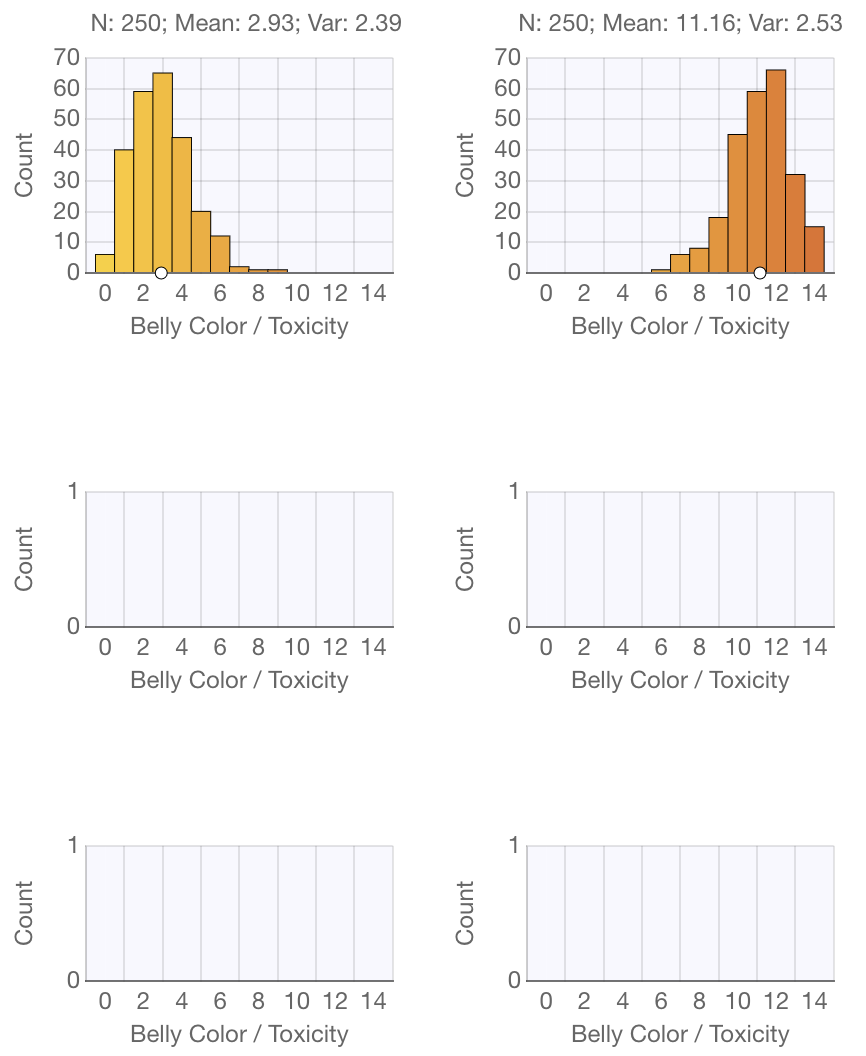
The graphs are histograms showing the distribution of belly color/toxicity among the newts. Note that the label above each graph shows the number of newts in each pond or tank, as well as the mean belly color/toxicity and the variance in belly color/toxicity.
You will see the graphs update in real-time as you move newts from place to place, as well as when newts are born, get eaten by snakes, or die of old age.
The control panel
Below the ponds, you’ll find a control panel:
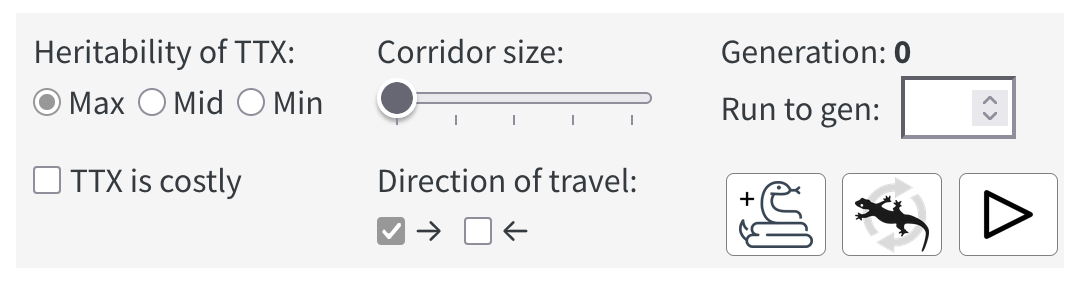
The controls in the control panel are arranged in three columns.
In the first column, a set of radio buttons allows you set the heritability of TTX production by newts at its maximum, middle, or minimum value. For most experiments, you’ll probably want to leave the heritability at its default setting of Max. Below the radio buttons, a check box lets you set whether the production of TTX comes at a cost to the newts—somewhat reducing their ability to reproduce—or not.
In the second column, an range slider lets you set the size of corridors than can allow newts to move between the Upper Left Tank and Upper Right Tank and between Lower Left Tank and Lower Right tank. Bigger corridors allow more movement between tanks. Below the slider, a pair of check boxes allow you to set which direction(s) newts can move via the corridors.
In the third column, a display labeled “Generation:” indicates how long the simulation has been running. Below this, a text-entry box lets you set the generation count at which you want the simulation to stop running. (If you decide you want to run it longer, you can add more time.) At the bottom there are three buttons, described below from left to right.
The add snake button allows you to add snakes to any pond or tank by clicking. Note when active, the add snake button turns into a clicking-cursor button—the clicking of which restores the cursor to its normal function.
The refresh newts button clears all the newts that are currently in any pond or tank, then adds 250 new newts each to Left Pond and Right Pond. The button does not remove snakes or reset other controls. This allows you to quickly replicate your experiment with a new set of newts—without having to adjust any of the other controls.
The Start / Stop button allows you to run or pause the simulation. When you run the simulation, you’ll see the newts, larvae, and snakes, move around. When two newts cross paths, you may see them produce a pair of offspring. When a newt and a snake cross paths, you may see the newt disappear as it gets eaten by the snake. The lighter the newts belly color the less TTX it has in its skin and the more likely it is to get eaten.
If you want to reset the entire lab and restore all controls to their default setting, use the Reset item in the main menu.
Suggested Experiments
For each suggested question, state a hypothesis about the answer.
Design an experiment to find out if you’re right. What are your treatment groups? How long will you run the simulation? What data will you record? What kind of graphs will you make to analyze the data?
Sketch cartoon graphs showing what the data will look like if your hypothesis is correct versus incorrect. Then collect some data, plot them in a graph, and compare to your predictions.
It’s a good idea to do some trial runs of your experiment before you commit to a final design. Is your setup accomplishing what you intend it to? Is it giving you the data you need? Will you be able to make the kind of graph you want to?
If you organize your data in tidy format, you can analyze them with ardeaPlot and/or ardeaStat. As described by Hadley Wickham, a table of data is tidy when:
Each variable is a column; each column is a variable.
Each observation is a row; each row is an observation.
Each value is a cell; each cell is a single value.
To analyze your data in ardeaPlot and/or ardeaStat, use any spreadsheet software to organize your data in tidy format, then export it to a CSV file.
1) Does the rate of evolution vary with the strength of selection?
The more snakes in a tank, the more newts they’ll eat. This means the newt population is under stronger selection to make lots of TTX. Does stronger selection lead to faster evolution? Design and run an experiment to find out.
For your treatment groups, you’ll need experimental tanks of newts with different numbers of snakes. Be aware, however, that if you add too many snakes to a tank they’ll simply eat all the newts.
I suggest setting up each tank with a substantial starting population of newts—50 or 60, for example. Take them all from the same pond. (Will you want to take them from Left Pond or Right Pond? Why?)
I suggest running each simulation for several generations—perhaps four, five, or six—but not for much longer. (Why?)
Finally, you’ll want to record the average belly color/toxicity in each tank at the start and end of each replicate run. A bigger shift in means in a set number of generations would represent faster evolution. (What kind of graph will you use to plot your data?)
2) How does migration affect differences among populations?
The newt population in Right Pond has a much higher mean belly color / toxicity than does the population in Left Pond. (Indeed, the distributions for toxicity barely overlap.) If you move a sample of newts from Left Pond to Upper Left Tank, and a sample from Right Pond to Upper Right Tank, the populations should show roughly the same difference in means as the source populations. However, selection on toxicity due to predation by snakes has been eliminated. What will happen if individuals move between ponds? Will the amount of gene flow matter?
I suggest setting up each tank with a substantial starting population of newts—at least 50 or 60. (Why?)
You can do two replicates of your experiment at a time: one involving gene flow between the upper tanks; the other involving gene flow between the lower tanks. You need to run each replicate long enough for the migrants to interbreed with the newts in their destination tank. But you don’t want to run it too long. (Why?) A couple of generations might be about the right length.
One way to assess the affect of migration is to calculate the difference in means between the right tank versus the left tank in each pair. (What kind of graph will you use to plot your data?)
3) Can gene flow disrupt local adaptation?
Long exposed to predation by snakes, the newt population in Right Pond has evolved high concentrations of TTX (with the belly color to match). Can such a population maintain its adapted state despite gene flow from a nearby population with low TTX production? Does the amount of gene flow matter?
I suggest setting up your experimental tanks with at least 50 or 60 newts each. (Why?)
You can do two replicates at a time: one involving gene flow via the upper corridor; the other involving gene flow via the lower corridor. It will be simplest to set up your tanks with newts from the pond above them. You’ll probably want to allow migration from left to right only—that is, migration from a population that is not adapted to frequent predation by snakes to a population that is adapted to frequent predation. (Experiments with 2-way migration would be interesting too.)
You’ll want your populations that are adapted to predation to be under continuous selection to maintain that adaptation. (Why?) One, two, or (maybe) three snakes per tank is probably about right.
You’ll want to run each replicate for several generations—six or seven, perhaps.
One way to assess the effect of migration from a non-adapted population into an adapted population is to record the mean of the adapted population at the start and end of the run, then calculate the difference. (What kind of graph will you make with the data?)
4) Does the potential of a population to evolve in response to selection vary with the number of founders?
The amount of genetic variation present in a newly-founded population should correlate with the number of founders. Does this, in turn, affect how much or how fast the population will evolve in response to selection?
Getting a clear answer to this question will require you to take extra care setting up your experimental populations. It may require more replicates than the other suggested experiments. This question is also, by my lights, one of the most interesting on my list.
I suggest that you focus on very small numbers of founders and pretty large numbers—say, two versus fifty—and run at least twelve replicate tanks with each number of founders. (Why?)
You’ll want your newt populations to be under strong selection. I’d suggest taking the founders from Left Pond and adding 3 or 4 snakes to each tank. This creates a problem, however. (What happens if you add two newts and three snakes to a tank and click run?) One solution is set up each population with no snakes, run the simulation for one generation, then add the snakes. Also, make sure your founders have the opportunity to mate and make babies—by putting them on top of each other.
You’ll want to run each replicate for a fairly long time after you add the snakes. (Why?) Ten or twelve generations might be about right.
One way to assess how much/how fast a population has evolved is to record the mean at the start of selection (when you add the snakes) and end of the run and calculate the difference. (What kind of graph will you use to plot the data?)
5) Is “pressure” an apt metaphor for selection?
Evolutionary biologists often use the term “selection pressure” as a metaphor for natural selection. This idea envisions selection as a force that pushes the mean phenotype of a population to a new value—like a puff of air from this pipe pushes the ball upward:
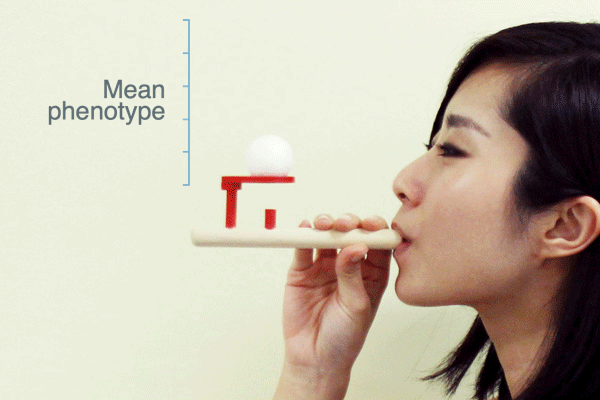
As Ross H. Nehm and colleagues have pointed out, this metaphor suggests that when selection stops the population mean will return to where it was before selection. Is this what populations actually do when selection ceases?
You’ll want to setup all your replicate populations with newts from left Pond. (Why?) I suggest starting each tank with at least 50 or 60 newts. Expose the newts to selection by adding 2 or 3 snakes. Run the model for, say, 5 generations. Then take the snakes away and run the model for five generations more.
You can assess whether the population shifts back toward where it started by looking at the difference between the mean after five generations of relaxed selection versus the mean after five generations of selection. Is the mean after relaxed selection smaller, larger, or the same as it was after selection? If you also record the mean at the very start of the experiment, before selection, you could do additional calculations that might also be interesting. (What kind of graph will you use to plot your data?)
The Model
Belly color / Toxicity
In the newts, belly color and toxicity are the same trait. A newt’s phenotype can range from 0 to 14. Phenotype is determined by both the newt’s genotype and its environment.
The newt genome contains seven unlinked loci, each with two alleles: 0 and 1. A newt can thus have anywhere from 0 to 14 copies of 1 alleles. All else being equal, the more 1 alleles a newt has, the higher its belly / toxicity score.
The environmental influence on phenotype is a normally-distributed random variable. Positive values increase toxicity, while negative values decrease it.
When the heritability is high, a newt’s phenotype is mostly determined by its genotype. When heritability is low, a newt’s phenotype is mostly determined by the random environmental influence.
Life history
After being born newts spend time as larvae, then mature into adults. When adults collide with each other, they may mate and produce a pair of offspring. The model doesn’t distinguish between male versus female newts, so any adult newt can mate with any other adult newt. Inheritance is diploid and particulate—that is, Mendelian. If it doesn’t get eaten by a snake, a newt eventually dies of old age.
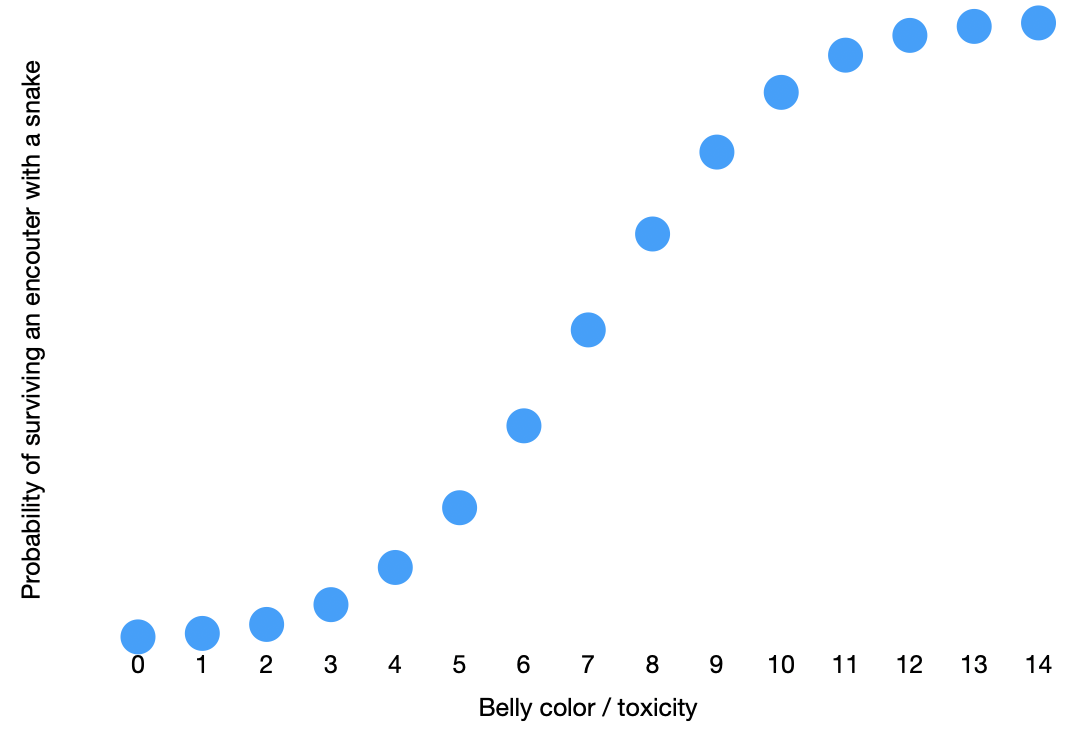
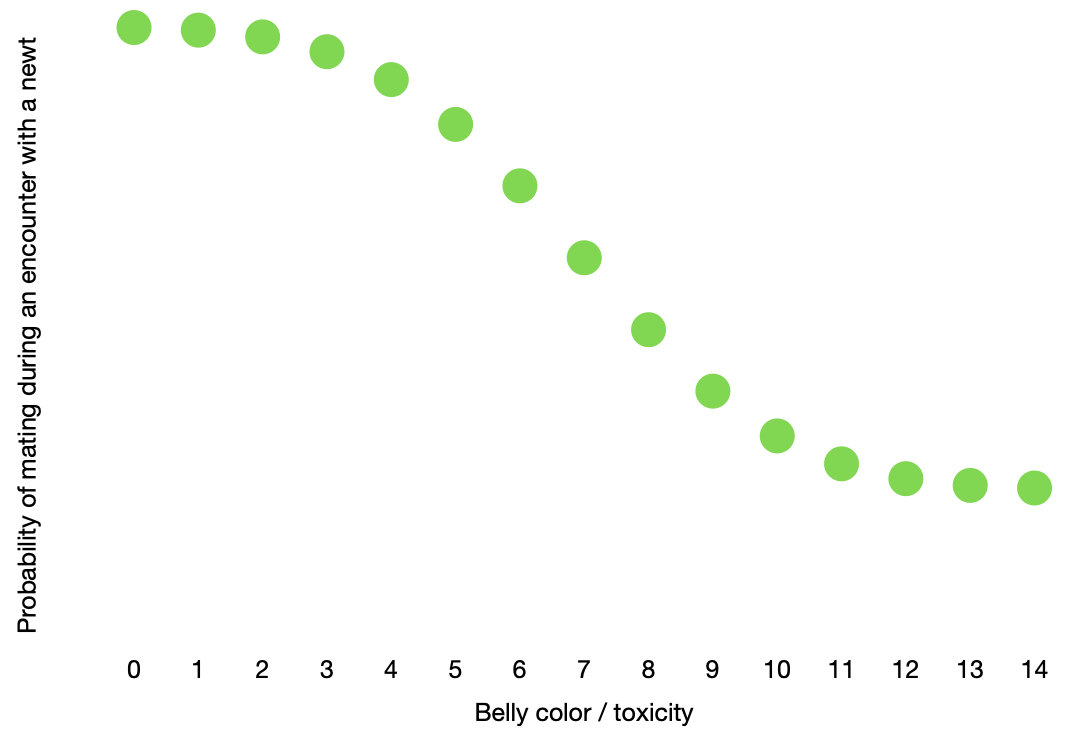
Predation
The probability that a newt will survive if it bumps into a snake is proportional to the newt’s belly color / toxicity score:
Cost of TTX
When the “TTX is costly” box is not checked, the probability of that a newt will produce offspring when it collides with another newt is unrelated to either newt’s belly color / toxicity score.
When the “TTX is costly” box is checked, the probability that a newt will produce offspring when it collides with another newt is proportional its own belly color / toxicity score:
© 2026 by Jon C. Herron