|
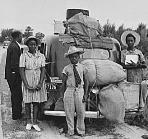
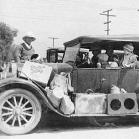
Supplemental Table 1: San Joaquin Valley 1939,
1949, 1969: family income, poverty, and male occupations
·
In California's San Joaquin
Valley southern white migrants were often employed as farm workers in
the 1930s and 1940s but gradually found better jobs
·
Poverty rates among
southern whites in the valley remained high until 1969 |
|
|
South-born whites |
Other whites |
Blacks |
Latinos |
Asian /Pacific |
|
1939: |
|
|
|
|
|
|
Median family income |
$800 |
$1,453 |
$312 |
$670 |
$600 |
|
% white collar |
14% |
25% |
6% |
5% |
12% |
|
% skilled/
semi-skilled |
24% |
29% |
15% |
10% |
3% |
|
% farm labor/
unskilled* |
55% |
27% |
77% |
73% |
67% |
|
% farm owner/manager |
7% |
19% |
2% |
13% |
18% |
|
TOTAL |
100% |
100% |
100% |
101% |
100% |
|
N |
503 |
1,569 |
48 |
118 |
93 |
1949:
|
Median family income |
$2,850 |
$3,150 |
$1,250 |
$1,750 |
$1,550 |
|
% below poverty |
38% |
33% |
63% |
58% |
60% |
|
% white collar |
18% |
31% |
2% |
9% |
12% |
|
% skilled/
semi-skilled |
41% |
34% |
24% |
16% |
4% |
|
% farm labor/
unskilled* |
36% |
19% |
70% |
69% |
75% |
|
% farm owner/manager |
5% |
16% |
4% |
6% |
9% |
|
TOTAL |
100% |
100% |
100% |
100% |
100% |
|
N |
1019 |
2048 |
147 |
388 |
118 |
1969:
|
Median family income |
$7,050 |
$8,050 |
$3,650 |
$5,550 |
$7,050 |
|
% below poverty |
16% |
15% |
41% |
29% |
18% |
|
% white collar |
24% |
37% |
17% |
12% |
23% |
|
% skilled/
semi-skilled |
46% |
34% |
29% |
28% |
12% |
|
% farm labor/
unskilled* |
28% |
23% |
51% |
57% |
56% |
|
% farm owner/manager |
3% |
5% |
2% |
3% |
9% |
|
TOTAL |
101% |
99% |
99% |
100% |
100% |
|
N |
963 |
3425 |
194 |
810 |
155 |
* Includes service jobs
Source: 1940 IPUMS, 1950 IPUMS, 1970 State F1 IPUMS |
|
Supplemental Table 2: 1939 family income and male
occupations for nonMetropolitan counties in the Great Lakes states
·
Southern whites were not
particularly associated with farm labor in the Great Lakes states nor
with rural poverty
·
Only in rural Indiana did
incomes of southern whites approach the low levels found in the San
Joaquin Valley at the end of the 1930s but not because of farm labor
jobs |
|
1939: |
Ohio |
Indiana |
Illinois |
Michigan |
|
Southern whites: |
|
|
|
|
|
Median family
income* |
$1,000 |
$841 |
$1,060 |
$1,200 |
|
% male farm
owners |
22% |
25% |
11% |
11% |
|
% male farm
laborers |
7% |
4% |
14% |
16% |
|
Other US-born
whites: |
|
|
|
|
|
Median family
income |
$1,150 |
$1,068 |
$1,000 |
$1,200 |
|
% male farm
owners |
23% |
24% |
24% |
20% |
|
% male farm
laborers |
6% |
6% |
9% |
6% |
* wage and salary income
only. Households headed by a person who indicated self employment excluded
Source: 1940 IPUMS |
|
Supplemental Table 3: 1950
Family income and male occupations for Southerners living in
three nonSouth regions |
MidAtlantic states:
|
|
South-born blacks |
Other blacks |
South-born whites |
Other U.S.-born whites |
Foreign-born whites |
Latinos |
|
Median family income |
$2,050 |
$2,050 |
$3,450 |
$3,250 |
$3,050 |
|
|
% white collar |
14% |
21% |
40% |
37% |
32% |
24% |
|
%
skilled/semi-skilled |
37% |
38% |
42% |
45% |
44% |
45% |
|
% laborers/ service |
48% |
40% |
14% |
13% |
22% |
30% |
|
% farmers/ farm
labor |
2% |
1% |
3% |
4% |
2% |
1% |
|
% TOTAL |
101% |
100% |
99% |
99% |
100% |
100% |
|
N |
3823 |
2277 |
2103 |
89730 |
4225 |
1081 |
East North Central
states:
|
|
South-born blacks |
Other blacks |
South-born whites |
Other U.S.-born whites |
Foreign-born whites |
Latinos |
|
Median family income |
$2,350 |
$1,950 |
$3,050 |
$3,150 |
$3,250 |
|
|
% white collar |
10% |
17% |
23% |
32% |
25% |
21% |
|
%
skilled/semi-skilled |
44% |
39% |
56% |
45% |
50% |
47% |
|
% laborers/ service |
46% |
42% |
14% |
11% |
19% |
29% |
|
% farmers/ farm
labor |
1% |
3% |
7% |
12% |
5% |
3% |
|
% TOTAL |
101% |
101% |
100% |
100% |
99% |
100% |
|
N |
4651 |
1733 |
6698 |
87896 |
2315 |
491 |
Pacific states:
|
|
South-born blacks |
Other blacks |
South-born whites |
Other U.S.-born whites |
Foreign-born whites |
Latinos |
|
Median family income |
$2,350 |
$2,450 |
$3,050 |
$3,450 |
$2,850 |
|
|
% white collar |
11% |
21% |
27% |
40% |
32% |
13% |
|
%
skilled/semi-skilled |
34% |
36% |
45% |
39% |
33% |
36% |
|
% laborers/ service |
52% |
38% |
16% |
13% |
22% |
25% |
|
% farmers/ farm
labor |
4% |
6% |
12% |
8% |
12% |
26% |
|
% TOTAL |
101% |
101% |
100% |
100% |
99% |
100% |
|
N |
1305 |
253 |
5445 |
31728 |
1143 |
2436 |
Source: 1950 IPUMS |
|