 |
|||||||||||||||||||||||||
Economics
301
|
|||||||||||||||||||||||||
|
Last updated: January 11, 2000 Note: These notes are preliminary and incomplete and they are not guaranteed to be free of errors. Please let me know if you find typos or other errors. Determining Labor DemandAssumptions
Example - Starbucks coffee companyAssumptions
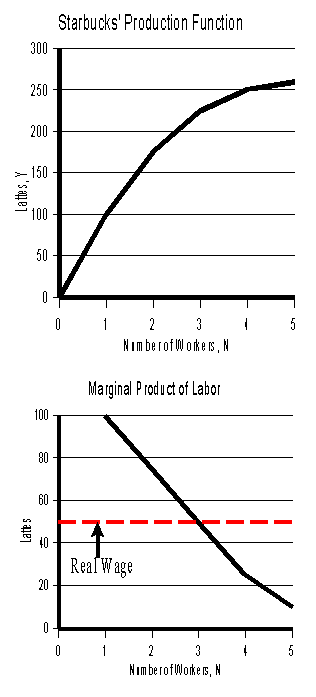
A worker's real wage, in terms of lattes, is w = W/P = ($100/day)/($2/latte) = 50 lattes/day Production Function
A graphical representation of the production function is given below.
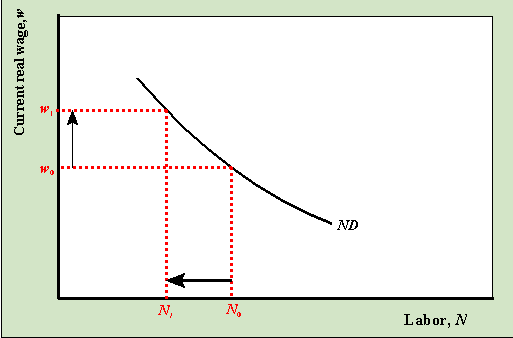
Determining Starbucks' demand for laborFrom microeconomics we know that Starbucks will continue to hire workers until the marginal product of hiring an additional worker is equal to the marginal cost of an additional worker. The marginal product of hiring an additional worker is the extra output generated by the worker: Marginal product of labor and the marginal cost of the worker is what the company pays for an additional work in terms of output produced: Marginal cost of labor Hence, Starbucks stops hiring workers at the point where MPN = w In the example above, MPN = w = 50 when N = 3 workers. If the real wage increases to 75 lattes/day then labor demand falls to N = 2 and if w decreases to 25 lattes/day then N increases to 4. Clearly, there is an inverse relationship between Starbucks demand for labor and the real wage. The Labor Demand CurveThe labor demand curve for a firm is a downward sloping function of the real wage. As the real wage increases workers become more expensive to firms and they demand less labor
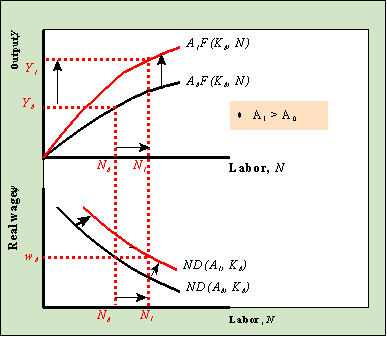
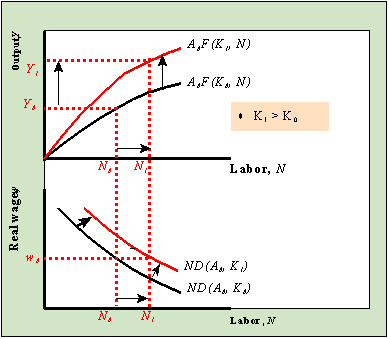
The shape of the labor demand curve, ND, is identical to the MPN curve which is derived as the slope of the production function. Therefore, any factor that shifts the production function will also shift the ND curve Factors that Shift the ND curve
These effects are illustrated in the figures below:
As productivity increases, the production function shifts up and simultaneously the labor demand curve shifts out and right. At a given real wage, more workers are hired and output increases. |
|||||||||||||||||||||||||


