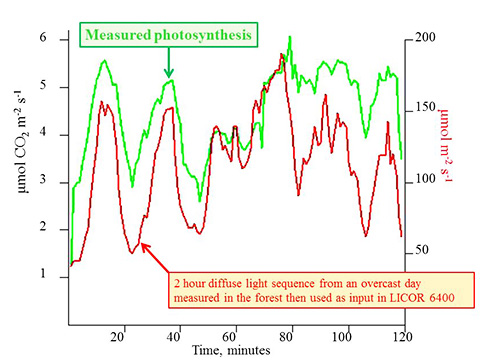

These differences were investigated using a simple model for photosynthesis. Prior to exposing the foliage to this light sequence the paraneters for the photosynthesis curve were estimated by exposing the foliage to a sequence of light levels which were held steady until a consistent photosyntheis level was reached. The carying light levels (red line) were then applied to this photosynthesis curve and an "estimated" photosyntheis (blue line) was produced. The difference between this calculated photosynthesis and the measured photosythesis (green line) is represented by the black line. There are some consistent differences over the sequence: during periods of decline in light measured photosynthesis does not decline as much as that calculated. Overall the calculated photosynthesis is less that that measured with the exception of the period around 60 min. Currently we are investigating these discrepancies, why they occur, and what this tells us about the process of foliage photosynthesis.
Mr Ziyu Ma investigated the response of Abies amabilis and Tsuga heterophylla to shade conditions on the Olympic Peninsula. A paper on this work has been submitted to the journal Tree Physiology.
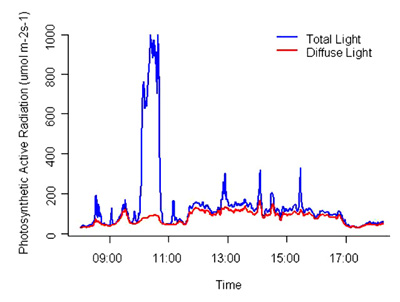
Generally ‘shade tolerance’ refers to the capacity of a plant to exist at low light levels but characteristics of shade can vary and must be taken into account in defining the term. We studied Abies amabilis and Tsuga heterophylla under a forest canopy in the north west of the Olympic Peninsula, United States which has low annual sunshine hours and frequent overcast days. Using BF3 sunshine sensors we surveyed diffuse and total light received by saplings growing under a range of canopy openness up to 30%. We measured variation in photosynthetic capacity over the growing season and within days and estimated photosynthesis induction in relation to ambient light. Three components of shade tolerance are associated with variation in light climate:
- Total light on the floor of an 88 y stand of naturally regenerated Tsuga heterophylla was greater on overcast than clear days. Light on overcast days varied throughout the day sometimes with a cyclical pattern.
- Photosynthetic capactity, Amax, varied both through the growing season and within days. Amax was generally greater in the latter part of the growing season, being limited by temperature and stomatal conductance, gs, at times during the early part. Saplings in more shaded areas had lower Amax and in the latter part of the growing season Amax was found to decline from mid-afternoon.
- Two patterns of photosynthesis induction to increased light were found. In a mean ambient light of 139 μmol m-2 s-1 induction had a curvilinear response to a step increase in light with a mean time constant, τ, of 112.3 s. In a mean ambient light of 74 μmol m-2 s-1induction had a two part increase: one with τ1 of 11.3 s and the other with τ2 184.0 s. These are the smallest published values of τ to date.
Both variation in photosynthetic capacity and induction are components of shade tolerance where light varies over time. Amax acclimates to seasonal and diurnal changes in light and varies between micro-environments. The rapid induction processes can cause a rapid response of photosynthesis to changes in diffuse or direct light.
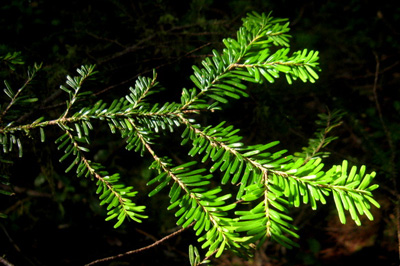
Abies amabilis

LiCor 64 amongst naturally regenerating Abies amabilis and Tsuga heterophylla.