Table of Contents
Monitoring Ground Deformation from the Wooded Island Earthquake Swarm at Hanford, Washington
Mika Thompson, ESS 590: Introduction to Radar Interferometry
Introduction and Background
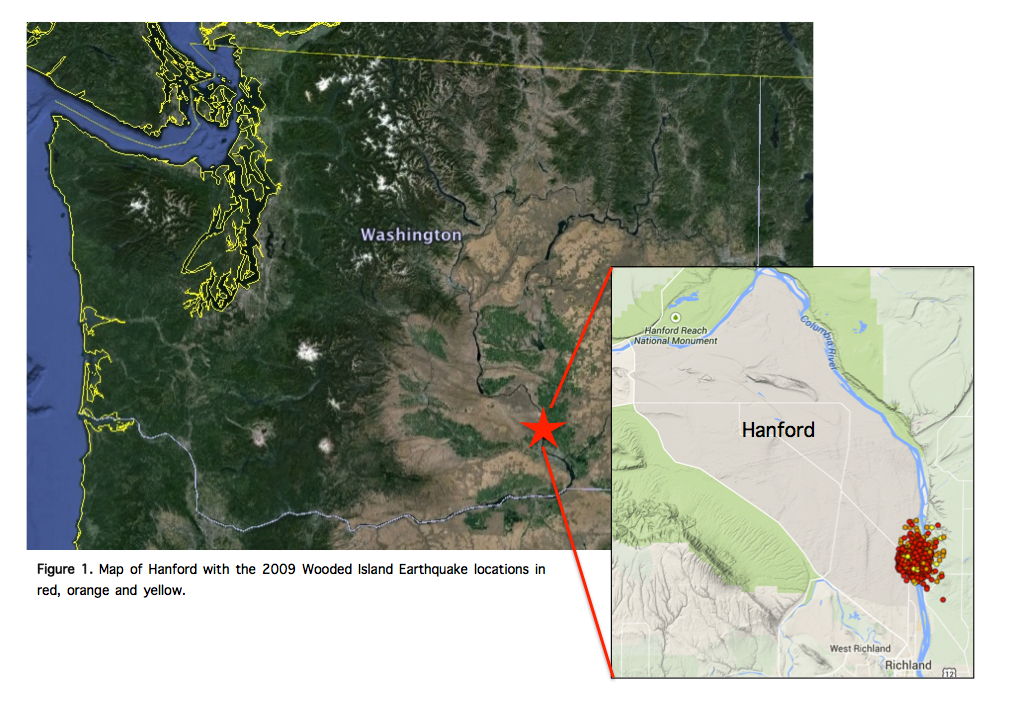
The Hanford Nuclear Reservation located on the Columbia River in Eastern Washington has been subject to seismic swarm activity for the past several decades. The site sits above the Columbia River basalt (CRB) flows that make up the Columbia Basin in southeastern Washington. It also falls within the region of the seismically active Yakima fold and thrust belt (YFTB) [Blakely et al., 2012]. A major swarm occurred between 1969 and 1970 followed by two smaller ones in 1975 and 1988 [Wicks et al., 2011]. The most recent event began in January of 2009 just south of Wooded Island (Fig. 1) and continued throughout the year. It is the first recording of clustered, shallow earthquakes in this area where geodetic measurements of surface deformation were available for analysis. Since then low-magnitude shallow events have continued to occur at the site.
Earthquakes are major cause for concern in this area because of Hanford’s historical role in plutonium production for nuclear weapons during World War II. Plutonium manufacturing is an inefficient process that produces large amounts of solid and liquid waste [www.hanford.gov]. Until the Hanford reactors were mostly decommissioned in the 1980s, solid wastes were buried in pits or trenches on the Hanford Reservation and liquid wastes were poured on to the ground or stored underground in storage tanks [www.hanford.gov]. Ground deformation caused by earthquakes and aseismic slip on or near the reservation could potentially cause toxic waste leakage into the groundwater used by the homes and farms surrounding Hanford.
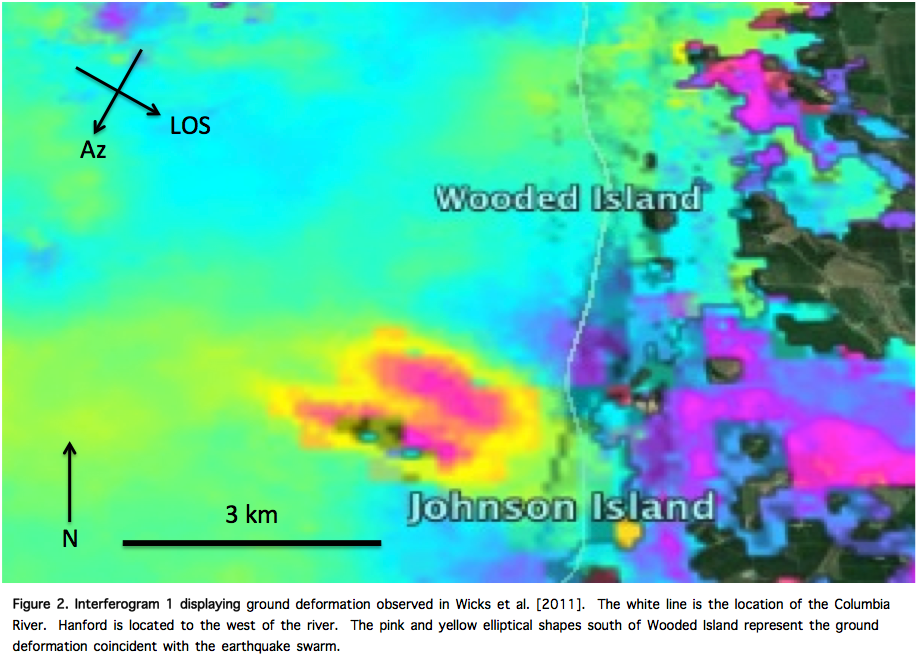
In a previous InSAR study of the 2009 Wooded Island earthquake swarm by Wicks et al. [2011], surface deformation was identified on the nuclear reservation coincident with the earthquake swarm (Fig. 2). Wicks et al. [2011] observed ground displacement caused by ~1500 shallow earthquakes and aseismic slip between February 2009 and October 2009. They constructed a model of the fault environment, which consisted of a shallow thrust fault and a nearly horizontal fault that they theorized would fall within a thixotropic sediment layer between basalt flows. The thixotropic layer was proposed as an explanation for why the modeled geodetic moment of the planar fault was eight times greater than the cumulative seismic moment of the swarm. According to Wicks and his group, silt and clay interbedded between the CRB layers may have thixotropic properties that reduce the viscosity of the sediments when pressure is increased. When the sediment layers are stressed beyond their yield strength they behave like a lubricant and facilitate aseismic slip.
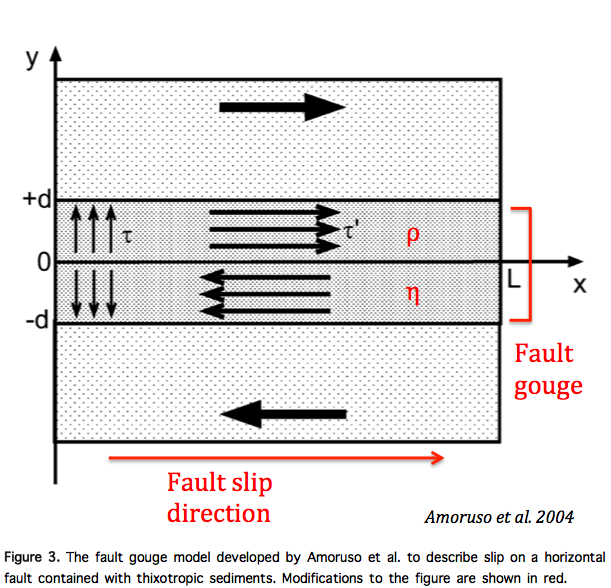
Wicks’ 2011 paper also suggested that a fault gouge model similar to one developed by Amoruso et al. [2004] could be used to describe the aseismic slip along the bedding plane fault. The fault slip model, shown in Fig. 3 consists of a gouge between planar fault layers filled with unconsolidated sediments with viscoplastic properties. A pressure pulse caused by seismicity or a breach in a permeability barrier at one end of the fault causes stress to increase on the fault. When the yield stress is exceeded the sediments in the gouge would begin to exhibit linear viscous fluid behavior, which would lead to ground displacement.
Amoruso and Wicks’ fault models describe a possible fault mechanism, however the origin of the pressure pulse is still inconclusive [Wicks et al., 2011; Blakely et al., 2012; Gomberg et al., 2012]. Several triggers have been suggested for faulting in this region. Gomberg et al. [2012] attempted to find a correlation between groundwater changes and increased seismicity rates by plotting seismic event locations over a map of ground water changes. They also looked for a relationship between irrigation of the farms surrounding Hanford and increased earthquake activity. Both analyses were inconclusive [Gomberg et al., 2012].
Aeromagnetic data was also used to try and find the cause of the swarm. A concealed portion of the Yakima Ridge anticline, a structure within the Yakima Fold and Thrust Belt, was found to extend beneath the location of the Wooded Island swarm [Blakely et al., 2012]. Blakely and his group determined that the northwest strike of this anticline ran parallel to the strike of the largest earthquake detected within the swarm, and also coincided with the ground deformation found in Wicks’ paper. He proposed that while fluids may play a role in the seismicity at Hanford, regional scale horizontal compression was the driving force of the swarm activity.
While there have been several papers dedicated to understanding the earthquake swarm activity and deformation in the Hanford area, the purpose of this study is focused on the evolution of the ground deformation on the Hanford Site. My intent is to also look for seasonal fluctuations in groundwater and irrigation practices at the farms in the region using InSAR methods. InSAR could reveal more subtle changes in ground displacement than the groundwater maps used in Gomberg’s 2012 paper.
Methods
SAR data collected for this project between 2009 and 2010 by the European Space Agency’s (ESA) ENVISAT over Eastern Washington was used to measure line-of-site ground displacement on the Hanford reservation. Because there were very few scenes available, I chose to generate interferograms from all SAR pairs with a perpendicular baseline less than 200 m (Table 1; Fig. 2; Fig. 4). The interferograms were processed using the open-source Repeat Orbit Interferometry Package (ROI_PAC) code and a digital elevation model (DEM) produced from the Shuttle Radar Topography Mission (SRTM) to correct for the topographic component in the SAR data.
To aid in differentiating between atmospheric effects and ground deformation in the interferograms, I performed a query of earthquake locations near Wooded Island on the Pacific Northwest Seismic Network website [www.pnsn.org]. Kml files were generated with earthquake swarm magnitudes and locations that coincided with the master and slave dates of the interferograms. The earthquake locations were analyzed together with kmz files of my georeferenced interferograms in Google Earth.
I used the ENVI program to make horizontal profiles through interferograms that showed signs of deformation. Radians of phase difference on the vertical axis of the profiles were converted to centimeters of vertical displacement using the equation
where phi is the phase difference in radians, lambda = 5.6 cm is the ENVISAT pulse wavelength, and d is the vertical displacement in the line of sight. Though this isn’t an accurate measurement of ground displacement, it is sufficient to check for errors and the feasibility of the displacement values.
Results
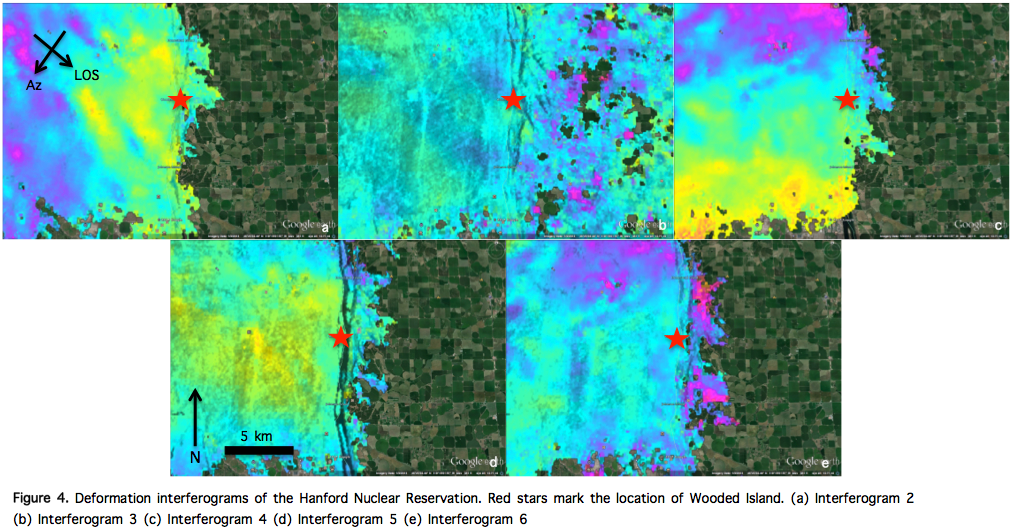
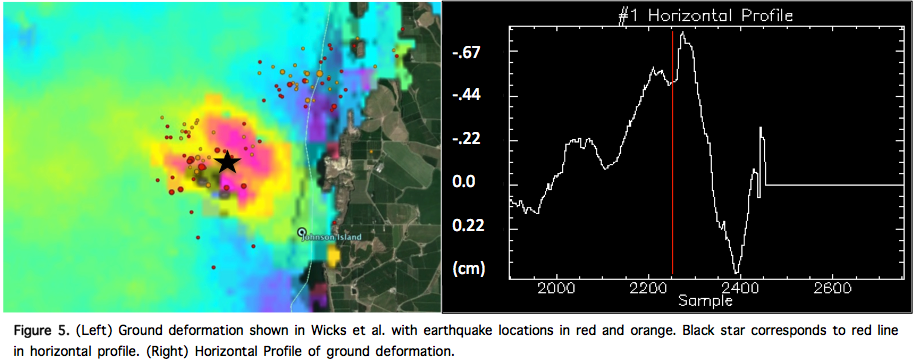
Six interferograms were produced over the area of interest (Fig. 4). Interferograms 1 and 2 (Table 1; Fig. 2; Fig. 4a) were created from scenes previously studied in Wicks’ 2011 paper. Interferogram 1 (Table 1; Fig. 2) shows ground deformation south of Wooded Island. The deformation spans ~3 km in the east-west direction. A horizontal profile cut through this section (Fig. 5) shows that there was a maximum subsidence of ~7 mm in the line-of-sight direction. Interferogram 4 (Table 1; Fig. 4c), which spans full time period of my research project, shows evidence of atmospheric effects over the Hanford Site but no deformation that matches with the earthquake locations. There may be a small amount of deformation in interferogram 2 (Table 1; Fig. 4a), however it shares a slave scene with interferogram 5 (Table 1; Fig. 4d), which shows extensive atmospheric effects in the same area. The remaining interferograms fall within the master and slave dates of interferogram 4 and also display no definite signs of ground deformation.
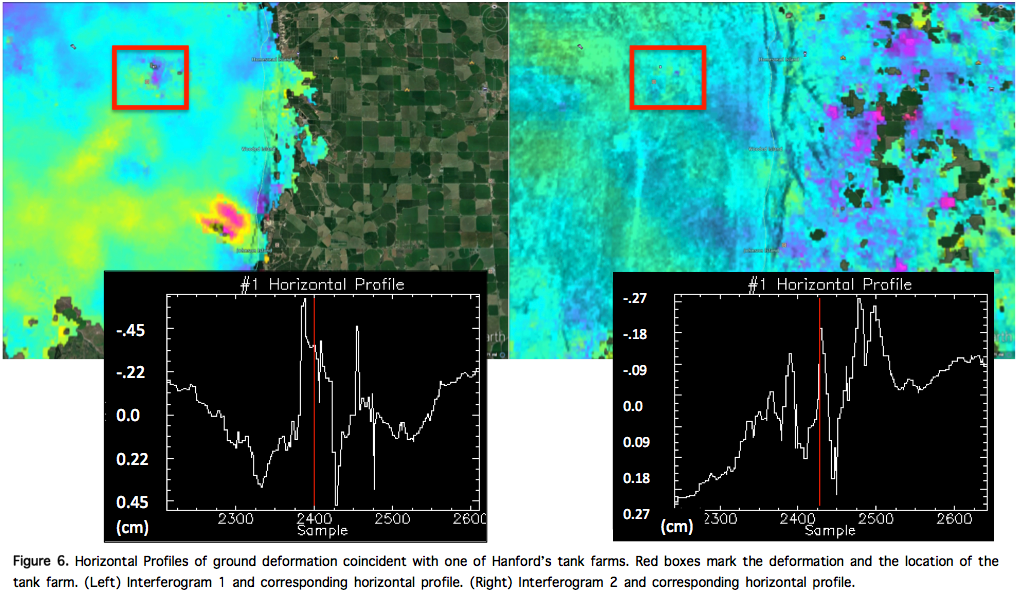
I observed some ground deformation in interferogram 1 and 3 that coincides with the location of one of Hanford’s tank farms (Fig. 6). Horizontal profiles reveal line-of-sight vertical subsidence of ~3 mm and ~2 mm respectively. The displacement is concentrated entirely to the location of the tank farm facility.
No observations were made of seasonal variations in groundwater or changes in irrigation practices because of phase decorrelation over the farmland areas east of Hanford. Interferogram 3 (Fig. 4b) does show phase differences over the farm areas, but I could not differentiate between ground displacement and artifacts in the interferogram without more information. In interferogram 3 (Fig. 4b), yellow marks areas of potential uplift and pink marks areas of subsidence.
Discussion
A minimal amount of SAR scenes available over the Hanford Site resulted in only 6 total interferograms spanning from May 2009 to July 2010. Ground deformation coincident with the Wooded Island Earthquake Swarm is only visible in interferogram 1 (Fig. 2). During the time period spanning Wicks’ study, ~1500 seismic events with magnitudes ranging from -0.3 to 3.0 produced a maximum of ~7 mm of vertical displacement. From October 2009 to July 2010, there were ~120 small earthquakes with similar magnitudes. It is possible that any displacement caused by these events is too small to be detected using interferometry. Creating a time series of scenes with a smaller temporal gap might reveal the evolution of ground deformation over time and help to differentiate between atmospheric effects and actual changes occurring at the site. Stacking interferograms could also reduce artifacts.
Fortunately, there is no topography and very little vegetation on the Hanford Reservation. The abundance of farmland to the east of the site, however, left large gaps in almost all of the interferograms where vegetation was concentrated. These areas showed no coherence in the wrapped interferograms and created some challenges when attempting to unwrap phases. The solution to this was to manually choose seed coordinates to initiate the unwrapping process from the wrapped interferograms that showed the best coherence near the center of each frame, usually centered on the reservation itself. No analysis of correlation between groundwater and deformation could be made because of decorrelation over the farms. Perhaps a different technique such as the permanent scatterer InSAR method presented by Hilley et al. [2004] would reveal a pattern between seasonal groundwater changes and seismicity. Hilley et al. [2004] used this technique to find the rates and variation in the rates of slow-moving landslides on the Hayward Fault in the San Francisco Bay area. By using the houses and buildings distributed throughout the crop fields as permanent scatters, changes in the rates of groundwater influx could be revealed and then correlated with seismicity increases.
The only interferograms to show ground deformation that wasn’t discussed in Wicks et al. [2011] was located at one of the tank farms on the Hanford property (Fig. 6). The tank farms store millions of gallons of solid and liquid waste from the production of plutonium during WWII and the Cold War. These storage tanks were only meant to store waste temporarily. Between 1968 and 1986, Hanford engineers built 28 new reinforced tanks and pumped in all liquid waste [www.hanford.gov]. They are currently working on transferring solid wastes in to these “double shell tanks”. Subsidence at the tank farm (Fig. 6) could be due waste transfer between tanks.
Future InSAR work on the Hanford Site would require a larger data set than what was available in the ENVISAT archive. Ideally, SAR scenes at a minimum of one-month intervals would be needed to produce a time series of deformation evolution and to use the permanent scatterer technique. A larger data set would also allow researchers to choose SAR pairs with the smallest perpendicular baselines, which would reduce decorrelation. This is illustrated in interferograms 1 and 2 (Table 1; Fig. 2; Fig. 4), which show the clearest illustration of deformation and the best resolution over vegetation respectively.
Conclusions
Hanford has been storing nuclear waste in the ground for the past several decades and that is unlikely to change in the near future. From previous studies we know that ground deformation from seismicity can be detected using InSAR, however because of limited data availability I was unable to determine if deformation has continued since then. Historically seismic swarms have been a regular occurrence at various locations on the Hanford Site. Continued monitoring of seismic activity and ground deformation at the site is necessary to avoid hazardous waste leakage into the local aquifer within the Columbia River basalt layers. InSAR is a powerful tool that is finding more and more uses in scientific research. It has only been five years since the first geodetic measurements were made of a Hanford earthquake swarm. In the future, perhaps more data will become available for this region and a source of increased seismic activity and ground deformation can be determined.
References
Amoruso, A., L. Crescentini, M. Dragoni, and A. Piombo (2004), Fault slip controlled by gouge rheology: a model for slow earthquakes, Geophysical Journal International, 159(1), 347–352, doi:10.1111/j.1365-246X.2004.02386.x.
Blakely, R. J., B. L. Sherrod, C. S. Weaver, A. C. Rohay, and R. E. Wells (2012), Tectonic Setting of the Wooded Island Earthquake Swarm, Eastern Washington, Bulletin of the Seismological Society of America, 102(4), 1786–1795, doi:10.1785/0120110189.
Gomberg, J., B. Sherrod, M. Trautman, E. Burns, and D. Snyder (2012), Contemporary Seismicity in and around the Yakima Fold-and-Thrust Belt in Eastern Washington, Bulletin of the Seismological Society of America, 102(1), 309–320, doi:10.1785/0120110065.
Hilley, G. E. (2004), Dynamics of Slow-Moving Landslides from Permanent Scatterer Analysis, Science, 304(5679), 1952–1955, doi:10.1126/science.1098821.
Wicks, C., W. Thelen, C. Weaver, J. Gomberg, A. Rohay, and P. Bodin (2011), InSAR observations of aseismic slip associated with an earthquake swarm in the Columbia River flood basalts, Journal of Geophysical Research, 116(B12), doi:10.1029/2011JB008433.

