InSAR Data
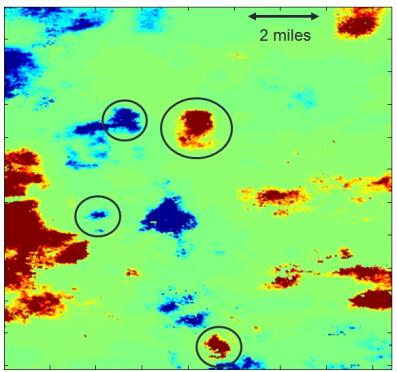
In Figure 7, below, we present one of the interferograms from the Powder River Basin. As we can see there are many different spots of large signal, with both signs of range increase (red) and decrease (blue) which correspond to subsidence and upheaval, respectively.
 |
| Figure 7: Interferogram of the House Creek Field for the 19980723-19991021 pair. Circled regions indicate regions on continuous signal through the time series and may be due to well activity. |
Highlighted are four regions that show more continuous behavior throughout the seven interferograms and may be associated with a well. It is harder to say what the other patches of signal represent. They could also be associated with well activity or it could be random atmospheric signals. In this work we will focus on the top left, blue site, labeled well B.
 |
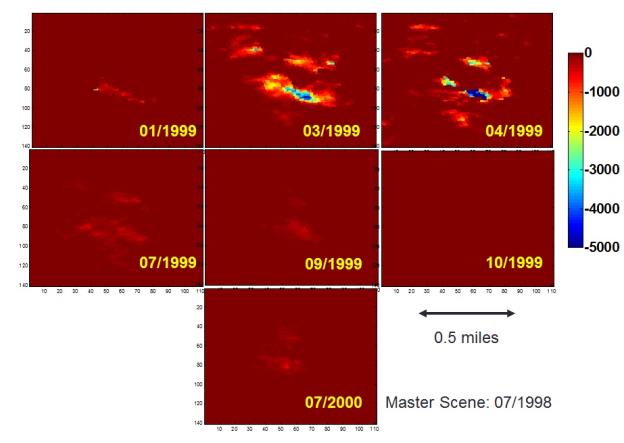
| Figure 8: Interferometric time series for Well B. The scale bar is improperly calibrated and contains no useful information beyond its sign. |
In Figure 8 we extract out just the phase change data around well B and plot it as a time series. Clearly the signal starts out small and rapid increases to maximum around March and April 1999 after which it decays back down to zero. Additionally we note that there is quite a bit of structure within each scene, possibly indicated the presence of multiple wells in the area. The spacing is approximately the well spacing as shown in Fig 5 of the House Creek field wells. Additionally it is important to point out that these signals are all negative, indicating a range increase or ground upheaval.
Quantitatively, there are some unresolved issues. The plots should be in radians, but, as the color bar on the right shows, the values of several thousand are unrealistic numbers for a phase. Actually deformation values are thus not obtainable, but we are still confident that the qualitative behavior of the images is still intact. The source of this processing error has yet to be found.
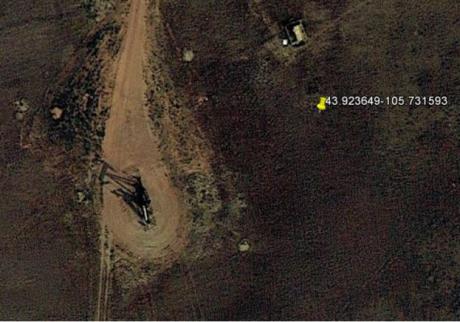
The next question is to see if we can find a well associated with these deformations. If we map the location of the largest signal from Figure 8 on Google Earth we find that indeed there is a well present.
From this coordinate information we can search through the Wyoming Oil and Gas Commission (WYOGCC) databases to find the drilling and production information about this well. This well (API 0523954) happens to be one of the older wells in this field and we drilled in 1978 around the time the reservoir was found. It has been continuously pumped since that time.
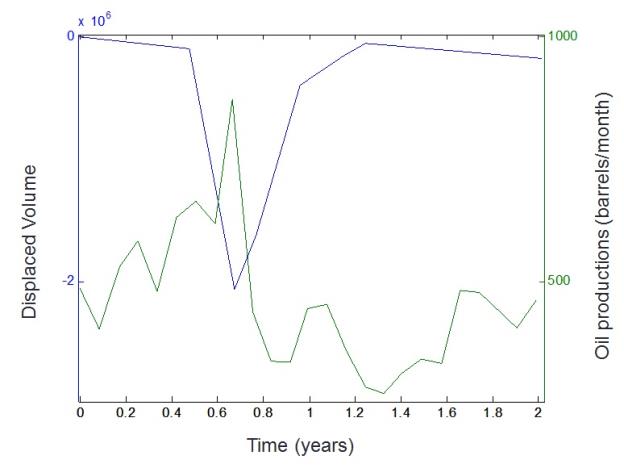
We can pull out the monthly production of this well for the time period of this study and plot it with the total integrate displacement volume of each scene in Figure 8 to look for a possible correlation between the two data sets. This is shown below.
Remarkably, both data sets show a spike in their signals around March 1999. Our well has a sudden increase in productivity at the same time there was a major upheaval of the surface. Again we note that the quantitative displaced volume on the left axis is not calibrated correctly, but the qualitative shape is still accurate. It is also important to note that the negative phase signal here indicates a surface uplift, which one would think may be due to hydraulic fracturing. Indeed the sudden spike in both signals may also be a smoking gun to a fracturing event which is a quick, singular event in time. However, the well we are considering has never been fractured. We believe that a nearby well may have been fractured during this time which may have caused the uplift in the area, as well as opened up new extraction channels for the well we are considering causing its increase productivity for this period. Unfortunately, we have yet to find any such well in this area that was fractured in the early month of 1999. This is not to say it doesn't exist, but just that it is hard to locate in the database.
Nevertheless or data clearly shows that we are able to resolve surface deformations associated with petroleum wells and correlate their temporal production with the satellite InSAR data.


