Appendix A
Additional Interferograms

Figure A1, 75km long portion of ERS2 interferogram from 3.09.07-4.13.07 with a perpendicular baseline of 25 meters. North is up, West to the right in this image. Further ERS2 data was not used given the poor quality of results even with very small baselines

Figure A2, HV-HH cross polarized ALOS interferogram for 12.13.10 - 01.28.11. Polarization errors in the HH data for 12.13.10 prevented like-polarized interferograms for much of the 2010-2011 winter. No ground deformation information is able to be derived from this image by the author.
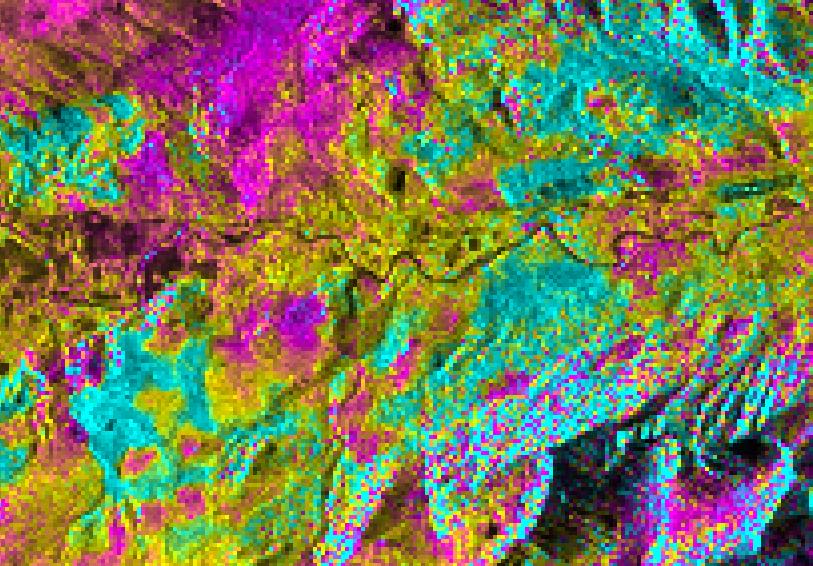
Figure A3, Long, 92-day, interferogram for ALOS 10.28.10 - 01.28.11 SAR data. This scene was developed to step over the bad 12.13 date, but also does not appear to produce useful data. Patchworks of like-phase signals persist throughout the image, obscuring any consistent ground signals. This is seen most clearly in the lower left of this image as pink squares.
